Vol.52, n. 5: pp. 1297-1312, September-October 2009
ISSN 1516-8913 Printed in Brazil BRAZILIAN ARCHIVES OF
BIOLOGY AND TECHNOLOGY
A N I N T E R N A T I O N A L J O U R N A L
Investigation about the Efficiency of the Bioaugmentation
Technique when Applied to Diesel Oil Contaminated Soils
Adriano Pinto Mariano
1,2*, Dejanira de Franceschi de Angelis
2, Maria Paula Santos
Pirôllo
2, Jonas Contiero
2and Daniel Marcos Bonotto
11Instituto de Geociências e Ciências Exatas; Universidade Estadual Paulista; Rio Claro - SP - Brasil.
2Departamento de Bioquímica e Microbiologia; Instituto de Biociências; Universidade Estadual Paulista; Av. 24-A,
1515; C.P.: 199; 13506-900; Rio Claro - SP - Brasil
ABSTRACT
This work investigated the efficiency of the bioaugmentation technique when applied to diesel oil contaminated soils collected at three service stations. Batch biodegradation experiments were carried out in Bartha biometer flasks
(250 mL) used to measure the microbial CO2 production. Biodegradation efficiency was also measured by
quantifying the concentration of hydrocarbons. In addition to the biodegradation experiments, the capability of the studied cultures and the native microorganisms to biodegrade the diesel oil purchased from a local service station, was verified using a technique based on the redox indicator 2,6 - dichlorophenol indophenol (DCPIP). Results obtained with this test showed that the inocula used in the biodegradation experiments were able to degrade the diesel oil and the tests carried out with the native microorganisms indicated that these soils had a microbiota adapted to degrade the hydrocarbons. In general, no gain was obtained with the addition of microorganisms or
even negative effects were observed in the biodegradation experiments.
Keywords: bioremediation, bioaugmentation, soil, diesel oil, service station
*Author for correspondence: [email protected]
INTRODUCTION
Diesel oil leakages from the underground storage tanks, distribution facilities and various industrial operations represent an important source of soil and aquifer contamination. Diesel is a complex mixture of normal, branched and cyclic alkanes, and aromatic compounds obtained from the middle-distillate fraction during petroleum separation (Gallego et al., 2001).
Among several clean-up techniques available to remove the petroleum hydrocarbons from the soil and groundwater, bioremediation processes are gaining ground due to their simplicity, higher
efficiency and cost-effectiveness when compared to other technologies (Alexander, 1999). These processes rely on the natural ability of microorganisms to carry out the mineralization of organic chemicals, leading ultimately to the formation of CO2, H2O and biomass.
The effectiveness of bioremediation is often a function of the microbial population and how it can be enriched and maintained in an environment. According to several authors (Kataoka, 2001; Mulligan et al., 2001; Bento et al., 2003; Rahman et al., 2003), the inoculation of bacteria with hydrocarbon biodegradation capabilities may shorten the time of the treatment. However, there are studies showing that the injection of microorganisms is often an inefficient approach to enhance the treatment of soils contaminated with hydrocarbons (APS, 1989 and 1990; Alexander, 1999; Trindade et al. 2002; Pala et al., 2002). Thus, the purpose of the present study was to investigate, in laboratory scale experiments, the efficiency of the bioaugmentation technique when applied to soils contaminated with diesel oil, testing different bacterial cultures and a commercial inoculum.
MATERIALS AND METHODS
Sampling and soil characteristics
Soil samples were collected at three service stations. At the service stations ASP and SB, diesel oil spills occurred from underground storage tanks approximately ten years ago, thus samples were contaminated with diesel oil. At these places, samples were collected from the capillary fringe (depth: ASP - 1.60 m; SB - 2.60 m). At the third service station (RC), the sample was collected at 0.50 m during the replacement of underground pipes. This sample showed low level of contamination of unknown fuel, possibly due to leaks in the pipes and ground infiltrations. Until performing the biodegradation experiments, samples were stored at 5oC. Table 1 summarizes
some physicochemical characteristics of these soil samples. The total petroleum hydrocarbons concentrations (TPH) are expressed in Tables 4 to 7.
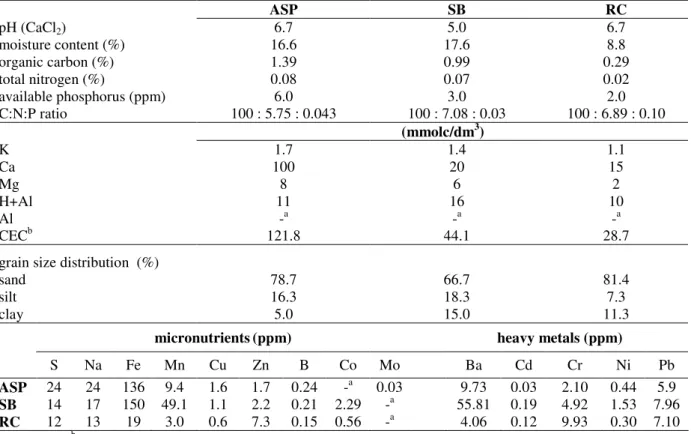
Table 1 - Soil samples characteristics
ASP SB RC
pH (CaCl2) 6.7 5.0 6.7
moisture content (%) 16.6 17.6 8.8
organic carbon (%) 1.39 0.99 0.29
total nitrogen (%) 0.08 0.07 0.02
available phosphorus (ppm) 6.0 3.0 2.0
C:N:P ratio 100 : 5.75 : 0.043 100 : 7.08 : 0.03 100 : 6.89 : 0.10 (mmolc/dm3)
K 1.7 1.4 1.1
Ca 100 20 15
Mg 8 6 2
H+Al 11 16 10
Al -a -a -a
CECb 121.8 44.1 28.7
grain size distribution (%)
sand 78.7 66.7 81.4
silt 16.3 18.3 7.3
clay 5.0 15.0 11.3
micronutrients(ppm) heavy metals (ppm)
S Na Fe Mn Cu Zn B Co Mo Ba Cd Cr Ni Pb
ASP 24 24 136 9.4 1.6 1.7 0.24 -a 0.03 9.73 0.03 2.10 0.44 5.9 SB 14 17 150 49.1 1.1 2.2 0.21 2.29 -a 55.81 0.19 4.92 1.53 7.96 RC 12 13 19 3.0 0.6 7.3 0.15 0.56 -a 4.06 0.12 9.93 0.30 7.10
a not detected; bcation exchange capacity.
Concentrations of heavy metals were not above the most restricted levels established by Cetesb (São Paulo Environmental Agency – Brazil) and by the Dutch list (Cetesb, 2005). .
The physicochemical analyses were performed by
the laboratory “Instituto Campineiro de Análise de Solo e Adubo (ICASA)”, according to the methodology proposed by Embrapa (1997), except
the following parameters: total nitrogen
Agrotécnico Piracicaba”, according to Embrapa (1997)); grain size distribution (ABNT, 1984) and the moisture content (obtained by the oven drying method).
Determination of the total petroleum hydrocarbons (TPH) content was carried out by the “Analytical Technology” laboratory by gas chromatography with the flame ionization detector (FID) according to the US Environmental Protection Agency (USEPA) methodology SW-846/8015.
Respirometric biodegradation experiments
In order to verify the influence of the bioaugmentation technique in the biodegradation of diesel oil, batch biodegradation experiments were carried out in Bartha biometer flasks (250
mL) used to measure the microbial CO2
production (Bartha and Pramer, 1965; Régis and Bidoia, 2005; Inazaki et al., 2005). Mineralization studies involving the measurements of total CO2
production can provide excellent information on the biodegradability potential of hydrocarbons (Balba et al., 1998).
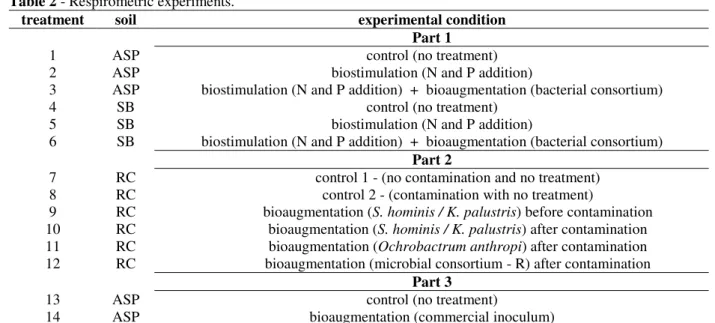
The experiments were divided into three parts. The first aimed to evaluate the influence of the bioaugmentation together with the biostimulation (addition of nutrients) technique, in the biodegradation efficiency of ASP and SB soils. These experimental conditions are presented in Table 2.
Soil samples were separately homogenized by a thorough mixing and divided into three aliquots, in which the amendment solution of each treatment was added. The nitrogen and phosphorus correction was performed, respectively, using (NH4)2SO4 and KH2PO4 solutions to obtain a
nutrient ratio (C:N:P) of 100:15:1 (Mariano et al., 2007). The bacterial consortium (Staphylococcus hominis and Kocuria palustris) was added at a concentration of 106 Colony Forming Units (CFU)
per gram of dry soil. Considering the addition of amendments, the water content of the soil changed to 21.1% (ASP) and 20.2% (SB). At treatments 1 and 4 (controls), the water content was corrected in relation to the other treatments by adding distilled water.
In the second part of the biodegradation experiments (Table 2), a diesel oil contamination of the RC soil was simulated. Thus, diesel oil purchased from the local service station was added to the soil. Regarding the bioaugmentation with the bacterial consortium S. hominis / K. palustris, two conditions were simulated: a) addition of
microorganisms before contamination; b) addition of microorganisms after contamination. The idea of the former strategy was to evaluate how efficient the bioaugmentation would be if it was employed as a way to “prepare” the soil to a possible future spill.
The addition of the inoculum to treatment 9 was done 71 days previously to contamination. Using the same inoculum prepared for the first biodegradation experiment, at a concentration of 104 CFU / gram of dry soil. Then the inoculated soil (600 g) was kept in a becker covered by a black plastic to maintain the soil in dark conditions. After this period, the diesel oil contamination was simulated by adding 6 g diesel / kg soil to treatments 8 to 12.
In treatments 10 to 12, the concentrations of inocula were 106, 109 and 108 CFU / g of dry soil,
respectively. Considering the addition of the inoculum, the water content of the soil changed to 9.3% (treatment 9) and 28.8% (treatments 10 to 12). At treatments 7 and 8 (controls), the water content was corrected in relation to treatment 10 by adding distilled water.
The third part of the biodegradation experiments (Table 2) aimed to verify the efficiency of a commercial inoculum, a microorganism mix, called Efficient Microorganisms (EM), which was applied in the ASP soil. EM was initially diluted in water (1:10) then applied at a concentration of 0.034 mL / g of soil, which corresponded to 107
CFU / g of dry soil. Considering the addition of the inoculum, the water content of the soil changed to 19.0%. At treatment 13 (control), the water content was corrected in relation to treatment 14 by adding distilled water.
For all experimental parts, the biometer flasks were prepared in triplicates (3 x 50 g of soil) and incubated at 27oC in the dark for 57 (part 1), 92
(part 2) and 47 (part 3) days. Produced CO2 was
Table 2 - Respirometric experiments.
treatment soil experimental condition Part 1
1 ASP control (no treatment)
2 ASP biostimulation (N and P addition)
3 ASP biostimulation (N and P addition) + bioaugmentation (bacterial consortium)
4 SB control (no treatment)
5 SB biostimulation (N and P addition)
6 SB biostimulation (N and P addition) + bioaugmentation (bacterial consortium) Part 2
7 RC control 1 - (no contamination and no treatment)
8 RC control 2 - (contamination with no treatment)
9 RC bioaugmentation (S. hominis /K. palustris) before contamination
10 RC bioaugmentation (S. hominis /K. palustris) after contamination
11 RC bioaugmentation (Ochrobactrum anthropi) after contamination
12 RC bioaugmentation (microbial consortium - R) after contamination Part 3
13 ASP control (no treatment)
14 ASP bioaugmentation (commercial inoculum)
Biodegradation efficiency calculation
The carbon dioxide analyses were used to estimate the total amount of hydrocarbons mineralized during the biodegradation experiments. Assuming that 50% of the biodegraded carbon is converted to CO2 and the other 50% is added to the soil as
humus and biomass (Cetesb, 1990), the amount of biodegraded carbon can be expressed as:
Total biodegraded carbon (µmol) = 2 x CO2 produced
(µmol) (1)
In the case of the RC soil (treatments 7 to 12), it is necessary to subtract the CO2 produced by the
control without contamination (treatment 7):
Total biodegraded carbon (µ mol) = 2 x (CO2 produced
(µmol) - CO2 produced in the control (µ mol))
(2)
The biodegradation efficiency (BE) to all experiments is:
BE% = (Total biodegraded carbon (µmol) / initial soil organic carbon content (µmol) ).100 (3)
Hydrocarbons removal efficiency was also measured by gas chromatography.
Diesel oil biodegradability test
Before carrying out the biodegradation
experiments, the capability of the studied cultures and the native microorganisms to biodegrade diesel oil purchased from a local service station,
was verified using a technique based on the redox indicator 2,6 - dichlorophenol indophenol (DCPIP) (Hanson et al., 1993).
The inocula S. hominis/K. palustris, O. anthropi and consortium – R (125 µL, O.D = 0.55 at µ = 610 nm (Shimadzu UV-1601PC)), were separately added to test tubes (duplicates) that contained 7.5 mL sterile Bushnell-Hass (BH) medium (Difco, 1984) and 50 µL of diesel oil. The concentration of DCPIP was 27 µg/mL. The inoculum EM (200 µL, concentration equal to 109 CFU/mL) and the
inocula prepared from the native microorganisms of soils ASP, SB and RC (1.0 mL, concentration not determined) were added to 125 mL Erlenmeyer flasks (duplicates) that contained sterile 50 mL BH medium and 1% (v/v) of diesel oil. The concentration of DCPIP was 20 mg/mL. Test tubes and Erlenmeyer flasks were kept under agitation (240 rpm) at 27±2 oC.
The principle of this test is that during the microbial oxidation of hydrocarbons, electrons are transferred to electron acceptors such as O2,
Microorganisms
The cultures of Staphylococcus hominis and Kocuria palustris were isolated from the diesel oil contaminated soil of the service station ASP and identified by rDNA 16S sequence (performed by CPQBA/UNICAMP) (Mariano et al., 2007). In treatments 3, 6 and 9, inoculum was prepared as follow: bacteria were grown separately on liquid PCA medium (10 mL), and incubated at 35oC for 48 h. Cells were harvested by centrifugation (8,000 rpm for 10 min) and the supernatant was discharged. The resulting cell pellet was resuspended in 5.5 mL sterile saline solution (0.85%) and centrifuged as above. The cell pellets were grouped and the final cell suspension was prepared with the addition of 5.5 mL saline solution.
In treatments 10 to 12, inocula were prepared using bacterial cells transferred from storage culture tubes and streaked onto the surface of Petri dishes containing nutrient agar (Merck, Germany) with an incubation time of 24 h at 35oC. Then cells
were harvested using sterile water and adjusted to an O.D. of 1.2 at 610 nm (SHIMADZU UV-1601PC). The bacterial strain Ochrobactrum anthropi was previously isolated and identified by Kataoka (2001) from a landfarming at the Brazilian oil refinery Replan (Petrobras S/A). From the wastewater of the same refinery, the microbial consortium – R was obtained.
The commercial inoculum EM is a mix of microorganisms and has been demonstrated efficient as a biological fertilizer and as a biological amendment to wastewater pond treatments. Although EM has been applied successfully in the biological wastewater treatments, it has never been tested as an agent to enhance the bioremediation of hydrocarbon
contaminated sites, thus originally EM has not been provided for this proposal.
In the biodegradability tests, the native microbial inocula were prepared by adding 1 g of respective soils to 50 mL of BH medium in Erlenmeyer flasks (250 mL) that were kept under agitation (240 rpm) at 27±2 oC for 3 days. After this period, the culture media were streaked onto the surface of Petri dishes containing nutrient agar (Merck, Germany) and incubated at 35oC for 24 h. Finally,
cells were harvested using sterile water, and the concentrations of the inocula were not adjusted.
Counts of bacteria
Total heterotrophic bacteria were numbered by using pour plate technique on plate count agar (Acumedia, USA). Plate count of the soil bacterial population was performed as follows: samples of 1 g of soil were added to 9 mL of 0.85% sterile saline solution in tubes and agitated mechanically for 2 minutes. After appropriate serial dilutions, 1 mL of the suspension was spread over the surface of duplicate Petri dishes and incubated at 35oC for
48 h. The total heterotrophic bacteria count was carried out at the beginning and at the end of the respirometric experiments.
RESULTS AND DISCUSSION
Diesel oil biodegradability test
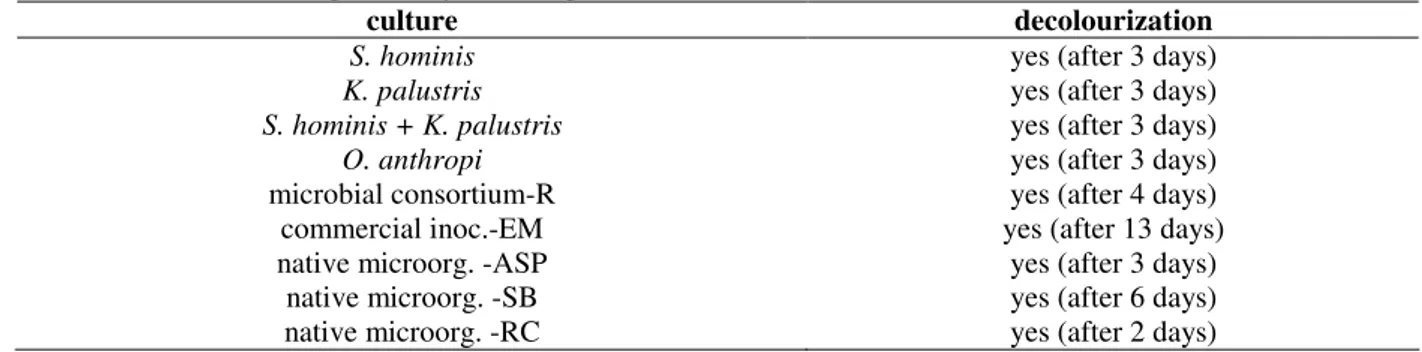
The results obtained with the biodegradability test using the redox indicator DCPIP (Table 3) showed that the inocula used in the respirometric biodegradation experiments were able to degrade diesel oil. Moreover, the tests carried out with the native microorganisms indicated that these soils had a microbiota adapted to degrade hydrocarbons.
Table 3 - Diesel oil biodegradability test using DCPIP.
culture decolourization
S. hominis yes (after 3 days)
K. palustris yes (after 3 days)
S. hominis + K. palustris yes (after 3 days)
O. anthropi yes (after 3 days)
microbial consortium-R yes (after 4 days)
commercial inoc.-EM yes (after 13 days)
native microorg. -ASP yes (after 3 days)
native microorg. -SB yes (after 6 days)
native microorg. -RC yes (after 2 days)
Respirometric biodegradation experiments
The CO2 production in treatments 1, 2 and 3 (ASP
soil) and its cumulative values are shown in Figures 1 and 2, respectively. There was no lag period in any treatment, probably due to a previous adaptation of the microorganisms (inoculum consisted of indigenous microorganisms) to the pollutants and favorable experimental conditions.
Initially, CO2 production in treatments 2 and 3
(Fig. 1) was superior to 1. However, approximately after the 15th day, these curves
showed a tendency to reach values of the control (treatment 1), presumably due to an exhaustion of the readily degradable hydrocarbons and nutrient consumption (Table 8).
Biodegradation experiments - Part 1 - ASP
0 50 100 150 200 250
0 10 20 30 40 50 60
time (d)
C
O
2
p
ro
d
u
c
ti
o
n
(µ
m
o
l.
d
-1) 1 2 3
Figure 1 - CO2 production during incubation (ASP – part 1).
Biodegradation experiments - Part 1 - ASP
0 1000 2000 3000 4000 5000 6000 7000 8000
0 10 20 30 40 50 60
time (d)
c
u
m
u
la
tiv
e
C
O
2
p
ro
d
u
c
tio
n
(
µ
m
o
l)
1 2 3
Figure 2 - Cumulative total amounts of CO2produced by treatments(ASP – part 1) during
incubation. Each error bar represents 1 SD of three replicate.
The production of CO2 in the experiment with SB
soil (treatments 4 to 6), represented in Figures 3 and 4, demonstrated that there was no lag phase either, regardless the non-indigenous inoculum. The addition of nutrients in SB soil had a less pronounced positive effect. It is reasonable to suppose that other aspects were limiting the biodegradation efficiency. According to Bosma et al. (1997), the rate at which microbial cells can convert chemicals during bioremediation depends on two factors: the rate of uptake and metabolism (the intrinsic activity of the cell), and the rate of transfer to the cell (mass transfer), the so-called
bioavailability. The nutritional amendment is related to the first factor, but it may have no effect when mass transfer is the limiting factor.
Biodegradation experiments - Part 1 - SB
0 5 10 15 20 25 30 35 40 45 50
0 10 20 30 40 50 60
time (d)
C
O
2 p
ro
d
u
c
e
d
(
µ
m
o
l.d
-1)
4 5 6
Figure 3 - CO2 production during incubation (SB – part 1).
Biodegradation experiments - Part 1 - SB
0 500 1000 1500 2000 2500
0 10 20 30 40 50 60
time (d)
c
u
m
u
la
tiv
e
C
O
2 p
ro
d
u
c
ti
o
n
(µ
m
o
l) 4 5 6
Figure 4 - Cumulative total amounts of CO2 produced by treatments (SB – part 1) during
incubation. Each error bar represents 1 SD of three replicates.
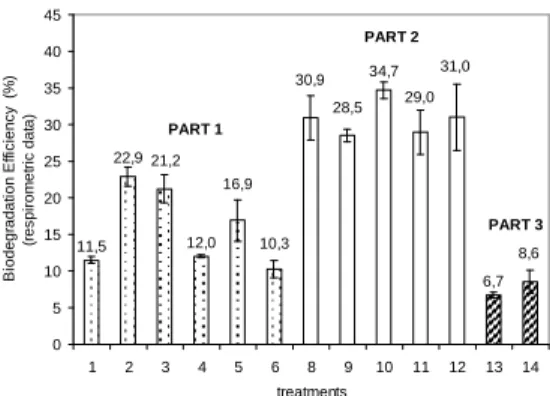
Based on the CO2 production, the biodegradation
efficiency (BE) was calculated using Equation 3 (Fig. 5). This efficiency is related to the extent of mineralized hydrocarbons and excludes the portion of transformed diesel oil.
For both the soils, the addition of nutrients had a statistically significant positive effect in the biodegradation efficiency (ANOVA analysis, 95% confidence level). Biostimulation with the addition of fertilizers (N and P) has been reported as an
important factor to enhance the soil
bioremediation (Gallego et al., 2001; Cardona and Iturbe, 2003; Mariano et al., 2007). However, when considering the main focus of this study, i. e. the enhancement of bioremediation by inoculum injection, it had no effect in ASP soil, and in SB soil, the negative influence of the inoculum reduced the effect of the nutrient injection and this treatment obtained a biodegradation efficiency
PART 1 11,5 12,0 6,7 22,9 31,0 29,0 34,7 28,5 30,9 10,3 16,9 21,2 8,6 0 5 10 15 20 25 30 35 40 45
1 2 3 4 5 6 8 9 10 11 12 13 14
treatments B io d e g ra d a ti o n E ff ic ie n c y (% ) (r e s p ir o m e tr ic d a ta ) PART 2 PART 3
Figure 5 - Biodegradation efficiency obtained through the respirometric data. Each error bar represents 1 SD of three replicate.
Figure 12 represents the plate count of the total soil bacterial population performed before and after the experiments. In ASP soil, the treatments with addition of nutrients (2 and 3) had a final bacterial population greater than control and the inoculum showed to be inefficient in treatment 3, whose final value was equal to treatment 2, regardless of the higher initial population. In SB soil, the final value of treatment 5 was higher than treatment 4, confirming the positive effect of the nutrients that provided a significant growth in
relation to the initial time. This behavior was not observed in treatment 6 possibly due to a
competition caused by the exogenous
microorganisms.
Chromatographic analyses of ASP and SB samples (Table 4) revealed that at these sites, the diesel oil was already weathered, i. e. the fuel had their characteristics altered by physical-chemical and biological mechanisms due to the large period of exposure of these compounds to the environmental conditions (Mariano et al., 2008b).
Table 4 - Concentration of hydrocarbons at ASP and SB soils soil total
n-alkanes pristine phytane TRH UCM TPH (mg.kg-1)
ASP <DL 266 162 2844 19763 22607
SB 81.8 65.0 43.8 941 6256 7198
DL (detection limit) = 0.4 mg.kg-1; TRH - Total Resolvable Hydrocarbons; UCM - Unresolved Complex Mixture; TPH - Total
Petroleum Hydrocarbons.
Diesel oil contains 2000 to 4000 hydrocarbons, a complex mixture of normal, branched and cyclic alkanes, and aromatic compounds (Gallego et al., 2001), which cannot be totally separated by gas chromatography. In fact, only n-alkanes and a few branched hydrocarbons can be identified as separated compounds. Chromatographic profiles of commercial diesel, as used in treatments 8 to 12 (Fig. 9), generally present a satisfactory resolution for all n-alkanes and some other isoprenoid
alkanes, such as pristine
(2,6,10,14-tetramethylpentadecane) and phytane (2,6,10,14- tetramethylhexadecane). Nevertheless, the major fraction of the diesel oil is not characterized because the majority of the components could not be resolved and they appear in the chromatograms
as a “hump”, called as the “unresolved complex mixture (UCM)”, which presumably included the branched and cyclic alkanes and polar transformation products (Marchal et al., 2003; Bregnard et al., 1996). The resolved hydrocarbons are called “total resolvable hydrocarbons (TRH)” and the “total petroleum hydrocarbons (TPH)” are the sum of TRH and UCM. The TRH are non-degraded hydrocarbons, and they appear as peaks in the chromatogram.
microorganisms have degraded the hydrocarbons in the diesel oil (Balba et al., 1998). In the chromatograms, the UCM “hump” becomes larger and the TRH peaks decrease, due to the biodegradation.
The hydrocarbons content in ASP and SB soils has been mainly characterized as isoprenoid alkanes and UCM, which are more recalcitrant than n-alkanes (Gallego et al., 2001), characteristics of a weathered diesel oil.
The concentration of hydrocarbons determined at initial and final times to treatments 1 to 6 are shown in Table 5. Only the TRH fraction was
determined at the beginning and the concentrations of pristine and phytane were not determined for these treatments. The results are in agreement to respirometric data, i. e. greater efficiency removal of TRH and smaller final concentrations of the other fractions in the treatments with better biodegradation efficiencies. These results also indicated that the autochthonous microorganisms were adapted to the weathered diesel oil present in the ASP and SB soils and a misbalanced content of nutrients was limiting their action. Chromatograms of the final analyses can be seen in Figure 6.
Table 5 - Concentration of hydrocarbons at the beginning (1) and end (2) of the treatments 1 to 6. Values between parentheses indicate the removal efficiency (%)
treatments TRH total n-alkanes UCM TPH
1 2 2 2 2
mg.kg-1
1 4084 3620 (11) <DL1 20112 23732
2 4084 2650 (35) <DL1 15970 18620
3 4084 2988 (27) <DL1 17157 20145
4 877 565 (36) <DL2 3287 3851
5 877 383 (56) <DL2 2185 2568
6 877 752 (14) <DL2 4423 5175
DL (detection limit) = (1) 21 mg.kg-1; (2) 8 mg.kg-1. TRH - Total Resolvable Hydrocarbons; UCM - Unresolved Complex
Mixture; TPH - Total Petroleum Hydrocarbons.
Figure 6 - Chromatographic analysis (TPH) at final time in treatments with ASP (1 to 3) and SB (4 to 5) soils. Dilution factors: 50x (1; 2 and 3); 20x (4 and 6); 10x (5). C20-d42 and C24-d50: recovery-species.
The CO2 production of treatments 7 to 12 (second
part of the biodegradation experiments – RC soil) and their cumulative values are shown, respectively, in Figures 7 and 8.
There was no lag period in the experiment, probably due to a previous adaptation of the microorganisms to hydrocarbons, since the RC soil already showed a low level of contamination
(1)
(2)
(3)
(4)
(5)
before the contamination with diesel oil (Table 6). After approximately the 20th day, the CO
2
production, in all the treatments where diesel oil was added, began to decrease, which could represent a shortage of labile carbon sources as
n-alkanes, presumably initially consumed. In the
treatments with inoculum addition, the
biodegradation efficiency (Fig. 5) was not affected (ANOVA analysis, 95% confidence level) in comparison to the control (treatment 8).
Biodegradation experiments - Part 2 - RC
0 10 20 30 40 50 60 70 80 90 100
0 10 20 30 40 50 60 70 80 90
time (d)
C
O
2
p
ro
d
u
c
ti
o
n
(
µ
m
o
l.
d
-1)
7 8 9
10 11 12
Figure 7 - CO2 production during incubation (RC – part 2).
Biodegradation experiments - Part 2 - RC
0 1000 2000 3000 4000 5000 6000
0 10 20 30 40 50 60 70 80 90
time (d)
c
u
m
u
la
ti
v
e
C
O
2 p
ro
d
u
c
ti
o
n
(µ
m
o
l) 7 8 9
10 11 12
Figure 8 - Cumulative total amounts of CO2 produced by treatments (RC – part 2) during
incubation. Each error bar represents 1 SD of three replicate.
Table 6 - Concentration of hydrocarbons at the beginning (1) and the end (2) of the treatments with RC soil. Values between parentheses indicate the removal efficiency (%).
treatment total
n-alkanes pristine phytane TRH UCM TPH
1 2 1 2 1 2 1 2 1 2 1 2
(mg.kg-1)
7 -a - - - - - 104 - - - - -
8 499 38 (92.0) 44 25 (43.2) 24 15 (39.1) 1232 341 4199 2717 (35.3) 5431 3058 (43.7) 9 499 90 (81.9) 44 22 (50.1) 24 13 (45.8) 1232 339 4199 2564 (38.9) 5431 2903 (46.5) 10 499 86 (82.7) 44 15 (66.4) 24 9 (64.3) 1232 262 4199 1984 (52.8) 5431 2246 (58.6) 11 499 186 (62.8) 44 21 (52.9) 24 11 (52.5) 1232 463 4199 2292 (45.4) 5431 2755 (49.3) 12 499 194 (61.1) 44 21 (50.8) 24 12 (45.4) 1232 503 4199 2449 (41.7) 5431 2952 (45.6)
anot analyzed. TRH - Total Resolvable Hydrocarbons; UCM - Unresolved Complex Mixture; TPH - Total Petroleum
The biodegradation efficiency in terms of TPH removal (Table 6) showed similar behavior to respirometric data. The efficiencies in the latter were approximately 30% for all the treatments (8 to 12). Following this tendency of no difference between the treatments, the TPH removal was about 50% for all the treatments, although in treatment 10, the removal was slightly higher (58.6%).
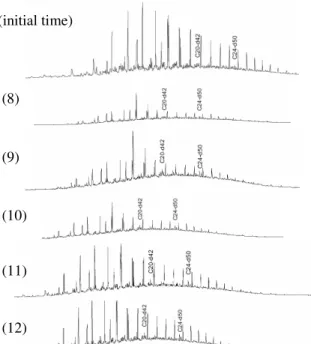
Comparing the chromatograms of the initial time to those of the final time (Fig. 9), the decrease of the TRH peaks was very clear. Table 6 shows that the diesel oil compounds were degraded following the order of their expected decreasing
susceptibility (Gallego et al., 2001): n-alkanes, isoprenoid alkanes (pristine and phytane) and UCM. In treatments 9 to 12 (especially in treatment 10), where inocula were added, the removal of the most recalcitrant compounds was higher compared to treatment 8, while the removal of the n-alkanes had an inverse behavior. This information obtained from the chromatographic analyses showed that, regardless of the treatments similar respirometric values, the injection of microorganisms from polluted environments increased the biodegradation of recalcitrant compounds. Similar results were obtained by Marchal et al. (2003).
Figure 9 - Chromatographic analysis (TPH) at initial and final time in treatmentswith RC soil (8 to 11). Dilution factors: 20x (initial and 8); 10x (9 to 12). C20-d42 and C24-d50: recovery-species.
Similar values of initial bacterial populations in treatments 7 and 9 (Fig. 12) indicated that the
microorganisms added previously to the
contamination (treatment 9) did not increase the microbial population probably due to a shortage of additional carbon source. This observation and the fact that there was no increase in the biodegradation efficiency, suggest that this
strategy has even better chances to fail in real situations, where during a possible long period between the injection of the microorganisms and a spill, microorganisms would have to survive against the predators, compete for limiting
nutrients and maintain their degradative
capabilities. Moreover, as demonstrated in the previous item, the presence of hydrocarbonoclastic
(initial time)
(8)
(9)
(10)
(11)
microorganisms in soils is ubiquitous, even in not polluted soils (Venkateswaran and Harayama, 1995; Ron and Rosenberg, 2002 apud Lee et al., 2006).
In treatments 11 to 12, where the inocula were more concentrated, the soil population initially increased to values ranging from 108 to 109 CFU / g of dry soil. However, as the other treatments, including treatment 7 (control, without addition of diesel oil), the microbial populations were about 107 at final time. This similarity showed (as also observed by Hickman and Novak, 1989) that generally total microbial biomass can be a poor indicator for determining the biodegradation potential, mainly because the active biomass can differ in the species composition and in metabolic regimes.
Table 8 shows the values of pH and nitrogen and phosphorus consumption at the end of the experiments. The values of pH were stable at neutral values in all the treatments (7 to 12), which was a favorable condition for biodegradation. In relation to the nutrients, there was no consumption of N or P, which suggested that the majority of the chemical forms of these compounds were not available to the microorganisms. Probably,
balanced addition of easy assimilated forms, as those employed in the first biodegradation experiment ((NH4)2SO4 and KH2PO4), would
increase the biodegradation efficiency.
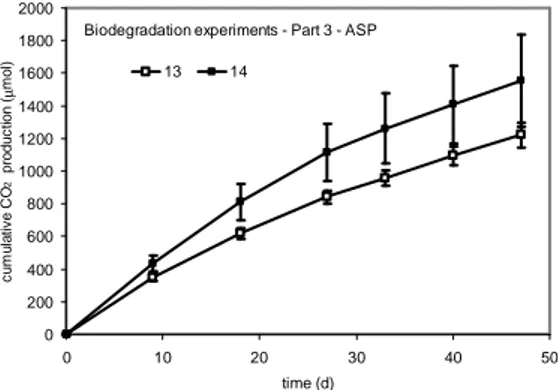
The CO2 production in treatments 13 and 14 (third
part of the biodegradation experiments - ASP soil) and their cumulative values are shown in Figures 10 and 11, respectively. There was no lag period in the experiment.
After approximately the 10th day, the CO 2
production began to decrease in both the treatments, which may represent a shortage of more labile (n-alkanes) or available carbon sources.
Statistical analyses (ANOVA analysis, 95%
confidence level) of the biodegradation
efficiencies (Figure 5) showed that the addition of the commercial inoculum EM had no influence in comparison to the control (treatment 13). This behavior was also observed in the concentration of hydrocarbons (Table 7), whose chromatograms are presented in Figure 13. The inefficiency of inoculum EM could be related to its incapacity to survive in the ASP soil as indicated by the lower final value of the total soil bacterial population in relation to the control (treatment 13) (Figure 12).
Biodegradation experiments - Part 3 - ASP
0 10 20 30 40 50 60
0 10 20 30 40 50
time (d)
C
O
2 p
ro
d
u
c
e
d
(
µ
m
o
l.d
-1)
13 14
Figure 10 - CO2 production during incubation (ASP – part 3).
Biodegradation experiments - Part 3 - ASP
0 200 400 600 800 1000 1200 1400 1600 1800 2000
0 10 20 30 40 50
time (d)
c
u
m
u
la
ti
v
e
C
O
2
p
ro
d
u
c
ti
o
n
(µ
m
o
l) 13 14
Figure 11 - Total cumulative amounts of CO2 produced by the experiment (ASP – part 3) during
5,0 6,0 7,0 8,0 9,0 10,0 1
2 3 4 5 6 7 8 9 10 11 12 13 14
tr
e
a
tm
e
n
ts
log (CFU / g of dry soil)
initial time final time
Figure 12 - Total heterotrophic bacteria counts at initial and final times of the respirometric experiments.
Table 7 - Concentration of hydrocarbons at the beginning (1) and the end (2) of the experiment with ASP soil (Part 3). Values between parentheses indicate the removal efficiency (%)
treatment total
n-alkanes pristine phytane TRH UCM TPH
1 2 1 2 1 2 1 2 1 2 1 2
(mg.kg-1)
13 <DL 4.1 <DL 2.4 <DL 1.3 62 35 (43.5) 722 228 (68.4) 784 263 (66.4) 14 <DL 3.5 <DL 1.9 <DL 1.1 62 38 (38.7) 722 260 (64.0) 784 297 (62.1)
DL (detection limit) = 4.0 mg.kg-1. TRH - Total Resolvable Hydrocarbons; UCM - Unresolved Complex Mixture; TPH - Total
Petroleum Hydrocarbons.
Figure 13 - Chromatographic analysis (TPH) at initial and final times in treatmentswith ASP soil (13 and 14). Dilution factors: 10x (initial); 1x (13 and 14). C20-d42 and C24-d50: recovery-species.
(13) (14)
Table 8 - Values of pH, nitrogen and phosphorus at the experiments
pH1 N P
treatment
initial final initial final initial final (mg.kg-1)
1 6.7 7.5 800 210 6 6
2 6.7 6.5 2090 1050 139 66
3 6.7 7.1 2090 1050 139 56
4 5.0 4.9 700 350 3 2
5 5.0 5.0 1480 1260 99 55
6 5.0 5.0 1480 1260 99 48
7 7.4 7.1 210 210 2 2
8 7.1 7.3 210 210 2 2
9 7.2 7.2 210 210 2 2
10 7.3 7.3 210 210 2 2
11 7.1 7.3 210 210 2 2
12 7.1 7.4 210 210 2 2
13 4.6 4.5 350 350 -2 -
14 4.6 4.5 350 350 - -
1CaCl
2; 2 not analyzed.
CONCLUSIONS
Although the bioaugmentation was carried out with microorganisms able to degrade diesel oil, in general, no gain was obtained with this bioremediation technique when treating the contaminated soils with diesel oil. A reasonable explanation for this inefficiency could be that, when added into soils, microorganisms were subjected to ecological principles of competition and predation, which would decrease significantly their chances of survival in the natural environments. Moreover, the soils collected from the three service stations presented a native microbiota already adapted to degrade the hydrocarbons, which suggested that the use of the bioaugmentation, in order to accelerate the bioremediation process, would achieve better results in cases of more recalcitrant chemicals or when the local microbial population was insufficient or inadequate. In any case, the development of techniques to assure the survival of the microorganisms in the natural environment would be essential.
ACKNOWLEDGMENTS
The authors acknowledge the Agência Nacional do Petróleo, Gás Natural e Biocombustíveis (ANP) (PRH-05); the service stations owners and Petrobras S/A.
RESUMO
Este trabalho investigou a eficiência da técnica do bioaumento quando aplicada a solos contaminados com óleo diesel coletados em três postos de combustíveis. Experimentos de biodegradação foram realizados em frascos de Bartha (250 mL), usados para medir a produção microbiana de CO2.
A eficiência de biodegradação também foi
quantificada pela concentração de
hidrocarbonetos. Conjuntamente aos experimentos de biodegradação, a capacidade das culturas estudadas e dos microrganismos nativos em biodegradar óleo diesel comprado de um posto de combustíveis local, foi verificada utilizando-se a técnica baseada no indicador redox 2,6 – diclorofenol indofenol (DCPIP). Resultados obtidos com esse teste mostraram que os inóculos empregados nos experimentos de biodegradação foram capazes de biodegradar óleo diesel e os testes com os microrganismos nativos indicaram que estes solos previamente apresentavam uma
microbiota adaptada para degradar
REFERENCES
ABNT - Associação Brasileira de Normas Técnicas (1984), NBR 7181: Solo - Análise Granulométrica. Rio de Janeiro, 13p.
Alexander, M. (1999), Biodegradation and
Bioremediation, 2nd ed. (Academic Press, London).
APS – Applied Biotreatment Association (1989), Case
history compendium. (Washington, DC).
APS – Applied Biotreatment Association (1990), The role of biotreatment of oil spills. (Washington, DC).
Bartha, R. and Pramer, D. (1965), Features of a flask and method for measuring the persistence and biological effects of pesticides in soil. Soil Sci., 100, 68-70.
Balba, M. T., Al-Awadhi, N. and Al-Daher, R. (1998), Bioremediation of oil-contaminated soil: microbiological methods for feasibility assessment and field evaluation. Journal of Microbiological Methods, 32, 155-164.
Bento, F. M., Camargo, F. A. O. and Okeke, B. (2003), Bioremediation of soil contaminated by diesel oil.
Braz. J. Microb., 34, 65-68.
Bosma, T. N. P., Middeldorp, P. J. M., Shraa, G. and Zehnder, A. J. B. (1997), Mass transfer limitation of biotransformation: quantifying bioavailability.
Environ. Sci. Technol., 31, 248-252.
Bregnard, T. P. A., Höhener, P., Häner, A. and Zeyer, J. (1996), Degradation of weathered diesel fuel by microorganisms from a contaminated aquifer in aerobic and anaerobic microcosms. Env. Tox. Chem.,
15(3), 299-307.
Cardona, S. and Iturbe, R. (2003), Biodegradación de diesel mexicano por un consorcio de bacterias de un suelo agrícola. DYNA, 138, 13-26.
Cetesb – Companhia de Tecnologia de Saneamento Ambiental. (1990), Norma Técnica L 6.350 - Solos - Determinação da Biodegradação de Resíduos – Método Respirométrico de Bartha. São Paulo. 9p. Cetesb – Companhia de Tecnologia de Saneamento
Ambiental (2005), Relatório de estabelecimento de Valores Orientadores para Solos e Águas Subterrâneas no Estado de São Paulo.
Cormack, W. P. M. and Fraile, E. R. (1997), Characterization of a hydrocarbon degrading psychrotrophic Antarctic bacterium. Antarctic Science, 9 (2), 150-155.
Difco (1984), Difco Manual, 10ed. (Detroit: Difco
Laboratories).
Embrapa – Empresa Brasileira de Pesquisa Agropecuária (1997), Manual de Métodos de Análises de Solos. Rio de Janeiro.
Gallego, J. L. R., Loredo, J., Llamas, J. F., Vázquez, F. and Sánchez, J. (2001), Bioremediation of diesel-contaminated soils: Evaluation of potential in situ techniques by study of bacterial degradation.
Biodegradation, 12, 325-335.
Hanson, K. G., Desai, J. D. and Desai, A. J. (1993), A rapid and simple screening technique for potential crude oil degrading microorganisms. Biotechnology Techniques, 7, 745-748.
Hickman, G. T. and Novak, J. T. (1989), Relationship between subsurface biodegradation rates and microbial density. Environ. Sci. Technol., 23, 525-532.
Inazaki, T. H., Pião, A. C. S. and Bidoia, E. D. (2004), Treatment of simulated wastewater containing n-phenyl-n-isopropyl-p-phenylenediamine using electrolysis system with Ti/TiRuO2 electrodes. Braz. Arch. Biol. Technol., 47(6), 983-994.
Kataoka, A. P. A. G. (2001), Biodegradação de resíduo oleoso de refinaria de petróleo por microrganismos isolados de “landfarming”. PhD Thesis, Bioscience Institute, Unesp-Rio Claro.
Lee, M., Kim, M. K., Singleton, I., Goodfellow, M. and Lee, S.-T. (2006), Enhanced biodegradation of diesel oil by a newly identified Rhodococcus baikonurensis
EN3 in the presence of mycolic acid. Journal of Applied Microbiology, 100, 325–333.
Löser, C., Seidel, H., Hoffmann, P. and Zehnsdorf, A. (1999), Bioavailability of hydrocarbons during microbial remediation of a sandy soil. Appl. Microbiol. Biotechnol., 51, 105-111.
Marchal, R., Penet, S., Solano-Serena, F. and Vandecasteele, J. P. (2003), Gasoline and diesel oil biodegradation. Oil and Gas Science Technology, 58 (4), 441-448.
Mariano, A. P., Kataoka, A. P. A. G., Angelis, D. F. and Bonotto, D. M. (2007), Laboratory study on the bioremediation of diesel oil contaminated soil from a petrol station. Brazilian Journal of Microbiology, 38 (2), 346-353.
Mariano, A. P., Bonotto, D. M., Angelis, D. F., Pirôllo, M. P. S. and Contiero, J. (2008a), Use of weathered diesel oil as a low-cost raw material for biosurfactant production. Brazilian Journal of Chemical Engineering, 25, 269-274.
Mariano, A. P., Bonotto, D. M., Angelis, D. F., Pirôllo, M. P. S. and Contiero, J. (2008b), Biodegradability of commercial and weathered diesel oils. Brazilian Journal of Microbiology, 39, 133-142.
Mulligan, C. N., Young, R. N. and Gibbs, B. F. (2001), Surfactant enhanced remediation of contaminated soil: a review. Eng. Geol., 60, 371-380.
Pala, D. M., Freire, D. D. C. and Sant´ana Jr, G. L. (2002), Bioremediation of clay soils impacted by petroleum. Engenharia Térmica,2, 29-32.
Pirôllo, M. P. S., Mariano, A. P., Lovaglio, R. B., Costa, S. G. V. A. O., Walter, V., Hausmann, R. and Contiero, J. (2008), Biosurfactant synthesis by
Pseudomonas aeruginosa LBI isolated from a
hydrocarbon-contaminated site. Journal of Applied Microbiology, 105 (5), 1484-1490.
Rahman, K. S. M., Rahman, T. J, Kourkoutas, Y., Petsas, I., Marchant, R. and Banat, I. M. (2003), Enhanced bioremediation of n-alkane in petroleum sludge using bacterial consortium amended with rhamnolipid and micronutrients. Bioresource Technol., 90, 159-168.
Régis, G. and Bidoia, E. D. (2005), Electrolytic treatment applied to the industrial effluent containing persistent wastes monitored by Bartha respirometric assays. Braz. Arch. Bio.Technol., 48 (2), 319-325.
Roy, S., Hens, D., Biswas, D. and Kumar, R. (2002), Survey of petroleum-degrading bacteria in coastal waters of Sunderban Biosphere Reserve. World
Journal of Microbiology and Biotechnology, 18,
575-581.
Trindade, P. V. O., Sobral, L. G., Rizzo, A. C. L., Leite, S. G. F. and Lemos, J. L. S. (2002), Evaluation of biostimulation and bioaugmentation techniques in the bioremediation process of petroleum hydrocarbons contaminated soil. Paper presented at the 9th
International Petroleum Environmental Conference, New Mexico, USA.
Venkateswaran, K. and Harayama, S. (1995), Sequential enrichment of microbial populations exhibiting enhanced biodegradation of crude oil.
Canadian Journal of Microbiology, 41, 767-775.