www.scielo.br/rbg
PHOSPHORITE PROSPECTION USING GROUND GAMMA SPECTROMETRY
IN NORTHEAST GOI ´AS STATE, BRAZIL
Chris Busnello Fianco
1, Roberta Mary Vidotti
2and Augusto C´esar Bittencourt Pires
3ABSTRACT.The Bambu´ı Group, where the study area is located, is a favorable environment for phosphate rock formation, and hence, is an area of economic interest. The use of gamma ray spectrometry aims at selecting targets for ore exploration, since apatite, a phosphate mineral, generally has a high content of uranium. To this end, approximately 10 linear kilometers (527 stations) of ground gamma ray spectrometry data were acquired, along five profiles, pre-selected based on geophysical data, as well as public domain geochemical and geological information. The analysis of uranium, thorium and potassium and their ratios indicates that the enrichment of U relative to K is well mapped by the eU/eTh and eU/K ratios, as it was confirmed in the field.
Keywords: ground gamma ray prospection, phosphorites targets, Bambu´ı Group, uranium.
RESUMO.O Grupo Bambu´ı, onde se encontra inserida a ´area de trabalho, possui um ambiente favor´avel `a formac¸˜ao de rochas fosf´aticas, apresentando-se assim como uma regi˜ao de interesse econˆomico. A utilizac¸˜ao do m´etodo gamaespectrom´etrico tem como finalidade a selec¸˜ao de alvos para prospecc¸˜ao do min´erio, uma vez que a apatita, mineral fosf´atico, geralmente apresenta um teor elevado de U. Para este fim foi realizada a aquisic¸˜ao de, aproximadamente, 10 km lineares, totalizando 527 estac¸˜oes de dados gamaespectrom´etricos terrestres ao longo de cinco perfis pr´e-selecionados com base em dados aerogeof´ısicos, informac¸˜oes geoqu´ımicas e de geologia de dom´ınio p´ublico. A an´alise dos dados dos radioelementos obtidos e de suas raz˜oes indica que o enriquecimento de U em relac¸˜ao ao K, ´e bem mapeado pelas raz˜oes eU/eTh e eU/K, o que foi confirmado em campo.
Palavras-chave: prospecc¸˜ao gamaespectrometria terrestre, alvos de fosforitos, Grupo Bambu´ı, urˆanio.
1Al. Praia de Tramanda´ı, 369 ap. 108, Stella Maris, 41600-480 Salvador, BA, Brazil. Phone: +55(71) 9327-5045 – E-mail: [email protected]
2Universidade de Bras´ılia, Instituto de Geociˆencias, Campus Universit´ario Darcy Ribeiro, Asa Norte, P.O. Box 04465, 70910-900 Bras´ılia, DF, Brazil. Phone: +55(61) 8132-7417 – E-mail: [email protected]
3Universidade de Bras´ılia, Instituto de Geociˆencias, Campus Universit´ario Darcy Ribeiro, Asa Norte, P.O. Box 04465, 70910-900 Bras´ılia, DF, Brazil. Phone: +55(61) 9982-6063 – E-mail: [email protected]
INTRODUCTION
The radioelements abundance varies in the Earth’s crust, but re-ported average values range from 2 to 3 ppm for uranium; 8 to 12 ppm for thorium; and, 2 to 2.5% for potassium, according to Dickson & Scott (1997), Minty (1997) and IEAE (2003).
Some studies show a direct correlation between the presence of phosphate and high gamma ray spectrometry values. Further studies conducted in phosphate added soils (Souza & Ferreira, 2005; Becegato & Ferreira, 2005; Nascimento et al., 2008) show that K, Th and U radioelements remain in the processed products, increasing the overall count compared to the native soil.
Studies in Syria (e.g. Ashfahani, 2002) also showed that gamma spectrometry is a great tool for phosphate prospection, since interpretation of radiometric surveys in boreholes demon-strates good correlation between eU and P2O5contents. The same
author also reported that radioactivity intensity in phosphorite layers ranged between 130 and 383 cps, with a mean of 270 cps and standard deviation of 57 cps.
In Al-Jalamid deposit, Saudi Arabia, Wynn (1996) established in boreholes the relationship between gamma rays counts and phosphate levels, providing a rapid, in-depth evaluation of phos-phate resources.
The study area, in northeastern Goi´as and southeastern To-cantins, is about 330 km from Bras´ılia. This N-S elongated area, of approximately 7,000 km2, comprises cities such as Campos
Belos, Monte Alegre de Goi´as, Nova Roma in Goi´as and Arraias in Tocantins.
The Bambu´ı Group sedimentation, in the Bras´ılia Belt, be-gan with diamictite during a glacial period. Ice melting allowed the installation of an epicontinental marine environment, and ini-tiated the deposition of pelitic-carbonate sediments that over-lap the S˜ao Francisco Craton. The environment created due to the deglaciation also established the necessary climatic condi-tions for the deposition of the phosphatic sediments in the region (Dardenne, 1978).
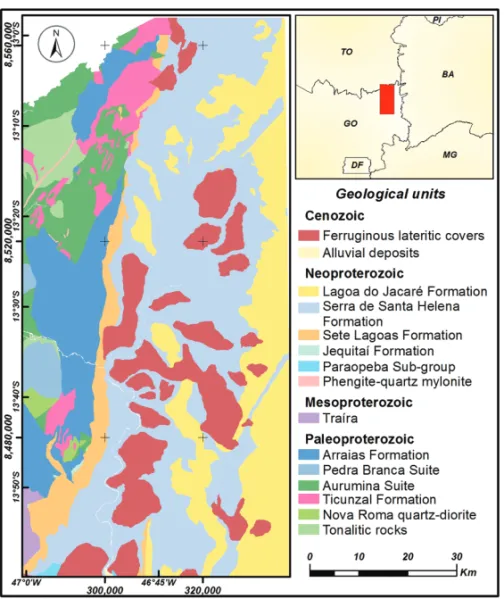
The geology used in this work (Fig. 1) is the compilation of the geological surveys of the Monte Alegre de Goi´as, Nova Roma and Cavalcante sheets, in 1:100,000 scale, held by the Geo-logy Program of Brazil (PGB) of the Geological Survey of Brazil (CPRM) in 2006 (Moreira et al., 2008). A striking feature that can be observed in the area is the differentiation of igneous rocks (basement) in the western portion, and sedimentary rocks in the eastern portion of the area.
The study area can be walked without difficulty due to sparse vegetation. The semiarid climate is responsible for the existence of a mantle of alteration rather thin and discontinuous, which
favors the occurrence of rocky outcrops. Ferreira et al. (1992) reported that limestone rocks generally have low levels of radioac-tive elements. This would allow a contrast of mineralized rocks in the region, since apatite usually has a high eU and eTh content relative to the host rocks (limestone).
Ground geophysics data acquisition was performed between March 4 and 21, 2010; using gamma spectroscopy to measure mean levels of K, eTh, eU and total count.
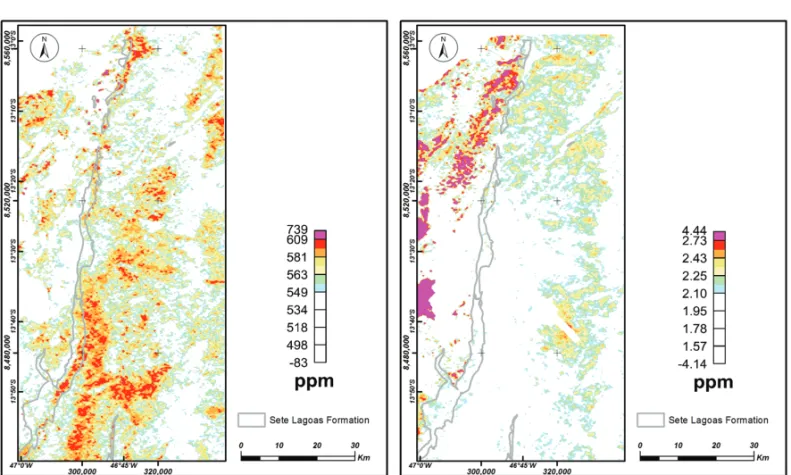
The survey was conducted along pre-selected profiles based on the results obtained for the mapping of anomalous areas of phosphorus (Fig. 2a) and uranium (Figs. 3 and 2b – the latter taking into account the presence of fluorine), from results ob-tained by processing publicly available data from airborne geo-physics, stream sediment geochemistry and geology of the region (Fianco et al., 2012).
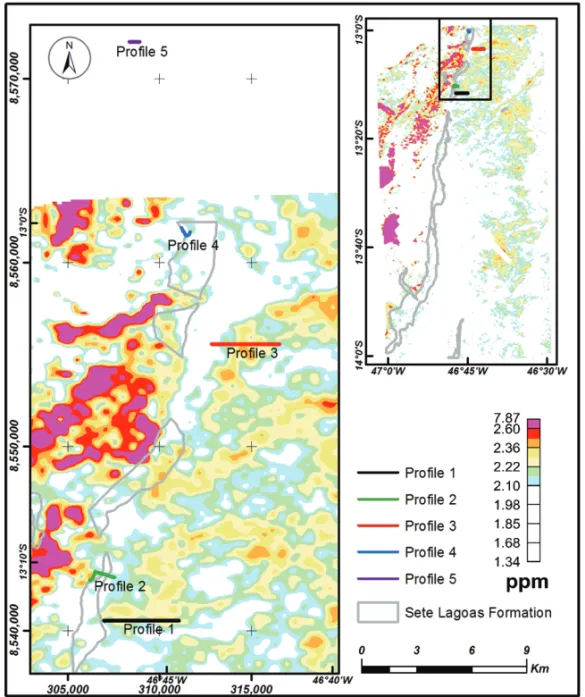
The five profiles (Fig. 3) selected and implemented sat-isfied different selection criteria. The first was plotted against uranium, fluorine and phosphorus anomalies, mapped based on multiple regression of geophysical and geochemical data (Fianco et al., 2012), although these data were inserted into only one mapped lithology. Similarly, the second profile presented anomalous features of uranium, fluorine and phosphorous, but with different lithologies. The third profile, according to geolog-ical mapping carried out by the Itaf´os Minerac¸˜ao Company (un-published), shows a lithology of just siltstone, but with anoma-lies in the maps of estimated uranium and fluorine. The fourth profile, plotted on siltstone, was selected based on its anoma-lous fluorine and phosphorus signature, showing no anomaanoma-lous uranium features. The fifth profile was plotted in an area near a mine (in Tocantins state), over siltstone and phosphorite mapped by Itaf´os, along a line where geochemical information already ex-isted. This last region is not covered by the airborne geophysical data used to generate the map shown in Figure 3.
DATA ACQUISITION
The gamma spectrometer used for the survey was the GR-320, with a detector of sodium iodide activated with thallium (Nal(Tl)) measuring 75 mm in diameter and 75 mm thickness. It has a resolution of 256 channels, and an internal cesium source for system stabilization (Exploranium, 2007). The equipment belongs to the Laboratory of Applied Geophysics (LGA), Univer-sidade de Bras´ılia (UnB), and undergoes regular maintenance and calibration by the laboratory’s technicians.
A total of approximately 10,712 meters were profiled, with sampling interval of 20 meters, totaling 527 stations (Table 1). Reading time was 300 seconds at each station, as recommended by the radiometric mapping guide (IAEA, 2003).
Figure 1 – Geological map of the study area (modified from Moreira et al., 2008).
Radioelements (K, Th and U) are detected by measuring the energy emitted during their decay, where one or more products of the decay chain are partially or completely removed or added to the system. Thorium is rarely found in equilibrium in nature and there is no potassium disequilibrium. Uranium disequilib-rium, however, is common, and can occur at various positions in the238U decay chain: 238U can be selectively transformed to 234U and vice versa,230Th and226Ra may be selectively removed
from the decay chain, and finally222Rn (gas) is mobile and can
escape from the soil and rocks to the atmosphere. It can take days, months or even millions of years for equilibrium to be reached, depending on the half-life of the isotopes involved (IAEA, 2003).
For these reasons, the uranium series is a source of error in gamma spectrometry. Uranium concentrations are calculated by measuring the isotopes214Bi and214Pb. These are far down the
radioactive decay chain and may not be in equilibrium with U. Uranium concentration estimates are then reported as “equivalent uranium” (eU) in parts per million (ppm), since these estimates assume equilibrium conditions. Thorium is also usually reported
as “equivalent thorium” (eTh) in ppm, despite the fact that thorium series is almost always in equilibrium (IAEA, 2003).
Potassium concentrations are calculated in a straightforward manner from40K gamma ray emission and the result is reported
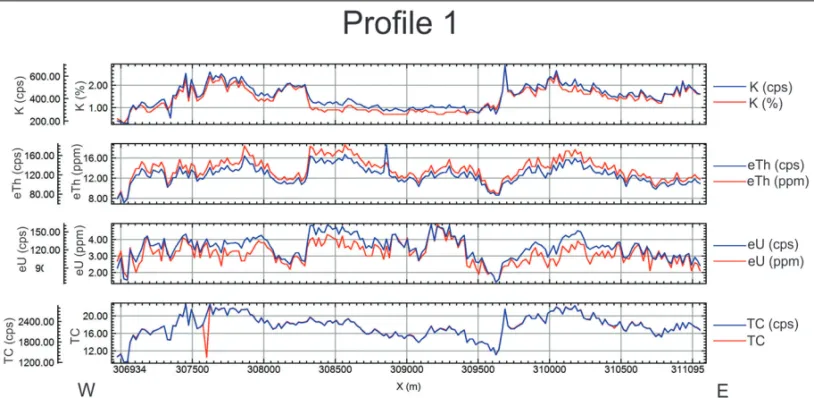
as a percentage (%). The small differences between the values obtained during the survey in cps, ppm and % can be observed in the graph (Fig. 4) and profile 1 table (Table 1).
Table 1 – Information of ground profiles like:
extension and number of stations in each.
Profile Extension Number (m) of stations Profile 1 3,885 197 Profile 2 1,688 82 Profile 3 3,709 179 Profile 4 850 41 Profile 5 580 28 Total 10,712 527
Taking into account that radioelements concentrations may be susceptible to environmental, pedogenic, geomorphological and
Figure 2 – a) Map of Phosphrous estimates in ppm, results from linear regression equation of P related to eU, K, eTh, eU/eTh, eU/K, eTh/K and ASA.
b) Map of Uranium estimates in ppm, results from linear regression equation of U related to K, eTh, eU, eU/eTh, eU/K, eTh/K, ASA, P and F.
geochemical effects, and lithological variations (e.g. Dickson & Scott, 1997), we took care to avoid the rainy season, drainage ar-eas and maintain always the same distance (∼30 cm) between the equipment and the terrain.
According to verbal information provided by geologists of Minerac¸˜ao Itaf´os, the mineralized bodies in the region extend, in general, up to 100 m long and about 40 m wide with preferential NW-SE direction. The 20-m spacing between stations was set to ensure at least one sampling point on them, and good data spatial distribution.
DATA ANALYSIS
The acquired gamma ray spectrometric data presented and dis-cussed here are based on the radioelements profiles, eTh and eU expressed in ppm (parts per million) and K in percentage (%), the total count in cps (counts per second) and eU/K and eU/eTh ratios. The ratios were calculated after analyzing the correlation between the profiles of each element, where an inverse correla-tion between potassium and uranium data was observed.
Figure 4 shows the results for K, eTh, eU and CT, in cps; K, in %; and eU and eTh, in ppm, in order to show the good tion obtained between the results. Figure 4 shows these correla-tions for profile 1 data, but the good correlation observed in this
profile is also observed in all the rest. The good correlation ob-served shows that the instrument was calibrated.
Relying on the correlation between % and ppm found in the literature regarding these radioelements concentrations in the crust, we chose to work with the transformed data, i.e. in ppm and %.
PROFILE 1
Profile 1 is 3,885 meters long, E-W trending, in the south-central portion of Figure 3. This profile has been plotted based on eU, F and P anomalies mapped by airborne data processing (Fianco et al., 2012) and integrated with stream sediment geochemistry data of SIG Goi´as (Moreira et al., 2008). Furthermore, there is a geochemical analysis point of this stream sediment close to the profile with P value greater than 600 ppm (Moreira et al., 2008). Topographic variation is small and vegetation almost exclusively pastures throughout almost the entire profile. The profile crosses a small stream at the eastern end (indicated by the blue arrow, Fig. 5a). This profile has no known mineralization.
The lithology, shown at the upper part of Figure 5, is con-stituted predominantly by siltstone, which occurs at the begin-ning (west), limestone blocks (not mapped, but identified in the field), and localized portions with laterization features identified in the field.
Figure 3 – Map of uranium estimates and geochemical points with P content over 600 ppm, and the localization of the
5 ground profiles of gamma ray acquisition. There is no data information in the area over profile 5.
Figure 5 shows the post-processed data of eU, eTh and K; the eU/eTh and eU/K ratios; and total count (cps). Table 2 shows the minimum, maximum, mean and standard deviation values of the radioelements along Profile 1.
Table 2 – Statistical data of field survey for Profile 1.
K Th U TC (%) (ppm) (ppm) Minimum 0.3 7.1 1.4 9.4 Maximum 2.9 18.6 4.9 22.7 Average 1.36 13.76 3.16 17.65 Standard deviation 0.50 2.13 0.65 2.55 Along the profile, K content (Table 2) varies from 0.3% to 2.9%, with an average of 1.36%, which is below the crust
av-erage of 2.5%. The profile of K (Fig. 5a) shows a fairly obvious feature in the central, flat region, with values around 1% bordered by values that rise abruptly up to 3%. In other regions, K concen-tration ranges between 1 and 2.9 percent, reaching values slightly above the calculated crust average (2.5%), with the lower values occurring at the beginning of the profile (west).
The eTh profile (Fig. 5b) shows an irregular pattern, with con-centration ranging between 7 and 18 ppm (Table 2), and, in gen-eral, with values above the average eTh values in the crust (8-12 ppm). The eU profile (Fig. 5c) has also an irregular pattern, with values ranging between 1 and 5 ppm (Table 2). In the central region, however, two subtle enrichment peaks can be observed (about 5 ppm). These two profiles illustrate well the flooded areas, since the values of the elements decline significantly.
Figure 4 – Comparison profiles of radioelement values of K, eTh, eU and total count acquired in the field, with values in cps (counts per second), percentage (%) and
ppm (parts per million).
Figure 5 – Profiles of radioelement values of K (a), eTh (b), eU (c) and total count (d) acquired in the field, and eU/eTh and eU/K ratios (e) for Profile 1. The blue arrow
The total count profile has two significant lows (Fig. 5d); the first towards the west, where there is occurrence of limestone and the second near the coordinate 309500 m east, where there is a stream.
Two main peaks can be easily identified in the eU/K and eU/eTh profiles (Fig. 5e), indicated by A1 and A2 arrows, in which the levels of uranium in relation to eTh and K are high (above 0.3 and above 7, respectively). These points were selected for field check with priority 1.
Despite only one lithology being mapped along almost the entire profile, with the exception of the limestone in the begin-ning, there are large variations in radioelements concentration; like the region where the low K values (Fig. 5a) correlates with the two eU peaks (Fig. 5c). The two peaks (A1 and A2) could pos-sibly be explained by the presence of lateritic concretions found in this region.
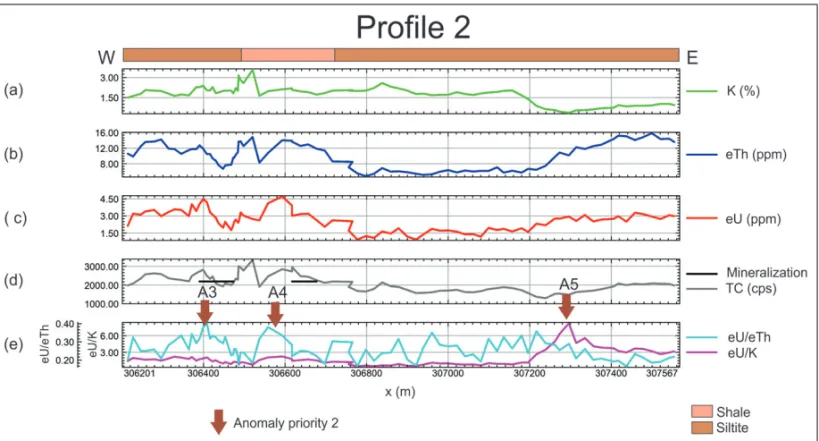
PROFILE 2
Profile 2 is 1,688 m long and was traced because it crosses dif-ferent lithologies, including one phosphorite mapped by Itaf´os. This area does not have any points of anomalous P geochemistry (Moreira et al., 2008). However, anomalous eU, F and P features were mapped (cut by the profile) using the multiple regression
method, in which geophysical and geochemical information were integrated. The profile was planned as a straight E-W line, but it was modified (green profile in Fig. 3) due to lack of authorization to open pathways by the landowner.
The profile geology varies from W to E, starting with silty-clay soil, followed by a zone of schist faults with quartz pebbles, and then followed by siltstone. These rock types are represented in plan view at the top of Figure 6. Figure 6d also shows phospho-rite outcrops, mapped by Itaf´os, intercepted by the profile in two regions.
Figure 6 shows the post-processed data of radioelements eU, eTh and K; the total count (cps), and eU/eTh and eU/K ra-tios for profile 2. Table 3 shows the minimum, maximum, mean and standard deviation values of the radioelements in this profile.
Table 3 – Statistical data of field survey for Profile 2.
K Th U TC (%) (ppm) (ppm) Minimum 0.4 4.6 1 10.2 Maximum 3.6 15.7 4.8 26.1 Average 1.7 9.81 2.62 16.30 Standard deviation 0.62 3.24 0.86 3.24 The K profile (Fig. 6a) averages between 1.5 and 2%, be-low the crust average (2.5%). However, a peak concentration of
Figure 6 – Profiles of radioelement values of K (a), eTh (b), eU (c) and total count (d) acquired in field, and eU/eTh and eU/K ratios (e) for Profile 2. The brown arrows
almost 4% can be observed around the coordinate east 306500 m, which we correlated with the dolomite of Sete Lagoas Formation. The values of K decrease significantly in the last 300 meters of the profile (east), an area dominated by siltstones.
Thorium varies between 4 and 16 ppm throughout the pro-file (Fig. 6b). At the beginning the values are more expressive, especially a well-marked peak (the same peak observed in the K profile) with concentrations of about 15 ppm, above the crust av-erage (8-12 ppm). After this stretch, the concentration decreases for nearly 400 meters to 5 ppm average. In the final part of the profile the content rises considerably, reaching once more values up to 16 ppm.
Uranium (Fig. 6c) profile is similar to thorium (Fig. 6b). The average value of the western portion is higher (3 ppm), declin-ing in the central portion and increasdeclin-ing slightly in the eastern portion. Still, two peaks (306400 m and 306600 m) reaching rel-atively high values up to 4.5 ppm are evident in the initial part.
Total count profile (Fig. 6d) shows a more regular behav-ior, with less significant, but no less important variations. The first half (western portion) of profile 2 (Fig. 6) has at least three major peaks: one more pronounced central peak at 306500 m and two lateral (indicated by brown arrows) with relevant impor-tance, considering the presence of mineralized bodies, mapped by Itaf´os and marked on the total count profile (TC) with black lines (Fig. 6d). The second half (eastern) presents a more constant behavior with no significant features.
The eU/K profile (Fig. 6e) behaves more regular, with a notice-able peak in the last quarter (east), indicated by arrow A5 (Fig. 6e). The eU/eTh profile (Fig. 6e) shows an irregular pattern, with many highs and lows, and two relevant peaks (values 0.4), identified by arrows A3 and A4 (Fig. 6e), coincident with the mineralized areas. These points are indicated for field verification.
A careful analysis of the two mapped mineralization regions and the radioelement profiles shows an offset of a few meters between mineralization (black lines in CT profile) and uranium peaks with more than 3 ppm (Fig. 6c). Furthermore, the eU/eTh profile (Fig. 6e) also shows relatively high values of eU and eTh. The A5 peak, on the eU/K profile (equal to 8, in Fig. 6e), requires further investigation.
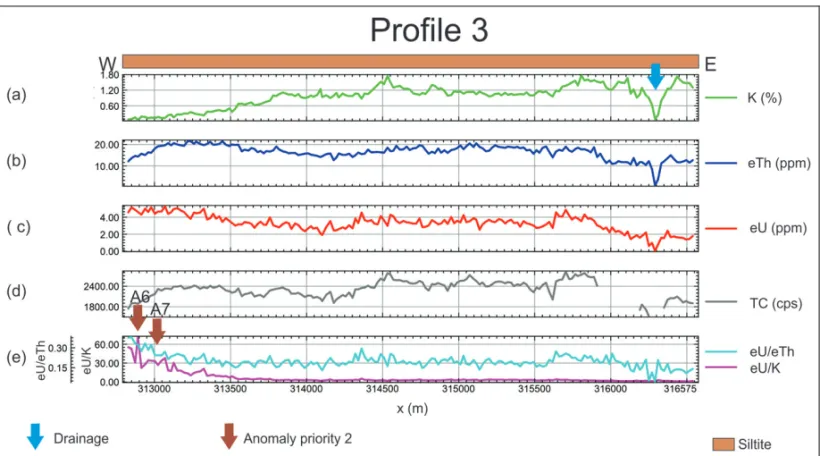
PROFILE 3
Profile 3 is 3,709 m long on E-W direction, cutting two dis-tinct lithologies according to the geological map (Moreira et al., 2008). But, this region is formed only by siltstone according to the mapping done by Itaf´os. This profile crosses F and eU anoma-lies, quite evident in the maps, and has no P related anomaly (red
profile in Fig. 3). The profile is located almost exclusively in pas-ture area, crossing a marsh on the eastern end.
The geology along this profile is quite monotonous, mainly with silty lithology and only minor compositional and coloring variations (Fig. 7). The topography does not vary much along the profile, and the vegetation is varied; pasture, forest and deforested areas.
Figure 7 shows the post-processed data of eU, eTh and K; total count (cps), and eu/eTh and eU/K ratios. Table 4 shows the radioelements maximum, minimum, average and standard devia-tion values along profile 3.
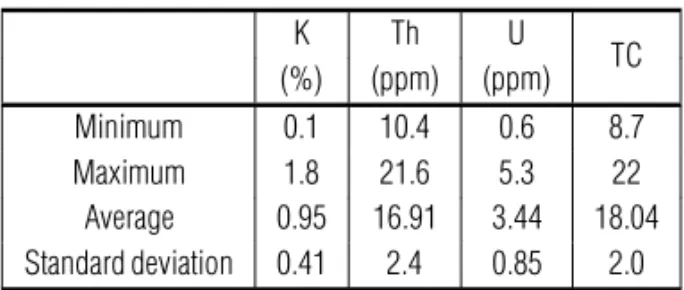
Table 4 – Statistical data of field survey for Profile 3.
K Th U TC (%) (ppm) (ppm) Minimum 0.1 10.4 0.6 8.7 Maximum 1.8 21.6 5.3 22 Average 0.95 16.91 3.44 18.04 Standard deviation 0.41 2.4 0.85 2.0 K (Fig. 7a) has a low concentration at the beginning of the profile (western part), reaching about 0.8%, with some peaks of 1.6% at the center and end of the profile. All values are below average crust concentration (2.5%). In the region indicated by the blue arrow, K levels decline abruptly, showing clearly the presence of water.
The eTh values do not change significantly over the entire profile 3 (Fig. 7b), with the exception of the marsh area (indicated by blue arrow), where the values decrease from 10 ppm to nearly 0 ppm. The average eTh levels along the profile are about 15 ppm, above the average values of the crust (8-12 ppm).
Like in profile 3b, uranium profile (Fig. 7c) does not vary significantly, except in the last 500 meters, where values tend to zero in the marsh region. Uranium levels along the profile aver-age more than 3 ppm, considered high for the element since it averages 2 ppm in the Earth’s crust.
Total count (Fig. 7d) shows more obvious variations at the beginning and end of the profile (West and East, respectively) where the radioelements concentrations are lower, and in the central portion where the values increase, but with no apparent peaks.
The eU/eTh profile (Fig. 7e) shows a rather regular behavior with only one low in the marsh area, and a high at the beginning, but nothing very significant. The eU/K profile (Fig. 7e) presents an anomalous early portion (west), with higher values and a peak, indicated by the brown arrow A6 (Fig. 7e). In this region, enrich-ment of uranium compared to potassium can be observed.
Figure 7 – Profiles of radioelement values of K (a), eTh (b), eU (c) and total count (d) acquired in the field, and eU/eTh and eU/K ratios (e) for Profile 3. The blue arrow
indicates a marsh region, and the brown arrows anomalous features in the area (A6 and A7).
In the beginning of the western portion of the profile, for ap-proximately 700 meters (Fig. 7c), the eU levels are about 4 ppm, and K levels are almost zero. Despite the known mineralized bodies in the region having extensions smaller than 100 meters, this region, marked with arrow A7 (Fig. 7e), also shows an in-teresting pattern with high eU/eTh and eU/K values compared to known mineralization areas, something worthy of further field investigation.
The lack of information in some segments of the total count (cps) profile (Fig. 7d) corresponds to periods when analog record-ing of data was not possible, due to a momentary problem in the equipment’s display.
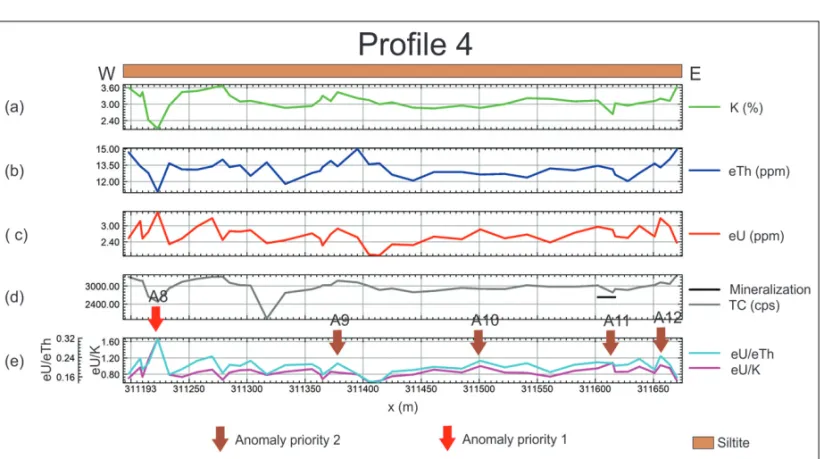
PROFILE 4
Profile 4 is located west of Minerac¸˜ao Itaf´os and extends 850 m (blue profile in Fig. 3). The profile, first drawn with E-W direc-tion, was modified to run along existing secondary roads due to problems with the landowner. The survey intersects mapped fluorine and phosphorus anomalies, but no uranium anomalies. The profile is near a geochemical sampling point with P value above 600 ppm.
This profile cuts mainly silty soil with fragments of siltstone and siltstone outcrops (Fig. 8) with very rugged topography. The survey was conducted along the secondary road that runs
through the area. There is a phosphorite body mapped by Itaf´os in the region (Fig. 8d).
Table 5 – Statistical data of field survey for Profile 4.
K Th U TC (%) (ppm) (ppm) Minimum 2.1 10.8 2 19.4 Maximum 3.7 14.6 3.6 26.1 Average 3.10 12.78 2.73 23.45 Standard deviation 0.31 0.75 0.34 1.40 Profile 4a (Fig. 8) presents a very noticeable K depletion early on (west), while the remainder varies from about 3% to 3.6%, lo-cally. A slight concentration decrease occurs in the region where mineralization is marked (mapped close to the line), only to rise again at the eastern portion.
Thorium falls significantly at the beginning of profile 4b, to the west (Fig. 8b), where K concentration also decreased, but then increases to an average of 13 ppm. Near the coordinate 311400 m east, reaches a peak of 15 ppm, and then immediately falls to values between 12.5 and 13.5 ppm. Similar to potassium, thorium levels increase again, reaching 15 ppm, at the eastern end.
Uranium profile (Fig. 8c) shows an irregular behavior. It has a sharp peak at the beginning of the line (red arrow), as opposed to K and eTh, justifying the peaks that occur in the ratio
pro-Figure 8 – Profiles of radioelement values of K (a), eTh (b), eU (c) and total count (d) acquired in the field, and eU/eTh and eU/K ratios (e) for Profile 4. The arrows of
this profile indicate anomalous features in the area, the red ones with first priority (A8) of investigation and the brown ones with second priority (A9, A10, A11 and A12).
files listed below. It also has two smaller peaks west and east of this main peak. These three peaks have levels higher than 3 ppm. Moving towards the end of the line (eastern portion) we see vari-ations between 1.6 and 3 ppm, and a new peak above 3 ppm at the eastern end. A slight increase, to about 3 ppm, occurs in the mineralization area.
The total count profile (Fig. 8d) is more constant, with two large depletions, one at the beginning (western portion), where the uranium peaks and K and eTh lows occur, and the other near the coordinate 311320 m east. A slight decrease of the radioelements concentrations is also observed in the mineralization region.
In profile 6 of eU/K and eU/eTh ratios (Fig. 8e), a well-marked peak is observed at the beginning of the line (west), indicated by the red arrow A8 (Fig. 8e), and other less obvious peaks along the line marked with brown arrows A9, A10, A11, A12 and A13 (Fig. 8e).
Although the lithology mapped throughout profile 4 is con-stant, siltstone, profiles of the 3 radioelements (K, eU and eTh) indicate variations in its composition. As discussed individually, in the region where an ore presence was mapped near the sur-veyed line, K values decrease slightly, while eU and eTh values rise slightly, also observed in the ratios profile.
The arrows in the ratios profile (Fig. 8e) indicate field check locations. These peaks indicate enrichment of Uranium in rela-tion to eTh and K.
PROFILE 5
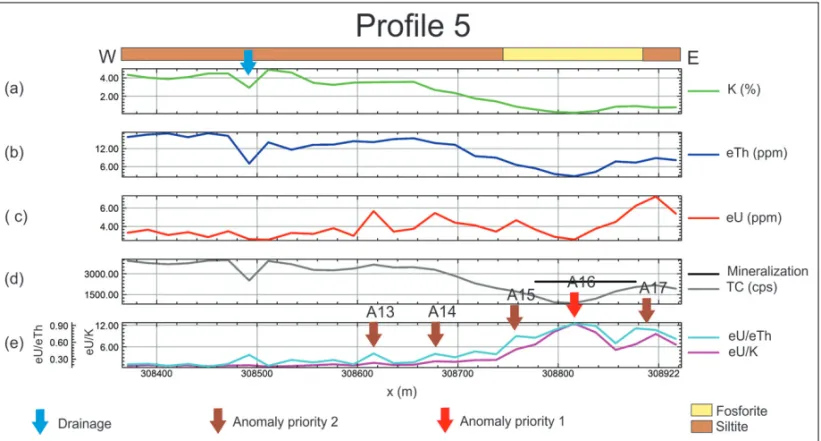
Profile 5 is in Tocantins, in an area where Itaf´os is mining phos-phate, but without any information from airborne geophysics. Along this 580-m long profile, E-W trending, 28 measurements were performed. The survey crosses a mapped phosphorite body. This profile was chosen because geochemical soil sampling, and geophysical surveys with GPR and two-dimensional electrical imaging has already been conducted by Itaf´os.
The geology in Figure 9 determines siltstone as the prevail-ing lithology along this profile, while there is also a phosphorite body (Fig. 9d) mapped by Itaf´os. The position indicated by the blue arrow (Fig. 9a) marks a stream that cuts the profile. The area in the western part has a slightly rugged relief with pasture, which becomes thicker vegetation near the stream.
Figure 9 shows the post-processed data of the radioelements eU, eTh and K; total count (cps); and eU/eTh and eU/K ratios. Table 6 shows the minimum, maximum, mean and standard devi-ation values of the radioelements along Profile 5.
Potassium profile (Fig. 9a) is marked by a high to the west and a significant drop from halfway the line to the east. Values range from about 4% in the higher regions, to almost 0 in the lower region, an area with a phosphorite body mapped by Itaf´os.
The eTh profile (Fig. 9b) shows a pattern quite similar to potassium (Fig. 9a), with the highest values (18 ppm) in the west-ern portion, with a significant decrease in the eastwest-ern portion,
Figure 9 – Profiles of radioelement values of K (a), eTh (b), eU (c) and total count (d) acquired in the field, and eU/eTh and eU/K ratios (e) for Profile 5. The blue
arrow indicates the presence of a stream in the area, and the other arrows anomalous regions encountered on profiles. The red arrow indicates first priority (A16) of investigation and the brown ones, second priority (A13, A14, A15 and A17).
where it reaches its lowest value of 4 ppm increasing slightly at the end.
The eU profile (Fig. 9c) shows high values over the entire line, ranging from 2 to 7 ppm. From the beginning (west) un-til almost the middle of the survey line, values range between 2 and 4 ppm, showing two peaks of about 6 ppm on the center, marked with brown arrows. There is a less obvious peak near co-ordinate 308750 m east. The mapped mineralization area of the region shows a slight decrease in eU values, but these remain high, above 3 ppm. At the end of the line, marked by the brown arrow, occurs a peak that reaches approximately 7 ppm.
Table 6 – Statistical data of field survey for Profile 5.
K Th U TC (%) (ppm) (ppm) Minimum 0.2 2.7 2.6 6.8 Maximum 4.9 16.5 7.2 31.2 Average 2.58 10.95 3.97 21.81 Standard deviation 1.57 4.33 1.13 8.00 Total count (Fig. 9d) exhibits the same behavior of K and eTh, with higher values in the beginning of the line, a slight fall in the stream region, and low values in the mineralized body region.
The eU/K and eU/eTh profiles (Fig. 9e) show similar behav-ior among themselves, and with the uranium profile. Low values
at the beginning of the profile (west) and a significant increase in the last third of the line, or, in other words, a west to east growth trend. Along these profiles, 5 peaks of eU enrichment relative to eTh and K were marked by arrows. The first two, A14 and A15 (Fig. 9e) have a lower amplitude, and the last three, A16, A17 and A18 (Fig. 9e) larger amplitudes. It is evident that the greatest amplitude of eU enrichment occurs where the phosphorite was mapped and marked in the profile, which illustrates that miner-alized regions present low K and eTh values compared to eU. These points are designated for field verification.
DISCUSSION AND CONCLUSIONS
In Profile 5, it is noteworthy the significant eU/K growth trend (Fig. 9e) from west to east. Note that the highest eU/K and eU/eTh values coincide with the mineralized area (black line in the CT profile, Fig. 9d), thus proving the efficiency of gamma spectrometry method for mineralization mapping.
The areas marked in profiles 5d (Fig. 9), do not have U-values well above the crustal average; however, they have high rela-tive values (mean around 3-4 ppm). Some points have eU peaks with K and eTh depletions; important indications that there is an inverse correlation between these elements. According to these analyses, we conclude that the ratios are the best products to map phosphorite.
It is evident from the profiles that wherever there is mineral-ization information (Fig. 6d, 8d, 9d) a small shift/displacement between the mineralized strip and the uranium peaks occurs. This information has various positioning bases and may contain distortion, due to the acquisition by different devices (GPS), which have varying error, or different positioning data acquisition methodology.
The careful analysis of the five gamma spectrometry terres-trial profiles shows that all known mineralizations along the pro-files have high eU/eTh and eU/K values with clearly marked peaks. Hence, we conclude that the eU/eTh and eU/K profiles are the best mappers of phosphorite mineralization.
Eighteen sites were selected for investigation of radioelement anomalies. Seven of these were priority one and eleven, prior-ity two. It is suggested that bore sampling be performed in these regions for further analysis.
ACKNOWLEDGEMENTS
Thanks are due to Itaf´os Minerac¸˜ao Ltda. for support in the field work, providing information and permission for data publication and the Superintendˆencia de Geologia e Minerac¸˜ao do Governo do Estado de Goi´as for the assignment of airborne geophysical data of Area V.
REFERENCES
ASHFAHANI J. 2002. Phosphate Prospecting Using Natural Gamma Ray Well Logging in the Khneifiss Mine, Syria. Available on: <http://emg.geoscienceworld.org/cgi/content/abstract/11/1-4/61>. Access on: November 16, 2009.
BECEGATO VA & FERREIRA FJF. 2005. Gamaespectrometria, resistivi-dade el´etrica e susceptibiliresistivi-dade magn´etica de solos agr´ıcolas no no-roeste do Estado do Paran´a. Brazilian Journal of Geophysics, 23(4): 371–405.
DARDENNE MA. 1978. S´ıntese sobre a estratigrafia do Grupo Bambu´ıno Brasil Central. In: Congresso Brasileiro de Geologia, 30., Recife, Brazil,
Proceedings... Sociedade Brasileira de Geologia – SBG, 2: 597–610. DICKSON BL & SCOTT KM. 1997. Interpretation of aerial gamma-ray surveys – adding the geochemical factors. In: Airborne Magnetic and Radiometric Surveys. ASGO Journal of Australian Geology & Geo-physics, 17: 187–200.
EXPLORANIUM. 2007. GR-320. Portable Gamma Ray Spectrometer. Users’ Manual. Revision 3.5.
FERREIRA CJ, MOREIRA-NORDEMANN LM & NORDEMANN DJR. 1992. A radioatividade natural da regi˜ao de Irecˆe, BA. Revista Brasileira de Geociˆencias, 22(2): 167–174.
FIANCO CB, VIDOTTI RM, PIRES ACB & CARMELO AC. 2012. Prospect-ing phosphorites usProspect-ing airborne geophysics in northeastern Goi´as State – Brazil. Brazilian Journal of Geophysics, 30(4): 459–471. IAEA – International Atomic Energy Agency. 2003. Guideline for radio-element mapping using gamma ray spectrometry data. Vienna, Austria. 171 pp.
ITAF ´OS MINERAC¸˜AO. 2010. Mapa litol´ogico em SIG, escala 1:10.000. Confidential. Unpublished.
MINTY BRS. 1997. The fundamentals of airborne gamma-ray spectrom-etry. AGSO Journal os Australian Geology & Geophysics, 17(2): 39–50. MOREIRA MLO, MORETON LC, ARA ´UJO VA, LACERDA JV & COSTA HF. 2008. Geologia do Estado de Goi´as e Distrito Federal. Escala 1:500.000. Goiˆania: CPRM/SIC – FUNMINERAL. 141 pp.
NASCIMENTO CTC, FERREIRA FJF, ANDRADE LRM, GASPAR JC & PIRES ACB. 2008. Radiac¸˜ao gama e resistividade el´etrica em solo com aplicac¸˜ao de carbonatito e fertilizantes agr´ıcolas no Distrito Federal. Brazilian Journal of Geophysics, 26(1): 21–29.
SOUZA JL & FERREIRA FJF. 2005. Anomalias aerogamaespectrom´e-tricas (K, eU e eTh) da quadr´ıcula de Araras (SP) e suas relac¸˜oes com processos pedogen´eticos e fertilizantes fosfatados. Brazilian Journal of Geophysics, 23(3): 251–274.
WYNN J. 1996. Geophysics Applied to Phosphate Exploration in North-ern Saudi Arabia. Available on:
<http://volcanoes.usgs.gov/jwynn/2phos.html>. Access on: Novem-ber 17, 2009.
Recebido em 25 marc¸o, 2014 / Aceito em 22 julho, 2014 Received on March 25, 2014 / Accepted on July 22, 2014
NOTES ABOUT THE AUTHORS
Chris Busnello Fianco. M.Sc. in Applied Geosciences (Universidade de Bras´ılia), B.Sc. in Geology (Universidade Federal do Paran´a – UFPR). Four-year professional
experience with airborne geophysical data acquisition and processing. Currently, works as geologist for the mining industry. Areas of interest: Applied Geophysics to mineral exploration.
Roberta Mary Vidotti. Associate Professor at the Instituto de Geociˆencias of Universidade de Bras´ılia. Graduated in Geology at Universidade Federal Rural do Rio de
and Ph.D. in Geophysics from the University of Leeds (1997). Has experience in Geophysics, with emphasis on gravity, magnetic and gamma ray spectrometry methods applied to regional geology, geotectonic, sedimentary basins and mineral prospecting.
Augusto C´esar Bittencourt Pires. Ph.D. in Geophysics (Colorado School of Mines, 1975), B.Sc. in Geology (Universidade Federal do Rio de Janeiro, 1968).
Former president of the SBGf (Brazilian Geophysical Society). Responsible for the Geophysics Department at ENCAL Consultores Associados; Head of the Geophysics Department at the Observat´orio Nacional; Head of the Applied Geophysics Center of the National Department of Mineral Production (DNPM). At the National Research Council (CNPq), held the following positions: Geosciences Supervisor, Coordinator of Exact and Earth Sciences, Superintendent of Exact and Earth Sciences and Director of Programs. Director of Programs for the Coordination of Superior Education (CAPES) and Coordinator of Policies and Plans of the Ministry of Science and Technology. Legislative Consultant for the Senate for issues referring to Mines and Energy. Specialist in the application of geophysical methods as supporting tool for geologic mapping, mineral exploration and environmental analysis. Currently works as Professor at the Instituto de Geociˆencias of the Universidade de Bras´ılia (UnB).