Cellular and substrate-specific interactions characterising
some of the esca pathogens of grapevine
João Daniel Condeço Oliveira
Dissertação para obtenção do Grau de Mestre em
Biologia Funcional
Orientador: Doutor Ricardo Manuel de Seixas Boavida Ferreira
Co-orientador: Doutor Damiano Vesentini
Júri:
Presidente: - Doutora Sara Barros Queiroz Amâncio, Professora Associada do Instituto Superior de Agronomia da Universidade Técnica de Lisboa.
Vogais: - Doutor Ricardo Manuel de Seixas Boavida Ferreira, Professor Catedrático do Instituto Superior de Agronomia da Universidade Técnica de Lisboa,
- Doutora Maria Helena Mendes da Costa Ferreira Correia de Oliveira, Professora Associada do Instituto Superior de Agronomia da Universidade Técnica de Lisboa.
AGRADECIMENTOS
Desejo apresentar os meus sinceros agradecimentos a todos aqueles que me ajudaram a realizar esta dissertação. Esta tese em hipótese alguma poderia ter sido feita sem o seu apoio.
Agradeço ao Damiano Vesentini por ter sido inicialmente meu orientador, posteriormente meu co-orientador e também meu amigo. Ele ensinou-me bastante e “deu-me bastantes vezes nas orelhas”, impressionado com a minha inexperiência. Mas a vida é mesmo assim!
Quero também agradecer ao professor Ricardo Ferreira, também meu orientador. Agradeço a sugestão do tema, e a disponibilidade para efectuar as correcções e as sugestões que fez ao longo do trabalho.
Agradeço também a Teresa Vaz que me ajudou muitas vezes no laboratório, principalmente nos vários ensaios de crescimento, na liofilização dos fungos e nos conselhos que me deu. Foi também uma grande amiga.
Agradeço a Patrícia Pinto que me cedeu a Phaeomoniella chlamydospora e também pela amizade e conselhos que me fez.
Agradeço ao Alexandre e ao João pelo tempo que perderam a ajudar-me com os testes de DNA (que apesar de tudo não puderam fazer parte desta tese devido a resultados insatisfatórios). O Alexandre aqui tentou ajudar-me bastante, foi realmente uma pena os testes não terem resultados, mas o trabalho tinha de prosseguir. Peço também desculpa por ter-lhe estragado um dia inteiro de trabalho por causa do gel de agarose extremamente concentrado, peço também desculpa a qualquer outra pessoa que possa ter prejudicado desta forma. Ao João tenho ainda de agradecer o empréstimo do doseador de agar e pelo facto de ele me ter ensinado a usa-lo.
A Eng.ª Cecília Rego e a Eng.ª Helena Oliveira por informações e bibliografia aconselhada.
A Sandra por conselhos e amizade. As nossas discussões filosóficas foram memoráveis. Espero que ela acabe de escrever o livro e o publique.
Agradeço a Eng.ª Carla e as técnicas de laboratório de microbiologia, pela cedência de material e reagentes e ainda por autoclavarem muito do material que utilizei.
Aos funcionários da CEV por me terem emprestado o PDA e o PDB e ainda por me permitirem usar a máquina fotográfica, houve até alguém que reparou que eu tirava muitas fotografias.
Ao antigo departamento de engenharia florestal que me cedeu as madeiras de Prunus e cortaram e/ou pulverizaram todas as madeiras usadas nos ensaios. Um agradecimento particular a senhora Cristina Alves que me explicou o procedimento para utilizar o PEG e deu algumas sugestões sobre as observações microscópicas.
Ao Laboratório Nacional de Engenharia Civil pela cedência do fungo Trametes versicolor.
Agradeço também as equipas dos laboratórios de Fisiologia Vegetal e Veríssimo de Almeida, pela cedência dos espaços, materiais e pelo apoio prestado.
Agradeço também aos poucos, mas bons amigos que a vida me deu. É de facto verdade que a qualidade é mais importante que a quantidade. Agradeço especialmente a Soraia Serrão e ao José Silva.
Agradeço com um carinho especial a minha família, tios, primos, avós, pais, irmão e sobrinha. Por vezes a vida obriga-nos a tomar decisões difíceis, acreditem que foi a mais difícil que já tomei.
Agradeço de forma especial a minha mãe que fez tudo por mim. Ela a dormir sabe mais sobre mim do que eu acordado. Houve muitas pessoas que me “deram nas orelhas”, mas quando a minha mãe pressentiu que eu ia desistindo, da forma que só as mães conseguem pressentir, ralhou comigo como se eu fosse uma criança pequena. E hoje eu agradeço isso.
Agradeço também a todas as forças e poderes do plano astral que me ajudaram e protegeram neste trabalho e também a Deusa mãe. Embora não tenha visto referencias as crenças nos agradecimentos de outras teses, estes agradecimentos são meus e os coloco aqui.
Há um último agradecimento especial que tenho de fazer; ao Sérgio Vieira. No último ano a minha vida saiu do meu controlo, o Sérgio consegui amparar a minha queda e se esta tese está aqui é em muito graças a ele.
São incríveis as voltas que o mundo dá, ainda hoje fico impressionado com o desenvolvimento que as coisas podem ter. Agora percebo algumas coisas que a uns anos me foram ditas e a insistência em não desistir. Afinal todas as coisas acabam por ter uma solução.
Se alguma omissão ocorreu neste agradecimento, peço desde já as minhas sinceras desculpas. Mais uma vez obrigado a todos quanto me ajudaram.
“Ora, assim como a Natureza dá ao cultivador a terra e o grão, ao microbiologista o agar-agar e o esporo, de igual modo fornece ao alquimista o terreno metálico próprio e a semente que convêm.”
ABSTRACT
Esca is a grapevine trunk disease, caused by one association of fungi. Phaeomoniella chlamydospora is presumably the first fungus to infect grapevine. Other fungus that belongs to the complex is Fomitiporia mediterranea. In this study Trametes versicolor was used as a control because it is used as model organism in other studies. Whoever it’s capable of degraded wood. Exist the possibility of the wood of Ficus carica have properties anti fungal, however little is knowh about this matter. The wood of Prunus was also contemplated on this study. The tree fungis where subjected to anaerobic conditions, and do not present any grow. The fungis produces H2O2 and ROS when they interact
between them. The interaction of Phaeomoniella chlamydospora and Trametes versicolor produces one big mark of interaction visible even whiteout reagents. The phenotype of aerial hyphae is altered. Fungi have demonstrated capacity to degrade wood of the different species. The degradation was observed on the microscope using different methods. The wood was also used to produce different means of agar using dust and extract of wood. For every case where obtain different rates of growth and degradation. The tree fungi have the ability to degrade wood. The peripheral growth of the hyphae was observed in different media, the phenotype have no alterations, but the length of the hyphae have alterations.
RESUMO
A esca é uma doença do lenho da videira causada por uma associação de fungos. Pensa-se que o primeiro fungo a invadir seja a Phaeomoniella chlamydospora. Um outro fungo associado a esca é a Fomitiporia mediterranea. Trametes vericolor é um fungo que degrada madeira não associado a esca. Existe a possibilidade da madeira de Ficus carica ter propriedades antifungicas, no entanto muito pouco se sabe sobre este assunto. O lenho de Prunus serviu de madeira controlo. Os fungos foram sujeitos a condições anaeróbicas e não apresentaram crescimento. Os fungos produzem H2O2 e ROS quando
interagem entre si. A interacção entre Phaeomoniella chlamydospora e Trametes versicolor produz uma grande mancha de interacção, o fenótipo deste ultimo chega a ser alterado, observando-se menos hífas aéreas. Os fungos demonstraram capacidade de degradar a madeiras das diferentes espécies vegetais. A degradação das madeiras foi observada ao microscópio segundo diferentes métodos. A partir das madeiras foram criados meios de agar à base de pó de madeira e de extracto de madeira. Para cada caso foram obtidas diferentes taxas de crescimento e degradação. O crescimento periférico das hífas foi observado em diferentes meios, embora não haja alteração no fenótipo, existem diferenças no comprimento das hifas.
RESUMO ALARGADO
A esca é uma doença do lenho da videira (Vitis vinífera), causada por uma associação de fungos. A esca apodrece a madeira da videira e também causa a sua morte, razão pela qual a madeira da vinha foi estudada. Neste trabalho foram estudados dois fungos da esca, Phaemoniella chlamydospora e Fomitiporia mediterranea. Pensa-se que P. chlamydospora seja o primeiro fungo a invadir o lenho da videira. Posteriormente a madeira é invadida por outros fungos, incluindo F. mediterranea. Como fungo controlo foi usado para este estudo Trametes versicolor um fungo que causa grandes prejuízos na construção civil ao apodrecer a madeira. Este fungo encontra-se muito bem caracterizado seno por isso utilizado em muitos estudos como organismo controlo. Na Natureza encontra-se em madeiras de árvores mortas, tendo grande importância na degradação das mesmas e na reciclagem de nutrientes. A madeira da figueira (Ficus carica) possui uma densidade próxima da madeira da videira e por isso foi contemplada neste estudo como madeira controlo. Complementarmente a madeira de figueira será estudada para perceber se existe nesta potencial anti-fúngico. Outra madeira controlo utilizada foi a madeira proveniente de uma árvore do género Prunus não foi possível identificar a espécie em concreto, no entanto a sua densidade é próxima da densidade do lenho de videira. Neste estudo observou-se que os fungos não crescem em anaerobiose, permanecendo no entanto vivos o que indica que são aeróbios facultativos. As madeiras foram sujeitas a testes de degradação por parte dos fungos. Em todos os casos ocorreu perda de massa da madeira. As madeiras degradadas foram observadas a lupa e ao microscópio segundo várias técnicas microscópicas. As observações histológicas revelaram os danos a nível das paredes celulares das madeiras e a presença das hífas dos fungos. É possível que P. chlamydospora tenha capacidade para degradar a madeira morta. O fungo F. mediterranea pode muito provavelmente infectar o lenho da videira sem o suporte de P. chlamydospora, poderá acontecer portanto que nalguns casos este fungo possa ser o primeiro da sequência. Também foram estudadas as interacções entre fungos, nomeadamente a producção de H2O2 e de ROS. O fungo T. versicolor mostrou
uma alteração de fenótipo visível mesmo sem análise de produção de espécies reactivas de oxigénio. Diferentes meios foram criados com base em pó de madeira e extractos líquidos do pó madeira. Nesses meios foram observados os crescimentos dos fungos. Com os mesmos meios observaram-se a estrutura e o crescimento das hífas. Não foi detectada nenhuma relação entre o crescimento dos fungos em meios, a capacidade para degradar madeira, ou o tamanho dos segmentos de hífas.
INDEX
AGRADECIMENTOS ... i ABSTRACT ... iv RESUMO ... v RESUMO ALARGADO ... vi INDEX ... iLIST OF TABLES ... iix
LIST OF FIGURES ... x
LIST OF ABBREVIATIONS ... xviii
1. INTRODUCTION ... 1
1.1. State-of-the-art on esca
... 1
1.2. Fungal attack and plant defences
... 3
1.2.1. Saprophytic vs. pathogenic fungal interactions
... 3
1.2.2. Rot fungi
... 5
1.3. Wood
... 6
1.3.1. Wood composition and enzymatic degradation ... 6
1.3.2 Wood analysis techniques ... 7
1.4. Fungal growth under aerobic or anaerobic conditions
... 7
1.5. Interactions among fungi and importance of ROS
... 8
2 MATERIALS AND METHODS ... 10
2.1 Fungal cultures
... 10
2.2 Wood material
... 10
2.3 Tests on anaerobiosis
... 10
2.4 Analyses of reactive oxygen species
... 10
2.5 Tests of wood degradation
... 11
2.7 Statistical analysis
... 13
3. RESULTS ... 15
3.1. Effect of oxygen availability and temperature on fungal growth rate
...
153.2. Fungal growth evaluation
... 20
3.3. Detection of reactive oxygen species in isolated or interacting fungal colonies.
21
3.4 Test wood degradation... 26
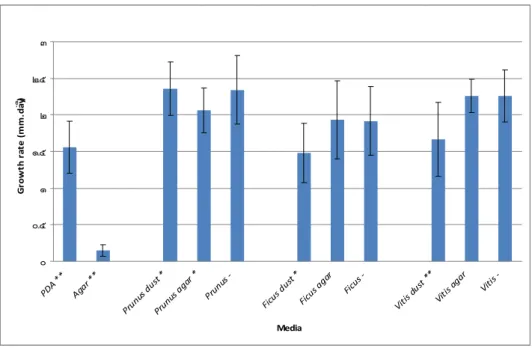
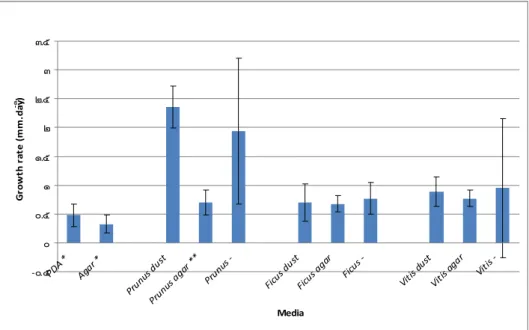
3.5 Test of growth in different media
... 42
3.6 Test of peripheral growth unit
... 52
4. DISCUSSION ... 55 5. FUTURE PERSPECTIVES ... 60 6. BIBLIOGRAPHIC REFERENCES ... 61 ANNEXES ... 69 ANNEX A ... 70 ANNEX B ... 73 ANNEX C ... 74
LIST OF TABLES
LIST OF FIGURES
Figure 3.1: Trametes versicolor (A), Fomitiporia mediterrânea (B) and Phaeomoniella chlamydospora (C) were grown under aerobical conditions, at 15 ºC, for 9 days (A) or 28 days (B and C), red markers delimits the fungal colony.
Figure 3.2: Trametes versicolor (A), Fomitiporia mediterrânea (B) and Phaeomoniella chlamydospora (C) were incubated under anaerobic conditions, at 15 ºC, 28 days.
Figure 3.3: Trametes versicolor (A), Fomitiporia mediterrânea (B) and Phaeomoniella chlamydospora (C) were grown under anaerobic conditions, at 15 ºC, for 28 days and subsequently grown under aerobic conditions, also at 15 ºC, for 10 days (A), or 31 days (B and C) red markers delimits the fungal colonies.
Figure 3.4: Trametes versicolor (A), Fomitiporia mediterrânea (B) and Phaeomoniella chlamydospora (C) were grown under aerobic conditions, at 24 ºC, for 5, 14 and 26 days, respectively, red markers delimits the fungal colonies.
Figure 3.5: Trametes versicolor (A), Fomitiporia mediterranea (B) and Phaeomoniella chlamydospora (C) were inoculated under anaerobic conditions, at 24 ºC, for 26 days and subsequently grown under aerobic conditions, also at 24 ºC, for 5 days (A) or 10 days (B and C), red markers delimits the fungal colonies.
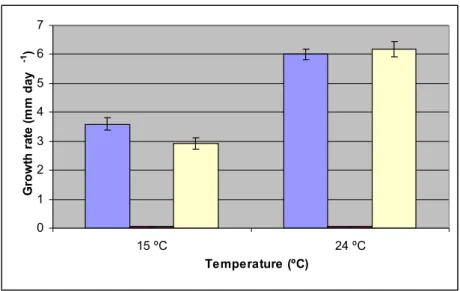
Figure 3.6: Growth rate expressed as the rate of increase of the colony diameter (mm day-1) of Trametes versicolor, at 15 and 24 ºC, under aerobic conditions (Blue), under anaerobic conditions (Red) and under aerobic post-anaerobic phase (Yellow), with the respective standard deviation values.
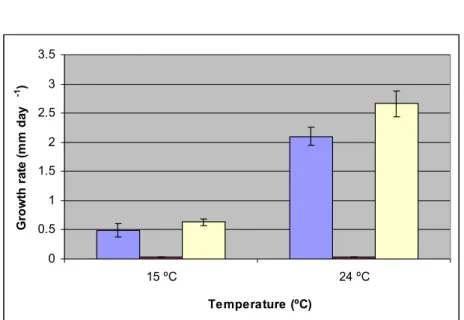
Figure 3.7: Growth rate expressed as the rate of increase of the colony diameter (mm day-1) of Fomitiporia mediterranea, at 15 and 24 ºC, under aerobic conditions (Blue), under anaerobic conditions (Red) and under aerobic post-anaerobic conditions phase (Yellow), with the respective standard deviation values.
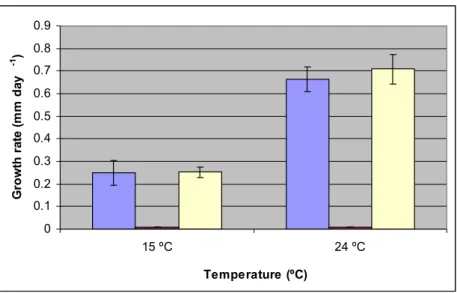
Figure 3.8: Growth rate expressed as the rate of increase of the colony diameter (mm day-1) of Pheaomoniella chlamydospora, at 15 and 24 ºC, under aerobic conditions (Blue), in anaerobic conditions (Red) and under aerobic post-anaerobic conditions phase (Yellow), with the respective standard deviation values.
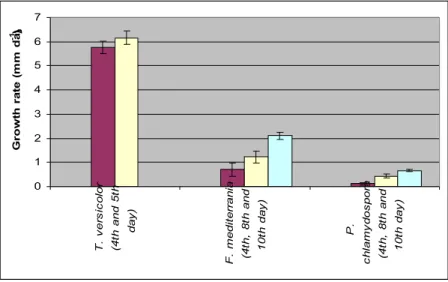
Figure 3.9: Growth rate of fungi at 24 ºC in aerobic conditions, at the beginning of the phase (Red), on the second phase (Yellow) and on the third phase (Blue).
Figure 3:10: Detection of superoxide in isolated colonies of Trametes versicolor (A), Fomitiporia mediterranea (B) and Phaeomoniella chlamydospora (C). Petri dishes were inoculated with the fungal species under study and incubated under aerobic conditions, at 24 ºC, for 5 days.
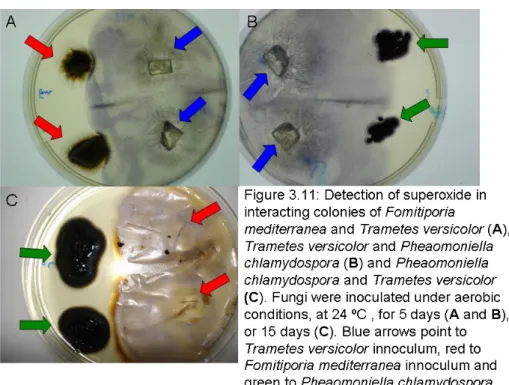
Figure 3.11: Detection of superoxide in interacting colonies of Fomitiporia mediterranea and Trametes versicolor (A), Trametes versicolor and Phaeomoniella chlamydospora (B) and Phaeomoniella chlamydospora and Trametes versicolor (C). Fungi were inoculated under aerobic conditions, at 24 ºC, for 5 days (A and B), or 15 days (C). Blue arrows pointed to Trametes versicolor innocumlum, red to Fomitiporia mediterranea innoculum and green to Phaeomoniella chlamydospora innoculum.
Figure 3.12: Detection of oxygen peroxide in isolated colonies of Trametes versicolor (A), Fomitiporia mediterranea (B) and Phaeomoniella chlamydospora (C). Fungi were incubated under aerobic conditions, at 24 ºC for 5 days.
Figure 3.13: Detection of oxygen peroxide between interacting fungal colonies of Fomitiporia mediterranea and Trametes versicolor (A), Trametes versicolor and Phaeomoniella chlamydospora (B) and Phaeomoniella chlamydospora and Fomitiporia mediterranea (C). Blue arrows point to Trametes versicolor innoculum, red to Fomitiporia mediterranea innoculum and green to Phaeomoniella chlamydospora innoculum.
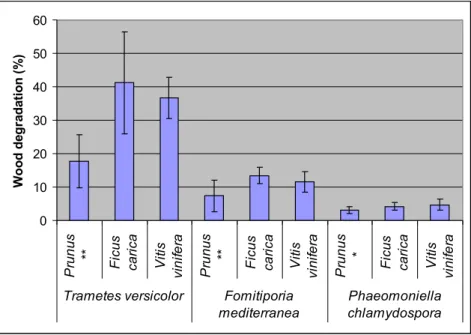
Figure 3.14: Degradation of Prunus, Ficus carica and Vitis vinifera wood, after 38 days of infection by fungal species under study. Fungi were grown under aerobic conditions at 24 ºC, (n=10).
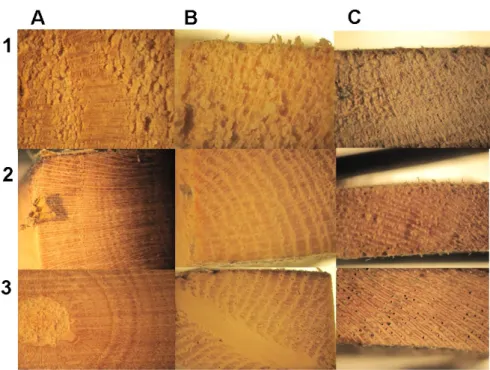
Figure 3.15: Tranversal sections of wood following interaction with the fungi. Letters identify the type of wood. Numbers identify the fungal specie. Prunus (A), Ficus carica (B), Vitis vinifera (C). Trametes versicolor (1), Fomitiporia mediterranea (2), Phaeomoniella chlamydospora (3).
Figure 3.16: Tangential section of wood following interaction with fungi. Letters identify the type of wood. Numbers identify the fungal specie. Prunus (A), Ficus carica (B), Vitis vinifera
(C). Trametes versicolor (1), Fomitiporia mediterranea (2), Phaeomoniella chlamydospora (3).
Figure 3.17: Transversal sections of wood following interactions with the fungus Trametes versicolor in Prunus spp. (A), Ficus carica (B) and Vitis vinifera (C).
Figure 3.18: Tangential sections of wood following interactions with the fungus Trametes versicolor in Prunus spp. (A), Ficus carica (B) and Vitis vinifera (C).
Figure 3.19: Transversal sections of wood following interactions with the fungus Fomitiporia mediterranea in Prunus spp. (A), Ficus carica (B) and Vitis vinifera (C).
Figure 3.20: Tangential sections of wood following interactions with the fungus Fomitiporia mediterranea in Prunus spp. (A), Ficus carica (B) and Vitis vinifera (C).
Figure 3.21: Transversal sections of wood following interactions with the fungus Phaeomoniella chlamydospora in Prunus spp. (A), Ficus carica (B) and Vitis vinifera (C).
Figure 3.22: Tangential sections of wood following interactions with the fungus Phaeomoniella chlamydospora in Prunus spp. (A), Ficus carica (B) and Vitis vinifera (C).
Figure 3.23: Transversal sections of wood following interaction with the fungus Trametes versicolor in Prunus spp. (A), Ficus carica (B) and Vitis vinifera (C). Preparations were stained by the phloroglucinol-HCl method to visualize lignin.
Figure 3.24: Tangential sections of wood following interaction with the fungus Trametes versicolor in Prunus spp. (A), Ficus carica (B) and Vitis vinifera (C). Preparations were stained by the phloroglucinol-HCl method to visualize lignin.
Figure 3.25: Tranversal sections of wood following interaction with the fungus Fomitiporia mediterranea in Prunus spp. (A), Ficus carica (B) and Vitis vinifera (C). Preparations were stained by the phloroglucinol-HCl method to visualize lignin.
Figure 3.26: Tangential sections of wood following interaction with the fungus Fomitiporia mediterranea in Prunus spp. (A), Ficus carica (B) and Vitis vinifera (C). Preparations were stained by the phloroglucinol-HCl method to visualize lignin.
Figure 3.27: Transversal sections of wood following interaction with the fungus Phaeomoniella chlamydospora in Prunus spp. (A), Ficus carica (B) and Vitis vinifera (C). Preparations were stained by the phloroglucinol-HCl method to visualize lignin.
Figure 3.28: Tangential sections of wood following interaction with the fungus Phaeomoniella chlamydospora in Prunus spp. (A), Ficus carica (B) and Vitis vinifera (C). Preparations were stained by the phloroglucinol-HCl method to visualize lignin.
Figure 3.29: Transversal sections of wood following interaction with the fungus Trametes versicolor in Prunus spp. (A), Ficus carica (B) and Vitis vinifera (C). Preparations were stained by the methylene blue method to visualize cellulose.
Figure 3.30: Tangential sections of wood following interaction with the fungus Trametes versicolor in Prunus spp. (A), Ficus carica (B) and Vitis vinifera (C). Preparations were stained by the methylene blue method to visualize cellulose.
Figure 3.31: Transversal sections of wood following interaction with the fungus Fomitiporia mediterranea in Prunus spp. (A), Ficus carica (B) and Vitis vinifera (C). Preparations were stained by the methylene blue method to visualize cellulose.
Figure 3.32: Tangential sections of wood following interaction with the fungus Fomitiporia mediterranea in Prunus spp. (A), Ficus carica (B) and Vitis vinifera (C). Preparations were stained by the methylene blue method to visualize cellulose.
Figure 3.33: Transversal sections of wood following interaction with the fungus Phaeomoniella chlamydospora in Prunus spp. (A), Ficus carica (B) and Vitis vinifera (C). Preparations were stained by the methylene blue method to visualize cellulose.
Figure 3.34: Tangential sections of wood following interaction with the fungus Phaeomoniella chlamydospora in Prunus spp. (A), Ficus carica (B) and Vitis vinifera (C). Preparations were stained by the methylene blue method to visualize cellulose.
Figure 3.35: Transversal sections of wood following interaction with the fungus Trametes versicolor in Prunus spp. (A), Ficus carica (B) and Vitis vinifera (C). Preparations were stained by the picro aniline blue method to visualize fungal hyphae.
Figure 3.36: Tangential sections of wood following interaction with the fungus Trametes versicolor in Prunus spp. (A), Ficus carica (B) and Vitis vinifera (C). Preparations were stained by the picro aniline blue method to visualize fungal hyphae.
Figure 3.37: Transversal sections of wood following interaction with the fungus Fomitiporia mediterranea in Prunus spp. (A), Ficus carica (B) and Vitis vinifera (C). Preparations were stained by the picro aniline blue method to visualize fungal hyphae.
Figure 3.38: Tangential sections of wood following interaction with the fungus Fomitiporia mediterranea in Prunus spp. (A), Ficus carica (B) and Vitis vinifera (C). Preparations were stained by the picro aniline blue method to visualize fungal hyphae.
Figure 3.39: Transversal sections of wood following interaction with the fungus Phaeomoniella chlamydospora in Prunus spp. (A), Ficus carica (B) and Vitis vinifera (C). Preparations were stained by the picro aniline blue method to visualize fungal hyphae.
Figure 3.40: Tangential sections of wood following interaction with the fungus Phaeomoniella chlamydospora in Prunus spp. (A), Ficus carica (B) and Vitis vinifera (C). Preparations were stained by the picro aniline blue method to visualize fungal hyphae.
Figure 3.41: Trametes versicolor (A), Fomitiporia mediterranea (B) and Pheaomoniella chlamydospora (C) were incubated in PDA medium under aerobic conditions at 24 ºC for 8 days.
Figure 3.42: Trametes versicolor (A), Fomitiporia mediterranea (B), Pheaomoniella chlamydospora (C) were incubated in agar medium under aerobic conditions at 24 ºC for 8 days.
Figure 3.43: Trametes versicolor (A), Fomitiporia mediterranea (B) and Pheaomoniella chlamydospora (C) were incubated in Prunus dust medium under aerobic conditions at 24 ºC for 8 days.
Figure 3.44: Trametes versicolor (A), Fomitiporia mediterranea (B) and Pheaomoniella chlamydospora (C) were incubated in Prunus agar medium under aerobic conditions at 24 ºC for 8 days.
Figure 3.45: Trametes versicolor (A), Fomitiporia mediterranea (B) and Pheaomoniella chlamydospora (C) were incubated under aerobic in Prunus - conditions at 24 ºC for 8 days.
Figure 3.46: Trametes versicolor (A), Fomitiporia mediterranea (B) and Pheaomoniella chlamydospora (C) were incubated in Ficus dust medium under aerobic conditions at 24 ºC for 8 days.
Figure 3.47: Trametes versicolor (A), Fomitiporia mediterranea (B) and Pheaomoniella chlamydospora (C) were incubated in Ficus agar medium under aerobic conditions at 24 ºC for 8 days.
Figure 3.48: Trametes versicolor (A), Fomitiporia mediterranea (B) and Pheaomoniella chlamydospora (C) were incubated in Ficus - medium under aerobic conditions at 24 ºC for 8 days.
Figure 3.49: Trametes versicolor (A), Fomitiporia mediterranea (B) and Pheaomoniella chlamydospora (C) were incubated in Vitis dust medium under aerobic conditions at 24 ºC for 8 days.
Figure 3.50: Trametes versicolor (A), Fomitiporia mediterranea (B) and Pheaomoniella chlamydospora (C) were incubated in Vitis agar medium under aerobic conditions at 24 ºC for 8 days.
Figure 3.51: Trametes versicolor (A), Fomitiporia mediterranea (B) and Pheaomoniella chlamydospora (C) were incubated in Vitis - medium under aerobic conditions at 24 ºC for 8 days.
Figure 3.52: Growth rate expressed as the rate of increase of the colony diameter (mm day-1) of Trametes versicolor, at 24 ºC, after 4 days, under aerobic conditions, showing the respective standard deviation magnitude (n=12).
Figure 3.53: Growth rate expressed as the rate of increase of the colony diameter (mm day-1) of Trametes versicolor, at 24 ºC, after 8 days, under aerobic conditions, showing the respective standard deviation magnitude (n=12).
Figure 3.54: Growth rate expressed as the rate of increase of the colony diameter (mm day-1) of Fomitiporia mediterranea, at 24 ºC, after 4 days, under aerobic conditions, showing the respective standard deviation magnitude (n=12).
Figure 3.55: Growth rate expressed as the rate of increase of the colony diameter (mm day-1) of Fomitiporia mediterranea, at 24 ºC, after 8 days, under aerobic conditions, showing the respective standard deviation magnitude (n=12).
Figure 3.56: Growth rate expressed as the rate of increase of the colony diameter (mm day-1) of Pheaomoniella chlamydospora, at 24 ºC, after 4 days, under aerobic conditions, showing the respective standard deviation magnitude (n=12).
Figure 3.57: Growth rate expressed as the rate of increase of the colony diameter (mm day-1) of Pheaomoniella chlamydospora, at 24 ºC, after 8 days, under aerobic conditions, showing the respective standard deviation magnitude (n=12).
Figure 3.58: Avarage of the peripheral growth unit measured in µm of Trametes versicolor, at 24 ºC, after 48 h, under aerobic conditions, the respective standard deviation bars are indicated (n=45).
Figure 3.59: Avarage of the peripheral growth unit measured in µm of Fomitiporia meditrranea, at 24 ºC, after 72 h, under aerobic conditions, the respective standard deviation bars are indicated (n=45).
Figure 3.60: Avarage of the peripheral growth unit measured in µm of Pheaomoniella chlamydospora, at 24 ºC, after 72 h, under aerobic conditions, the respective standard deviation bars are indicated (n=45).
Figure 7.1: Cells of wood from Prunus spp (A), Ficus carica (B) and Vitis vinifera (C), which were degraded by Trametes versicolor. The cells were isolated by Jeffrey’s method, as described in the Methods section.
Figure 7.2: Cells of wood from Prunus spp (A), Ficus carica (B) and Vitis vinifera (C), which were degraded by Fomitiporia mediterranea. The cells were isolated by Jeffrey’s method, as described in the Methods section.
Figure 7.3: Cells of wood from Prunus spp (A), Ficus carica (B) and Vitis vinifera (C), which were degraded by Phaeomoniella chlamydospora. The cells were isolated by Jeffrey’s method, as described in the Methods section.
LIST OF ABBREVIATIONS
HO2· - hydroxyperoxyl radical
H2O2 - hydrogen peroxide
HSFs - heat-shock transcription factors Hsr - hypersensitive response
L - length between the inoculum and the terminal zone of the fungal colony
LRR - leucine-rich repeated domainMAMPs - microbe-associated molecular patterns
Mi - initial mass
Mf - final mass
N - number of measurements
NO - nitric oxidePDA - potato dextrose agar medium
PEG - polyethylene glycol
OH- - hydroxyl radical O. - singlet oxygen O2- - superoxide anion
O22- - peroxide ion
PAMPs - pathogen-associated molecular patterns ROS - reactive oxygen species
1. INTRODUCTION
Until the 1990s esca was considered a disease of old grapevines. At that time, studies began to point out that the some pathogens associated to esca were also responsible for the decline of young grapevines. Laura Mugnai suggested that esca might have originated at the time of ancient Greece and Roma, and that indeed it may be even older than vine cultivation itself. The disease is so complex that it is associated with many symptoms, some of which give their name to the disease in some regions of the world (Mugnai 1999).
The symptoms of esca disease can, in some cases, be very similar to those characteristic of other grapevine diseases, although they have different origins. Esca can manifest itself in spring, but this is something rare. Normally the external symptoms occur in summer between June and September, in the Northern Hemisphere (Surico et al., 2000). Further details on esca symptoms will be described in the next section.
Esca became a widespread concern in the 1990s, when arsenite was banned. Arsenite containing fungicides had been, until that time, the only known method for controlling esca. In this situation other less efficient products had to be used, which provided poor results. Esca has been detected in countries where viticulture is a well established agricultural practice and an important economic sector, such as Portugal, Italy, Spain, Germany, Greece, as well as California and the United States in general (Mugnai et al., 1999).
1.1. State-of-the-art on esca
Esca is a disease caused by one association of fungi that has been discovered at the end of the XIX century and has gained considerable interest throughout the XX century. It has been suggested that esca manifests itself in two stages. In the first stage, the plant woody tissues are sequentially colonized by a number of microorganisms, which lead to the formation of a central light-coloured soft necrosis. The first organisms to colonize are Phaeomoniella chlamydospora and Phaeoacremonium spp. In the second stage the wood is invaded by fungi from the genus Fomitiporia this can be fallowed by other species of fungus (Larignon & Dubos, 1997).
Two types of esca can be identified, the chronic type and the acute type. The chronic syndrome affects adult plants (more than 8-10 years of age), and is characterized by the occurrence of a white rot in the internal wood, which gradually changes to soft rot. This soft wood appears as a spongy material, which normally has a yellow or white colour delimited by a black or dark brown line (Baldacci et al., 1962). This line separates the degraded from the asymptomatic wood. Sometimes the rot reaches the external surface of the wood and creates fissures. Although the rot spreads along the trunk, it does not pass the graft union,
nor does it not affect the root system. Despite this, American grapevines and Euro-American hybrids are not immune to esca, because the same symptoms may develop in ungrafted vines of either type (Mugnai et al., 1999).
The leaf may develop symptoms which consist of chlorotic rounded or irregular spots between veins. These chlorotic spots grow and with time become necrotic, leaving only part of living tissue along the veins. Consequently, the affected tissue becomes yellow-brown and/or red-brown. In this situation leaves assume the typical “tiger-stripes” pattern (Mugnai et al., 1999), which is commonly reported in association with the disease. Although the real cause of this characteristic pattern remains unknown, it is possible that this symptom is caused by reduced hydraulic conductivity in the xylem. However, it is worth of consideration that even if the xylem is partially blocked, this would not fully explain the symptoms observed in the leaves. Normally, the functional wood is not affected in terms of water transport. Furthermore, even a partial blockage could not inhibit the functionality of such a complex water translocation system such as the xylem. The change in water potential associated to cavitation may affect grape production. However, it is likely that the substances that cause the degradation of wood are translocated to the leaves where they can induce the necrosis observed in the leaf tissues (Sparapano et al., 1998).
The grape symptoms include dark brown spots, which can vary to a violet or purple colour. The grapes dry and are easily attacked by fungi and bacteria. These symptoms may appear in isolated grapes or can affect all the grapes of a plant. The origin of such symptoms may be related to the occurrence of enzymes associated with the pathogen, or more probably, to the effect of toxins produced by the fungi in the wood, and then transported to leaves and berries (Sparapano et al., 1998; Mugnai et al., 1999). In young plants (less than 8 to 10 years old) esca is usually associated with limited wood discoloration. White rot in young vines is rare and this symptom is generally associated with older plants. The white colour is caused by physical and chemical changes in the wood, including:
1)
Physical and chemical alterations caused by the introduction of air and water through wounds into the wood, as well as host reactions that induce degradation or oxidation of wood components (Baldacci et al., 1962).2) Lignolytic and cellulolytic enzymes produced by the fungi (Chiarappa, 1959).
3)
Induction of tylose synthesis, segregation of gums by diseased tissues, production of high-molecular weigh compounds by fungi, and necrosis induced by fungal toxins or by chemical defences of the plant (Sparapano et al., 1998).In the acute syndrome, also known as apoplexy, the vine dies within a few days. This generally takes place in summer, when the weather is very hot, especially after a rain event.
It may be that under these conditions, the concentration of toxic compounds rapidly rises within the plant, whereby the elevated level of transpiration facilitates a rapid translocation of these compounds to the leaves and berries (Bruno et al., 2007).
1.2. Fungal attack and plant defences
1.2.1. Saprophytic vs. pathogenic fungal interactions
Saprophytic fungi interact with the plant in a different way from that of pathogenic fungi. The hyphae of pathogenic fungi penetrate the cell wall of plants by means of the formation of an appressorium and a penetration peg. Consequently, the point of penetration becomes almost indistinct in the initial phases. Then the fungus degrades the cell wall, and penetrates inside the cell. At the point of penetration a clear strangulation of the hyphae occurs. At the same time, the cytoplasm moves in the direction of the hyphae. This was evidenced by the movement of mitochondria, endoplasmic reticulum and polyribosomes. However, this may be associated with other alterations in the plant metabolism (Beswettherick and Bishop, 1993).
The hypha of saprophyte fungi secretes pectinolytic enzymes and organic acids. These enzymes and acids degrade the pectin substances of middle lamella. As a result the cell loses the cohesion to the surrounding tissue, and the area becomes soft. The fungi also release cellulases that break down the cell wall, disintegrating the cell. The mycelia do not invade the cells, rather they live on substances liberated from the dead cells (Agrios, 2004).
Plants can initiate the cascade of biochemical events associated with defence mechanisms, by detecting specific pathogen-related substances known as elicitors. Elicitors can originate in the pathogenic fungus (exogenous elicitors), or in the plant itself (endogenous elicitors), which may have experienced alterations in their biochemical composition because of the pathogen. These include, for example, low molecular weight compounds deriving from plant cell wall degradation. However, endogenous elicitors are often associated with viral and bacterial interactions. The plant receptors for fungal elicitors are generally located in the plasma membrane. Some elicitors are pathogen-specific or plant-specific and are encoded by avr genes. Normally the presence of elicitors is associated with a hypersensitive response (hsr). As an example, botrycin and cinerein isolated from Botrytis cinerea, cause the formation of necrotic lesions and a typical hsr. These elicitors in leaves activate MAP kinases, induce the transcription of genes encoding enzymes involved in the phenylpropanoid pathway, and induce the ion influxes across the plasma membrane and production of reactive oxygen species (ROS) (Nürnberger, 1999).
Fungi have also developed mechanisms of host recognition. Obligate pathogens can only infect one species, or a selected small group of closely related species. In this way they had to develop finely tuned mechanisms of recognition which include for example
recognition of the defence mechanisms of the plant, which triggers the activation of genes necessary for pathogenicity. Other signals such as hydrophobicity, biochemical composition and hardness of the surface also play an important role in host recognition (Tyler, 2002).
Plants possess a wide array of proteins which play a crucial role in pathogen recognition. Recognition can take place via binding of pathogen-specific molecules, hence for example the leucine-rich repeated domain (LRR) of some proteins. In some cases the protein is located in the membrane, with the LRR domain oriented towards the extracellular zone. In this case, the protein recognises microbe-associated molecular patterns (MAMPs) and pathogen-associated molecular patterns (PAMPs) (Nürnberger and Kemmerling, 2006). However, in most cases, the LRR domain is located intracellularly and identifies subtle perturbations inside the cell. Examples of perturbations inside cells include the presence of microbial compounds and the presence of cytochrome c outside mitochondria (Leipe et al., 2004). In many cases LRR domains are coupled with a nucleotide binding domain. Although these domains are very similar, it is believed that they have different origins. Even in animals, LRR domains are fused with binding nucleotide domains and serve to detect pathogens (Rairdan and Moffett, 2007). The LRR domain is constituted by a peptide motif that presents the following sequence pattern: LxxLxxLxLxxNxLxGxIPxxLGx (L, leucine; N, asparagine; G, glycine; I, isoleucine; P, proline, x, any amino acid) (Kajava, 1998).
Indent plant molecules that are recognised by R proteins are known as effectors. Among the substances that are known to interact with the LRR domain are chaperones and co-chaperones (Bieri et al., 2004; Azevedo et al., 2006). It has been suggested that these molecules play a role in folding the LRR domain. Nevertheless, the regulation of these proteins remains poorly understood. It has been suggested that when an R protein detects its corresponding effector, it binds to a nuclear protein and affects the activity (positively or negatively) of transcription factors that regulate the expression of defence genes (Tameling and Takken, 2008)
A further defence mechanism in plants relies on the production of ROS. ROS are highly reactive molecules or ions which originate from oxygen. The most common ROS are singlet oxygen (O.), superoxide anion (O
2-), hydrogen peroxide (H2O2), hydroxyl radical (OH-),
hydroxyperoxyl radical (HO2·) and nitric oxide (NO). ROS are highly reactive and can be
used against fungi. Generally, avirulent pathogens induce ROS accumulation in plants. The first step of ROS accumulation is the transient accumulation of small amounts of ROS. The second stage is a more intense and continuous phase of accumulation (Lamb and Dixon 1997). Virulent pathogens normally cause only the first step of ROS accumulation. It is thought that this type of parasites suppress the system of plant recognition (Torres et al., 2006).
ROS can be produced by different plant organelles according to the type of stress being experienced. In the cell, ROS-producing organelles include chloroplasts (Kariola et al., 2005), peroxisomes (Kużniak and Skłodowska, 2005) and mitochondria (Amirsadeghi et al., 2007). ROS, especially H2O2, act like anti-microbial agents (Walters, 2003; Custers et al.,
2004). Several in vitro studies, performed with different concentrations of H2O2, indicate that
ROS inhibit the growth of several phytophatogenic bacteria and prevent the germination of fungal spores (Peng and Kuc, 1992; Wu et al., 1995). It remains unclear if ROS affect fungi and other microbes because of their toxicity and/or if they exhibit some function on the activation of defence genes in the plant (Shetty et al., 2008). ROS are also toxic for plants and high levels can cause damage and cell death. The production of ROS is therefore regulated so that in normal situations plants do not suffer oxidative stress (Levine et al., 1994).
ROS are involved in every signalling pathway for defence mechanisms, such as the hypersensitive response, accumulation of phytoalexins, and other genes involved in defence responses. It was been suggested that plants sense ROS by three different mechanisms: (i) unidentified receptor proteins, (ii) redox-sensitive transcription factors or heat-shock transcription factors (HSFs), and (iii) direct inhibition of phosphatase. Although ROS signalisation has been widely studied, the process remains poorly understood (Neill et al., 2002; Mittler et al., 2004).
After pathogen attempted infection, the plant responds with a hypersensitive response, with gene defence expression, or with both. This response is mediated by changes in the ion flux, protein phosphorylation and oxidative burst (Chandra et al., 1996; Jabs et al., 1997; Sasabe et al., 2000). The plant starts with the changes in ion fluxes, creating one influx of Ca2+ and H+ and one efflux of K+ and Cl- (McDowell and Dangl, 2000). This type of flux
generates an extracellular production of ROS.
1.2.2. Rot fungi
There are three basic types of wood decay, white-rot, brown-rot and soft-rot (Eaton and Hale, 1993). The white-rot degrades lignin and hemicelluloses on first place, on a second phase they degrade to the cellulose. Some white-rot fungi degrade all compounds at the same time. The oxidation of lignin creates a white colour on the wood. These fungi are the only microbes known which can degrade and mineralize lignin efficiently. Of these fungi the best characterized is Phanerochaete chrysosporium. There are many enzymes identified for this species that have been related with the degradation of wood, such as laccase, lignin peroxidase, manganese peroxidase and cellobiose dehydrogenase (Hatakka, 1994). The majority of these fungi are basidiomycetes, and a minor part are ascomycetes (Risna and Suhirman, 2002; Urairuj et al., 2003).
The brown-rot fungi degrade cellulose and hemicelluloses by non-enzymatic oxidation, they also use cellulases and glucanases. Lignin suffers little degradation (Bucher et al., 2004).
The soft-rot fungi make a superficial decay where polysaccharides and lignin are degraded. This type of rot is common in ascomycetes, bacteria wood decay also have this type of degradation (Bucher et al., 2004).
1.3. Wood
1.3.1. Wood composition and enzymatic degradation
Wood is composed of cellulose, lignin and hemicelluloses, which are the principal components. Pectin is also a wood component, which is limited to the interface between separate cells, where the cell walls of distinct cells touch. This is also known as the middle lamella. Cellulose, hemicelluloses and lignin are more widespread and are found across the plant cell walls.
Lignin is a polyphenolic compound that is responsible for the hardness of wood and is resistant to biological attack. In the secondary cell wall, lignin (with hemicelluloses) envelops the fibrils of cellulose, and protects it against degradation. This polymer is highly concentrated in the middle lamella together with pectin, and is also abundant in the cell wall, mainly in the secondary cell wall. Lignin is a compound which is very resistant to degradation, as each lignin molecule is a unique, complex molecule, requiring the availability of specialized biochemical tools able to oxidize the phenolic part of lignin. For this reason, only some microorganisms are capable of decomposing lignin. It is estimated that about 500 fungal species have been identified that can effectively use lignin as a growth substrate (Agrios, 1997).
Cellulose represents nearly 50% of the wood mass. Cellulose is a linear polymer of glucose molecules organised in a linear β-1,4 structure. It is generally organised in microfibrils, although sometimes it assumes a crystalline form. In the secondary cell wall, lignin and hemicelluloses envelop the fibrils of cellulose, and protect it against degradation (Martínez et al., 2005).
Hemicelluloses have an intermediate degree of complexity between lignin and cellulose and are constituted by residues of pentoses and hexoses. Other compounds of the wood are phenols and tannins, as well as fats, sugars and proteins. This kind of chemicals represents 5 to 20% of the dry mass of wood (Martínez et al., 2005).
The main wood components are degraded by substances like oxalic acid, mycotoxins and other organic acids, which during the initial steps of decay attack hemicelluloses (Punja, 2001), thus opening up the wood matrix and allowing the translocation and action of cellulolytic and lignolytic enzymes, such as cellulase, glucanase (cellulose), lignin
peroxidase and laccase (lignin). Whilst it is widely accepted that cellulolytic and lignolytic enzymes play a key role in wood decay, the role of these enzymes in plant wood diseases such as esca in grapevine, remains to be fully understood (Punja, 2001).
1.3.2 Wood analysis other techniques Histology
Microscopy studies are a very powerful tool, allowing the examination of wood structure and the discrimination of specific biochemical components through the use of ad hoc hystological techniques.
Among these techniques, safranin and fast green allow distinguishing the more lignified portions of wood that are coloured red, from the less lignified portions that are coloured green. Even in advanced stages of wood degradation the differences are still visible (Jensen, 1962).
Azure B is another technique that colours lignin, but also nucleic acids. The stained tissues present a blue-green coloration (Jensen, 1962).
The presence of cellulose can be determined by the technique of the zinc-chlor-iodide. However, this technique can distort the section of wood in association with phloroglucinol technique the middle lamella appears red and the secondary walls become bluish (Vaughan, 1914).
The technique of iodine-potassium iodide colours starch in dark blue and black (Jensen, 1962).
Mass loss
Fungi can cause loss of wood mass. During wood degradation, cellulose, lignin and others compounds are hydrolyzed and utilized by the fungi. The wood can be colonized by fungi and subjected to degradation. After a period of time, it is possible to measure the loss of mass, by comparing the initial mass and the final mass of the wood (Bucher et al., 2004).
1.4. Fungal growth under aerobic or anaerobic conditions
The oxygen status inside grapevine wood is unknown. It is not known if esca fungi can grow under anoxic or hypoxic conditions. It has been suggested that in general, fungi need oxygen for spore germination and hyphae growth and that the absence of O2 inhibits
germination (Yang and Lukas, 1070; Subíková and Subík, 1974). Fungi use oxygen as a final acceptor of electrons not only in the respiratory pathway, but also in some other essential biosynthetic reactions independent of oxidative phosphorylation (Heslot and Goffeau, 1970). For example, yeast does not require oxygen during fermentation, but needs O2 to live (Kellerman et al., 1969). Whether there is any type of growth in esca fungi in the
absence or in the presence of low concentrations of O2 remains unknown; yet, this factor
may have some influence on the infection of grapevine.
1.5. Interactions among fungi and importance of ROS
In nature fungi interact with other organisms, including other fungi. Since esca is a disease caused by the association of different fungi, the interactions occurring during esca have attracted attention in the literature (Freitas et al., 2008). Interactions among fungi can assume three forms, mutualistic, neutralistic and competitive (Rayner and Todd, 1979). The secondary metabolites produced by fungi during interactions are very important, as they can act as inhibitors or stimulators of the mycelial growth in other fungi (Heilmann-Clausen and Boddy, 2005). In grapevine, fungi that are in competition form zone lines, or barrage zones, in which none of the fungi can overgrow (Boddy, 2000).
It has been observed that the interaction between Botryosphaeria obtusa and Eutypa lata gives origin to O-methylmellein and its hydroxylated forms. These compounds do not appear in pure cultures and are only produced during fungal interactions (Glauser et al., 2009). O-Methylmellein displays antifungal activity against some fungi (in this case, it is toxic to B. obtusa) and is also phytotoxic. However, the hydroxylated forms of this compound are only toxic to plants, and do not present antifungal activity.
During interactions of different organisms, ROS can be produced, which play a role in the recognition of invaders (Torres et al., 2002; Vignais, 2002). In fungi, this production of ROS has also been described (Silar, 2005). Interacting fungi produce a pattern of ROS different from that of isolated cultures. In the study of Silar (2005), many fungi were capable of self-recognition, whilst some filamentous fungi can recognize other filamentous fungi, yeasts (only in some cases), bacteria, and wood. However none of the fungi studied reacted to the presence of dead fungi, or inert material like plastic or glass (Silar, 2005). Thus, the most prominent variation in ROS production was detected in interactions between different filamentous fungi, although other compounds may also play a role during these interactions. Fungi use ROS not only to recognise other fungi, but also to initiate wood digestion and to disrupt lignin and cellulose. Enzymes cannot penetrate wood in the beginning, so digestion is started by ROS, like OH● (Hammel et al., 2002).
Fungal NADPH oxidases (Lalucque and Silar, 2003), peroxidases like lignin peroxidase (Hofrichter et al., 1998), and laccases (Thurston, 1994; Mayer and Staples, 2002) are involved in ROS activity. NADPH oxidases produce O2-, as was evidenced by in vitro
experiments, but in vivo the radical most frequently generated is peroxide ion (O22-) (Sagi
and Fluhr, 2001). Other enzymes produce hydrogen peroxide (H2O2) for the activity of the
peroxidases, like aryl alcohol oxidase or glyoxal oxidase. However, these enzymes do not participate directly in wood digestion, but only provide the ROS (Leonowicz et al., 2001).
Lignin peroxidase needs H2O2 to be active. This enzyme catalyzes several reactions like the
oxidation of alkyl side-chains of lignin compounds, C-C cleavages in the side chains of lignin subunits, oxidation of veratryl alcohol to aldehydes and ketones, cleavage of phenylglycol structures and hydroxylation of benzylic methylene groups (Tien and Kirk, 1983). Laccases can oxidase a variety of aromatic compounds by using them as electron and proton donors (Agematu et al., 1993).
It has been suggested that the fungi F. mediterranea, P. chlamydospora and Togninia minima (three esca fungi) use laccases, peroxidases and tannases to detoxify antimicrobial substances produced by grapevine, giving competive advantage to the fungus with the best ability to detoxify them (Bruno and Sparapano, 2006).
Esca is causing considerable damage to vineyards and economical losses to wine producers. In order to control the spread of the disease, it is important to understand the mode of action of the esca fungi, as well as to understand the corresponding resistance mechanisms in grapevine.
This study focused on Phaeomoniella chlamydospora, which is probably the first fungus to invade grapevine (Valtaud et al., 2009) and Fomitiporia mediterranea, since the genus Fomitiporia has consistently been associated with the occurrence of esca (Graniti et al., 2000). Different Fomitiporia species occur according to the geographic distribution of the disease. In Portugal F. mediterranea is the most recurrent species. The control fungus utilized in the present work was Trametes versicolor, which was used as a model organism for white-rot wood decaying fungi (Leonowicz et al., 2001). Vitis vinifera was used as their wood substrate together with Ficus carica and Prunus spp. acting as controls, since all these wood species have similar densities.
2. MATERIALS AND METHODS
2.1 Fungal culturesThe fungal species used in this study were Trametes versicolor, Fomitiporia mediterranea, and Phaeomoniella chlamydospora. T. versicolor was obtained from Dr. Lina Nunes at Laboratório Nacional de Engenharia Civil, Lisbon, Portugal, whilst F. mediterranea and P. chlamydospora were isolated from infected grapevine materials. All cultures were maintained at the Laboratório de Patologia Vegetal “Veríssimo da Almeida” of Instituto Superior de Agronomia, Lisbon, Portugal. The fungal cultures were grown on autoclaved potato dextrose agar medium (PDA), at 3.9% (w/v).
2.2 Wood material
The samples of wood used were from Prunus, Ficus carica and Vitis vinifera. The wood was cut in blocks of 30x10x5 mm for tests of degradation. In other tests, wood was made into a powder using a Wiley mill equipped with a mesh 40 screen.
2.3 Tests on anaerobiosis
Plates containing 20 ml of PDA were inoculated with mycelial plugs removed from the margin of actively growing colonies of the fungi under study. Each fungus was inoculated in triplicate, for each condition. Inoculated plates for each fungal species were placed under sterile conditions either inside an anaerobic assay container, on the container a producer of CO2 and a O2 indicator were put, a pink colour on the indicator indicates the presence of
oxygen, the colour white indicate the consummation of all oxygen. The control plates were maintained at ambient atmosphere as a control. All plates were incubated at both 15 and 24 ºC for up to 28 days. At the end of this period, fungal cultures kept under anaerobic conditions were exposed to ambient atmosphere and allowed to grow, at the same temperature, for up to 31 days. Radial growth rate was then calculated and four measurements were recorded for each plate at 90 degree intervals every four days.
2.4 Analyses of reactive oxygen species
The presence of reactive oxygen species (ROS) was analysed for each of the three fungal species under study, either isolated or during fungal-fungal interactions, according to the method of Freitas (Freitas et al., 2008). The following interactions were evaluated: T. versicolor versus F. mediterranea, T. versicolor versus P. chlamydospora and F. mediterranea versus P. chlamydospora. Upon the fungal mycelia coming into contact with each other, 5 ml of ROS detection reagent was placed on each plate (including the controls)
and the solution was spread with a sterile glass spreader. Plates were incubated for 30 min, after which the solution was removed and the plates incubated for further 24 h to allow for colour development. For the detection of superoxide a reagent was used containing 2.5 mM of nitrobluetetrazolium and 5 mM of N-morpholinopropanesulphanate-NaOH at pH 7.6.
For the detection of hydrogen peroxide, a reagent was used containing 2.5 mM of diaminobenzidine and 5 units of purpurogallin per ml in 100 mM of potassium phosphate buffer at pH 6.9.
2.5 Tests of wood degradation
The blocks of wood where dried at 80 ºC for 24 h, by which time constant weight was achieved. The mass of the blocks was measured and blocks were then sterilised at the Instituto de Tecnologia Nuclear by gamma radiation to 0.5 Mrad total exposure, according to EN 113 method (Leithoff, 2010). Four sterile plastic rings were placed on plates with PDA at 3.9% (w/v) for support. The plates were then inoculated with each of the test fungi. Upon the mycelium reaching the plastic supports (3 to 5 days post-inoculation), the sterilised wood blocks were placed over the rings. Plates were incubated at 24 ºC for up to 38 days. Upon harvesting the blocks, the mycelium was separated from the wood blocks by gently scraping the surface with a scalpel. The blocks were then dried for 24 h at 80 ºC. The mass of the blocks was then measured, and differences in mass were registered (Vesentini et al., 2006a). The blocks were observed under a stereomicroscope for a preliminary assessment of the damage caused by the fungi.
To observe damage in individual cells a technique of dissociation of cells was used to separate individual wood cells. Small wood shavings were placed in test-tubes containing 4 ml 1:1 (v/v) acetic acid and hydrogen peroxide. The test-tubes were topped covered with tin foil, and incubated at 60 ºC during 24 h. After that time wood solids were removed with a sieve and washed with water. Isolated wood cells were collected carefully with a pair of tweezers and placed in test-tubes with ethanol 70% (v/v). The material was then mounted in water and observed under an optical microscope, according to the Jeffrey’s method (Johansen, 1940).
To observe the damage occurring at tissue level, the blocks were embedded in polyethylene glycol (PEG). PEG must previously melt at 60 ºC in an incubator with ventilation. For each individual block, 20 ml of PEG where placed in plastic cups, then 80 ml of distilled water were added and the wood blocks where placed in the cups. The cups were incubated at 60 ºC until the water evaporated. At this stage, the PEG was removed, and replaced with new PEG, so as to cover the wood. The cups were returned to the incubator for an additional 2 h. After this time, the cups containing the samples were removed from the incubator and stored in a cool dry place, but not in a refrigerator. The wood was centred and
the PEG was allowed to solidify during 24 h. Wood sections (25 µm thick) were cut in a sledge microtome from both transversal and longitudinal surfaces and then observed under an optical microscope. Four different methods where used to assess the fungal-induced damage; control (natural wood), method of phloroglucinol-HCl (lignin stain), method of methylene blue (fungal hyphae stain) and method of picroaniline blue (cellulose stain).
The observation of natural wood was made with the wood samples in distilled water. In the method of phloroglucinol-HCl, the sample was placed in the phloroglucinol acid solution for 5 min. After that time, the wood was placed on a glass cover slide and mounted in 6 M HCl (Clifford, 1974).
In the method of methylene blue, the sample was stained in methylene blue 0.1% (w/v) for 15 min. Then the sample was washed with distilled water and water-mounted (Stevens, 1924).
In the method of picroaniline blue, the stock solution must be prepared previously. A 1% (w/v) stock solution of saffranine was prepared. To prepare picroaniline blue solution, 25 ml of saturated aqueous aniline blue were added to 100 ml of saturated aqueous picric acid. The wood samples were stained for 2 min in the saffranine solution, which was prepared with 3 drops of saffranine stock solution in 10 ml of distilled water. The wood sample was then washed in distilled water and placed in a solution of picroaniline blue, which was prepared by adding 5 drops of picroaniline blue stock solution to 10 ml of distilled water. At this stage, the sample in the picro aniline blue solution was heated until the stain began to steam slightly. The wood sample was then washed in distilled water and water-mounted for observation according to the method of Cartwrigth (1929).
2.6 Tests of fungal development on different media
Different media containing wood-derived substrates were prepared to test the development of the fungal species under study. All tests were performed in triplicate in sterile media, and the conditions tested included:
- Tap water containing agar 1.5% (w/v); - PDA at 3.9 % (w/v);
- Distilled water, 20 g of pulverised wood (per plate) and 1.5% (w/v) of agar; - Wood broth containing agar 1.5% (w/v);
- Distilled water, 20 g (per plate) of pulverised wood used to create the wood broth and 1.5% (w/v) agar.
The broth wood was created incubating by one hour the pulverised wood in distilled water at the concentration of 1 g.ml-1.
The media thus prepared were dispensed in 90 mm Petri dishes (20 ml), which were then incubated at 24 ºC. The radial growth of fungi was measured (four measurements per plate) after 96 h and 192 h. The rate of growth per day was then calculated.
To observe hyphal growth and morphology, three sterile squares of cellophane were placed on each of three plates containing the growth media described previously. Fungi were inoculated on the cellophane and were maintained at 24 ºC. The hyphae of T. versicolor were observed after 42 h, whereas those of F. mediterranea and P. chlamydospora were observed after 72 h under a microscope. For observation, individual cellophane squares were placed on a microscope slide, the inoculation plug was removed and the slides were covered by a coverslip. Measurements of hyphae were made using the appropriate Leica program. The length of 45 hyphae was assessed from the tip backwards to at least the second ramification. The total length, including the length of any side branches, was then divided by the number of branches to provide information about the peripheral growth unit (PGU) length, which is indicative of changes in hyphal morphology (Vesentini et al., 2006b).
2.7 Statistical analysis
The daily rate of growth (see section 2.3) was calculated as: Rate of grown = ∑((L / Δt)*24)
n Where:
L - is the length between the inoculum and the terminal zone of the fungal colony Δt – is the time of growth in hours
n – is the number of measurements
Changes in radial growth on different growth media and during anaerobiotic growth were evaluated. Putative differences of growth where then analysed using Anova. The comparisons were made among fungal colonies of the same species. The different analyses were made to detect differences among presence of O2, absence of O2 and phase
post-anaerobiosis. For fungi that grew on different media (see section 2.6), the same formula was used to calculate the daily growth rate, and calculations were done for the fourth and eighth days.
The percentage of wood loss was calculated using the formula
Loss wood (%) = ∑((mi-mf)/mi)*100
Where:
mi – is the initial mass
mf – is the final mass
n – is the number of measurements
Variations in hyphal morphology were analysed by Anova. The average and standard deviation of the hyphae length was calculated, to register putative differences in fungal development.
3. RESULTS
3.1. Effect of oxygen availability and temperature on fungal growth rate
All fungal species under analysis, Trametes versicolor, Fomitiporia mediterranea, and Phaeomoniella chlamydospora, achieved visible growth in Petri dishes containing PDA medium under aerobic conditions. However, the fungi exposed to anaerobic conditions were unable to grow, until oxygen deprivation had stopped. When oxygen was made available, growth resumed in a fashion comparable to that of the control cultures.
In Figures 3.1, 3.2, 3.3, 3.4 and 3.5, the morphological characteristics of the fungal colonies incubated under aerobic, anaerobic and aerobic post-anaerobic conditions are shown. Apart from differences in the growth rate, no other visible differences were detected in the fungi. During anaerobic growth, at both temperatures tested (15 and 24 ºC) no growth was detected among the three fungal species under analysis.
Trametes versicolor was overall the fastest growing fungus, whilst Phaeomoniella chlamydospora was the slowest one.
In Figure 3.6 it is possible to observe the effect of temperature on fungal growth under aerobic conditions versus anaerobic conditions. At 15 ºC T. versicolor grew at a rate of 3.598 mm day-1 and under aerobic post-anaerobic conditions at a rate of 2.928 mm day-1.
The p-value is 2.32x10⁻⁸ meaning that this difference is significant. As observed before, no
growth was detected under anaerobic conditions. At 24 ºC, under aerobic conditions, the growth rate was 6 mm day-1, whilst in aerobic post-anaerobic conditions was 6.167 mm day -1. The respective p-value is 0.089584, meaning that this difference is not statistically
significant. Although T. versicolor grew at a reduced rate at 15 ºC following exposure to anaerobic conditions, this did not occur at 24 ºC, where no significant difference in the rate of growth was observed in relation to the control.
0 1 2 3 4 5 6 7 15 ºC 24 ºC Temperature (ºC) G ro w th r at e (m m d ay -1)
Figure 3.6: Growth rate expressed as the rate of increase of the colony diameter (mm day-1) of
Trametes versicolor, at 15 and 24 ºC, under aerobic conditions (Blue), under anaerobic conditions
(Red) and under aerobic post-anaerobic phase (Yellow), with the respective standard deviation values.
Figure 3.7 shows the rate of growth of F. mediterranea at 15 ºC under aerobic conditions versus anaerobic. Under these conditions, the rate of growth was 0.491 mm day-1, whilst
under aerobic post-anaerobic conditions fungal growth was 0.634 mm day-1. The p-value is
0.01342, indicating that this difference in growth is significant. At 24 ºC under aerobiotic conditions, F. mediterranea grew 2.101 mm day-1, whilst aerobic post-anaerobic growth
attained 2.658 mm day-1; the p-value is 2.9x10⁻⁷, meaning that this difference is significant.
Overall, F. mediterranea grew faster at both temperatures tested, following a previous exposure to anaerobiosis. 0 0.5 1 1.5 2 2.5 3 3.5 15 ºC 24 ºC Temperature (ºC) G ro w th r at e (m m d ay -1 )
Figure 3.7: Growth rate expressed as the rate of increase of the colony diameter (mm day-1) of
Fomitiporia mediterranea, at 15 and 24 ºC, under aerobic conditions (Blue), under anaerobic
conditions (Red) and under aerobic post-anaerobic conditions phase (Yellow), with the respective standard deviation values.
Figure 3.8 shows the rate of growth of P. chlamydospora in the presence and absence of oxygen. At 15 ºC, under aerobic conditions, the fungus attained a growth rate of 0.25 mm day-1, whilst in aerobic post-anaerobic growth a rate of 0.253 mm day-1 was observed. The