(Annals of the Brazilian Academy of Sciences) ISSN 0001-3765
www.scielo.br/aabc
Efficiency of boron application in an Oxisol cultivated
with banana in the Central Amazon
ADÔNIS MOREIRA1, CÉSAR DE CASTRO2 and NAND K. FAGERIA3 1Embrapa Amazônia Ocidental, Caixa Postal 319, 69010-970 Manaus, AM, Brasil
2Embrapa Soja, Caixa Postal 231, 86001-970 Londrina, PR, Brasil
3Embrapa Arroz e Feijão, Caixa Postal 179, 75375-000 Santo Antônio de Goiás, GO, Brasil
Manuscript received on July 30, 2008; accepted for publication on September 24, 2010
ABSTRACT
In the Amazon region, there is no information on the fertilization of banana plants with boron (B). Besides this, the extractant (hot water) currently used to test B concentrations has many limitations. The aim of this work was to study the effect of B on the fruit yield and quality of banana plants of the Cavendish (AAA) sub-group, grown in dystrophic Yellow Latosol (Oxisol or Xanthic Ferralsol), in the Amazonas State, Brazil. The experimental design was completely randomized split plot in a 4×2 factorial scheme, composed of four B rates (0, 4, 8 and 12 kg ha−1) and two harvest cycles (sub-treatments), with four replicates. The B availability in the soil was determined by three extractants: Mehlich 3, hot water and KCl 1.0 mol L−1. The application of B influences the fruit yield, pulp/peel ratio, pulp resistance and B content in the leaves and fruits. The KCl 1.0 mol L−1extractant was similar to the hot water in the evaluation of available B. To obtain maximum yield, it is necessary to apply 4.1 and 6.1 kg ha−1of B in the first and second cycles, respectively.
Key words:Musaspp., yield, methods of soil analysis, post-harvest.
INTRODUCTION
Banana growing is among the agricultural activities in Brazil with the greatest economic importance and social range. Statistics indicate annual yield of some 7.1 mil-lion tonnes (metric tons), putting Brazil only behind the Philippines (7.5 million) and India (21.8 million). The cultivated area (540 thousand hectares) is even greater than in these countries, but the productivity is lower (FAOSTAT 2008).
In the Amazon region, banana plants were previ-ously grown mainly in lowland areas, but with the in-creased infestation by diseases such as moko, or bac-terial banana wilt (caused byRalstonia solanacearum), and the arrival of black sigatoka (caused by
Mycospha-rella fijiensis) in the region in 1998 (Gasparotto et al.
Correspondence to: Adônis Moreira E-mail: [email protected]
2002), cultivation has largely migrated to areas of higher ground, with little influence of floods, locally called “várzea alta” (“high marshland”) and “terra fir-me” (“upland soil”), respectively. The soils of these eco-systems are mostly less fertile and poorer in nutrients, with high acidity, low base sum and H++Al3+
predom-inating in the soil exchange complex (Moreira and Fa-geria 2009a). Therefore, the switch to these areas has lowered the banana yield.
plants (Silva et al. 1999). When there is a lack of B, the entire plant growth is halted, negatively affecting fruit yield (Loué 1993).
In Brazil, at the laboratories of soil fertility, the de-termination of available B is made in hot water solution (Berger and Truog 1939, Abreu et al. 2001), but other extractants were proposed due to the extraction of other elements as Mehlich 3 (Mehlich 1984) and KCl 1.0 mol L−1 (Moreira and Castro 2006). Concerning the acid extractant (Melich 3), that it extracts significant amounts of Fe in soil, and this can interfere in the determination of available B in soil, which hinders its interpretation (Ferreira et al. 2001).
The objective of this work was to investigate the ef-fect of B rates on the yield (first and second cycles) and fruit quality of banana plants (Nanicão 2001 – triploid AAA of the Cavendish sub-group) cultivated in a dys-trophic Yellow Latosol – Oxisol (40% of the soil in the Amazon region), and to evaluate the leaf and fruit con-tent, associating them with the availability of B from the soil obtained by three extractants: hot water, Mehlich 3 and KCl 1.0 mol L−1.
MATERIALS AND METHODS
The experiment was conducted between April 2002 and December 2003, in the experimental field of Embrapa Western Amazon (CPAA), located at the geographic coordinates 3◦8′S and 59◦52′W, in the municipality of
Manaus, Amazonas State, Brazil.
The predominant climate in the region is moist tropical, classified as Afi on the Köppen scale, with rel-atively abundant rainfall throughout the year (average of 2,250 mm) and high relative humidity. Precipitation in the driest months is always above 60 mm, and the dry season lasts under two months. Average annual temper-ature (day and night) is about 26◦C (Vieira and Santos
1987).
Due to the homogeneity of the soil, we used an en-tirely randomized experimental split plot design in a 4×2 factorial scheme, with four replicates. The treatments consisted of rates of 0, 4, 8 and 12 kg ha−1of B [boric
around the daughter plant (broadcast). Each plot was composed of five clumps plants.
The soil in the experimental area is a dystrophic Yellow Latosol (Oxisol) – Brazilian classification (Em-brapa 1999), or Xanthic Ferralsol (FAO 1990), repre-senting 2.0 million of km2of total area in the Amazon region, and composed of 719.0 g kg−1of clay, with the following chemical attributes: pH (water) = 4.3; organic matter (OM) = 46.92 g kg−1; P (Mehlich 1 – 0,025 mol L−1 H
2SO4 + 0,05 mol L−1 HCl) = 2.91 mg dm−3; P (resin) = 9.83 mg dm−3; P (Mehlich 3) = 1.82 mg dm−3; K (Mehlich 1) = 47.70 mg dm−3; Ca (KCl 1.0 mol L−1) = 0.22 cmol
cdm−3; Mg (KCl 1.0 mol L−1) =
0.10 cmolc dm−3; Al (KCl 1.0 mol L−1) = 1.51 cmolc
dm−3; H+Al (SMP buffer) = 8.02 cmol
cdm−3; B (hot
water) = 0.31 mg dm−3; Cu (Mehlich 1) = 0.29 mg dm−3; Fe (Mehlich 1) = 333.10 mg dm−3; Mn (Mehlich 1) = 5.15 mg dm−3; and Zn (Mehlich 1) = 0.68 mg dm−3. The analyses were performed according to the proce-dures described in Embrapa (1997) and Moreira et al. (2004).
The planting holes (60 cm×60 cm×60 cm) were prepared 30 days before the application of limestone and, after planting, they were filled with five liters of powdered chicken manure and 400.0 grams of dolomi-tic limestone [effective calcium carbonate (ECC) = 78%] (Moreira et al. 2005b). Before the seedlings were planted, 300.0 grams of simple superphosphate (20% P2O5), 5.0 grams of copper sulfate (13% Cu), 20.0 grams of iron sulfate (19% Fe), 5.0 grams of mangan-ese sulfate (26% Mn) and 30.0 grams of zinc sulfate (20% Zn) were placed in each hole. The spacing was three meters among rows and two meters among plants. The Nanicão 2001 cultivar (triploid AAA of the Caven-dish sub-group) was used as the test plant. The planta-tion was developed leaving only the mothers, daughters and granddaughters plants in the clusters.
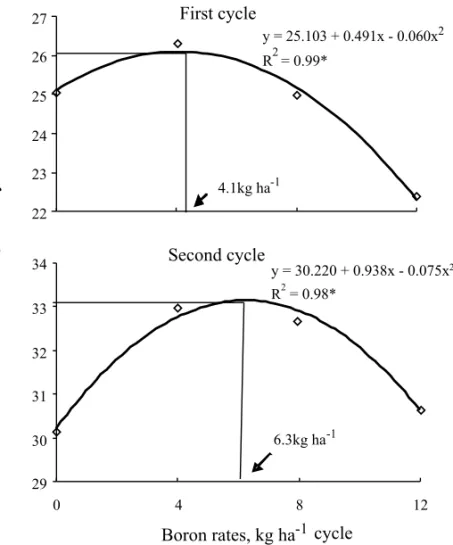
Fig. 1 – Yield of banana (t ha−1cycle−1) in the first and second cycles in response of B rates. *Significant at 5% (first cycle) and 10% (second cycle) level of probability – F-test.
hand. These two parts were dried in a forced air cham-ber at 65◦C until reaching constant weight. Then, the
B concentration of the leaves and fruits (pulp plus peel) samples were determined according to Malavolta et al. (1997).
In the two yield cycles the following variables were evaluated: bunch weight; bunch length; number of hands per bunch; weight of the second hand; number of fruits per hand; fruit length and diameter; pulp diam-eter; peel thickness; pulp/peel ratio, pH (acidity); total soluble solids (brix degree); and pulp resistance.
The estimated content (Co) of B in the fruit was calculated by the equation: Co = nutrient concentration in the fruit×bunch yield [bunch weight – stalk weight (2 kg)], with the result expressed in mg plant−1.
While the leaves were being collected, soil samples were being taken at a depth of 0–20 cm in the first flow-ering (first cycle) and at the same depth for the second flowering (second cycle). The available B in the soil was measured by spectrophotometry using the colorimetric
reagent Azomethine H (Abreu et al. 2001), at a wave-length of 420 nm, after extraction with hot water (Abreu et al. 2001), Melhich 3 (Mehlich 1984) and KCl 1.0 mol L−1(Moreira and Castro 2006).
The results were submitted to variance analysis (ANOVA), the F-test, comparison of the means (Tukey’s test at 5%), regression and relationship, as described by Pimentel Gomes and Garcia (2002).
RESULTS AND DISCUSSION
The banana fruit yield increased according to a quad-ratic model with the enforcement of increasing rates of B (Fig. 1). The maximum productivities for the two cycles were obtained with respective rates of 4.1 and 6.3 kg ha−1, corresponding to yields of 26.1 and 33.2 t ha−1. These yields are 323.7% and 438.9% higher than the average in the Amazonas State, which is of around 6.2 t ha−1(IBGE 2008).
stunted leaf blades (possibly just to the main vein) with irregular undulated edges. In case of severe deficiency, necrosis can occur without previous chlorosis, mainly at the leaf ends, which become wilted (Silva et al. 1999, Moreira et al. 2010a).
The availability of B to plants is directly related to the concentration of organic matter and the soil pH (Fageria 2009). In a pH range of 4.0 to 8.0, B is ab-sorbed in the form of H3BO3and H2BO−
3. Under the studied edaphoclimatic conditions, 50% of B is retained in the plant detritus, which is subsequently mineralized and again become available to the plants (Moreira and Fageria 2009b).
Despite the increase in yield, the B rates did not influence the bunch size, number of hands, weight and number of fruits on the second hand, fruit length, diame-ter and peel thickness. According to Gupta (1993), some factors might have affected the uptake of B, such as the pH, cation exchange capacity (CEC), water, organic mat-ter (OM), and particularly the nutrient’s uptake due to the high clay content of the soil at this region.
An increasing concentration of B influenced the pulp/peel ratio, with a quadratic effect in the first cycle and a linear one in the second cycle (Table I). This be-havior can be due to the amount of B applied in the first cycle. However, in the second cycle, with the distribu-tion of fertilizers in a semicircle alongside the daughter plant, there was a reduced contact of the nutrient with the roots, enabling a greater uptake of B (Fig. 2).
The pulp resistance had a positive linear relation-ship with the rates in the two cycles (Table I). This effect possibly occurred due to the increased size of the cells (Loué 1993, Marschner 1995) and their greater cohe-sion because of the greater presence of calcium pectate (Moraes et al. 2002). These observations corroborate the findings of Loomis and Durst (1992) and Moraes et al. (2002), who argue that B is responsible for stabiliz-ing compounds of Ca with pectins, probably causstabiliz-ing an increase in pulp consistency.
According to Bem-Arie and Sonego (1980), a low B content can also influence the activity of the enzymes
acid to plants deficient in this element results in the for-mation of two rhamnogalacturonan-B chains from two m-rhamnogalacturonan-B chains and repacking of the matrix into a firmer cell wall.
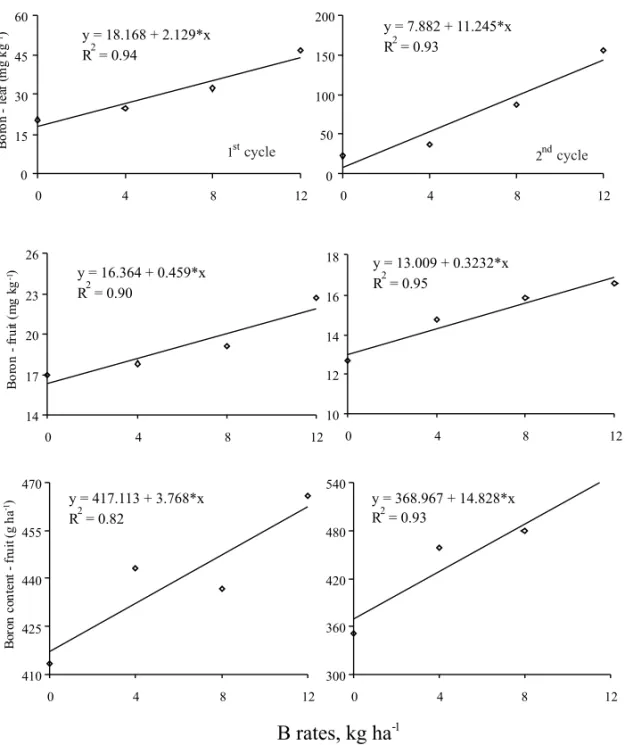
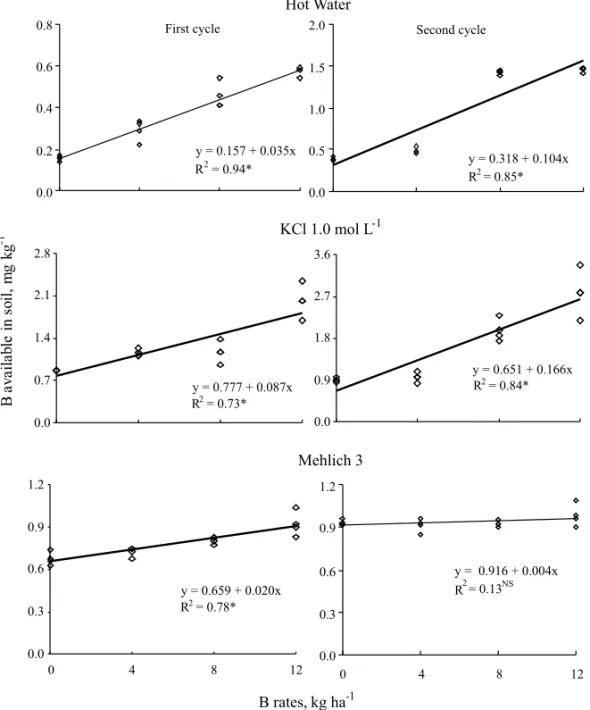
The B rates caused significant differences in the leaf concentrations, showing a linear response to the use of the nutrient (Fig. 2). In the control plants (no B applied), there was a 57% reduction in the concentration from the first to the second cycle. The estimated critical levels of B in the soil (depth of 0 to 20 cm) for maximum yield for the first and second cycles, respectively, obtained by extraction with hot water, were 0.30 and 0.97 mg kg−1, while for KCl these were 1.13 and 1.70 mg kg−1, and for Mehlich 3 0.73 and 0.94 mg kg−1(Fig. 3). Alvarez Venegas et al. (1999) reported that the adequate concen-tration of B available in hot water is between 0.36 and 0.90 mg kg−1.
A comparison of the leaf concentrations obtained against those considered adequate for the genusMusa spp. shows that among the estimated concentrations, only the two lowest rates in the first cycle caused leaf concentrations within the range considered adequate, of 10 to 25 mg kg−1 (Malavolta et al. 1997, Moreira et al. 2005b). At other rates, except for the control in the second cycle, the concentrations were above this range, and at a dose of 12 kg ha−1 in the second cycle, the leaf content was 470% greater than in the control plants (Fig. 2). According to the same procedures used for available B in the soil, the critical B concentration in the leaves to obtain maximum potential yield in the first and second cycles were 26.9 and 78.7 mg kg−1, while in the fruits these were 18.3 and 15.0 mg kg−1, respectively. If using a sufficiency concentration of 25 mg kg−1of B for banana plants indicated by Malavolta et al. (1997), the adequate amount would be 3.4 and 1.3 kg ha−1for the first and second cycles, respectively.
concen-TABLE I
Effect of B rates in parameters of growth and post-harvest of the first and second cycles of banana crop(1).
Cycles Boron rates (kg ha−1) Equations R2
0 4 8 12
bunch length (cm) – CV (%) = 17.83
1st 89.1a 91.5a 82.9a 83.4a NS
2nd 84.7a 91.6a 88.4a 90.6a NS
number of hands per bunch – CV (%) = 6.86
1st 9a 9a 9a 9a NS
2nd 10a 10a 9a 10a NS
weight of the second hand (g) – CV (%) = 16.83
1st 2.3a 2.2a 2.2b 1.9b NS
2nd 2.7a 2.5a 2.8a 2.6a NS
number of fruits per hand – CV (%) = 8.59
1st 15a 15a 16b 15a NS
2nd 16a 15a 22a 16a NS
fruit length (cm) – CV (%) = 5.88
1st 21.3a 21.2a 20.8a 20.4a NS
2nd 21.1a 20.6a 20.0a 18.7a NS
fruit diameter (mm) – CV (%) = 6.65
1st 33.4a 32.6a 33.2a 33.1a NS
2nd 37.2a 38.1a 37.3a 36.3a NS
peel thickness (mm) – CV (%) = 11.43
1st 4.0a 3.7b 3.7a 4.0a NS
2nd 4.3a 4.5a 4.2a 4.0a NS
pulp/peel ratio – CV (%) = 11.95
1st 1.03a 1.10a 1.12a 0.99a y = 1.025 + 0.035ˆ ∗x – 0.003∗x2 0.96
2nd 0.97a 1.07a 1.12a 1.22a y = 0.975 + 0.020ˆ ∗x 0.99
pH (acidity) – CV (%) = 3.59
1st 4.6a 4.6a 4.6a 4.7a NS
2nd 4.8a 4.9a 4.8a 4.9a NS
total soluble solids (brix degree) – CV (%) = 20.16
1st 8.5b 9.5b 9.4b 8.7b y = 8.525 + 0.331ˆ ∗x – 0.027∗ x2 0.98
2nd 12.5a 12.8a 12.6a 12.6a NS
pulp resistance (Newton) – CV (%) = 17.02
1st 21.7a 21.8a 23.9a 25.6a y = 21.180 + 0.345ˆ ∗ x 0.91
2nd 17.4b 18.3b 18.6b 19.0b y = 17.560 + 0.127ˆ ∗ x 0.97
(1)Values followed by similar letters in the same column and variables are not significantly different at p≤0.05 by
Tukey’s test. *Significant at 5% level of probability.NSNon-significant by F-test. R2– coefficient of determination.
tration considered adequate for most of food crops is highly variable, with many requirements for this nutri-ent being attributed to differences in the composition of the cell walls between various species and genotypes (Marschner 1995).
cy-Fig. 2 – Equation of regression among the B rates with B concentration in leaves and fruits, and with B content in fruits of two yield cycles. Significant at 5% level of probability by F-test.
cles, the weights of many parts of the plants had the following division: 27.6% for the fruits (exported part), 9.9% for the leaves, 2.2% for the stems and 60.3% for the pseudo trunk.
The comparison of the available B concentrations in the soil recovered with the extractants and the levels in the diagnostic leaves removed at the start of flowering of the first and second cycles showed the following re-lationship coefficients between pairs of extractants: hot water and Mehlich 3 (r = 0.89, p≤0.05), hot water and
KCl 1.0 mol L−1(r = 0.83, p ≤ 0.05); and Mehlich 3 and KCl 1.0 mol L−1 (r = 0.67, p ≤ 0.05). Figure 1
shows that the KCl 1.0 mol L−1extractant was able to recover more B than the hot water and Mehlich 3 ones. Similar results were obtained by Moreira et al. (2010b), in greenhouse conditions with soybean. According to Jin et al. (1987), the presence of chloride ions in these extractants can cause a higher recovery capacity of the borate anions adsorbed in the positive charges of the colloids in the soil.
Fig. 3 – Equation of regression among B rates with B available in soil determined with Mehlich 1, KCl 1.0 mol L−1and Mehlich 3 extractants. *Significant at 5% level of probability.NSNon-significant by F-test.
determine Ca, Mg and exchangeable Al, while hot wa-ter is only used to dewa-termine the available B in the soil. In addition, this method has a greater extraction range. While for hot water the highest extracted B value was 1.48 mg kg−1, with KCl 1.0 mol L−1this value was 3.37 mg kg−1, which improved the availability ranges and their interpretation as low, medium or high (Fig. 3).
CONCLUSIONS
1. In dystrophic Yellow Latosol – Oxisol (Xanthic Ferralsol) in the moist tropical Amazon, in the first two cycles, the B rates of 4.1 and 6.3 kg ha−1led to the greatest estimated banana yield.
2. The B rates increased the pulp/peel ratio, the pulp texture and the total B concentrations in the leaves and fruits.
3. Under the studied edaphoclimatic conditions, the KCl 1.0 mol L−1extractant was equally effective to hot water in determining the available B in the soil.
RESUMO
so-utilizado foi o inteiramente casualizado em parcela subdivi-dida em esquema fatorial 4×2, constituído por quatro doses de B (0, 4, 8 e 12 kg ha−1) e dois ciclos de colheita – sub-parcelas (primeiro e segundo ciclo), com quatro repetições. A disponibilidade de B no solo foi determinada pelos extratores Mehlich 3, água quente e KCl 1,0 mol L−1. A aplicação de B influenciou a produção, relação polpa e casca, resistência da polpa e o teor de B nas folhas e nos frutos. O extrator KCl 1,0 mol L−1foi semelhante ao água quente na avaliação do B disponível. Para obtenção do máximo potencial de produção é necessário aplicar 4,1 e 6,1 kg ha−1de B no primeiro e no segundo ciclo, respectivamente.
Palavras-chave: Musaspp., produtividade, métodos de aná-lise de solo, pós-colheita.
REFERENCES
ABREUMF, ABREUCAANDANDRADEJC. 2001. Deter-minação de boro em água quente usando aquecimento com microonda. In: RAIJB, ANDRADEJC, CANTARELLAH
ANDQUAGGIOJA (Eds), Análise química para avaliação da fertilidade de solos tropicais. Instituto Agronômico, Campinas, SP, Brasil, p. 231–239.
ALVAREZVENEGASVH, NOVAISRF, BARROSNF, CATA
-RUTTIRBANDLOPESAS. 1999. Interpretação dos re-sultados das análises de solos. In: RIBEIROAC, GUIMA
-RÃES PTG AND ALVAREZ VENEGAS VH (Eds), Re-comendação para o uso de corretivos e fertilizantes em Minas Gerais, 5a aproximação. SFSEMG, Viçosa, ES, Brasil, p. 25–32.
BEM-ARIER AND SONEGO L. 1980. Pectolytic enzyme
activity involved in woolly breakdown of stored peaches. Phytoch 18: 2553–2555.
BERGERKCANDTRUOGE. 1939. Boron determination in soils and plants using the quinalizarin reaction. Ind Eng Chem 11: 540–545.
CHAPMANVJ, EDWARDSDG, BLAMEYFPCANDASHER
CJ. 1997. Challenging the dogma of a narrow supply range between deficiency and toxicity of boron. In: BELL
RWANDRERKASEMB (Eds), Boron in soil and plants. Kluwer Academic, Dordrecht, p. 151–155.
EMBRAPA– EMPRESABRASILEIRA DEPESQUISAAGRO
-PECUÁRIA. 1997. Manual de métodos de análise do solo. Embrapa Solos, Rio de Janeiro, RJ, Brasil, 212 p.
CRC Press, Boca Raton, USA, 430 p.
FAO. 1990. FAO-Unesco Soil Map of the World. Soils Bul-letin No. 60, Food and Agriculture Organization, Rome, Italy, 123 p.
FAOSTAT. 2008. Prodstat:crops. Food and Agriculture Organization, Rome, Italy.
<http://faostat.fao.org/default.aspx>. Accessed in 2010.09.09.
FERREIRAGB, FONTESRLF, FONTESMPFANDALVAREZ
VENEGASVH. 2001. Influência de algumas caracterís-ticas do solo nos teores de boro disponível. Rev Bras Ci Solo 25: 91–101.
GASPAROTTOL, PEREIRAJCR, PEREIRAMCNANDCOS -TA MM. 2002. FHIA 18: cultivar de bananeira resiste
a sigatoka negra para o Estado do Amazonas. Embrapa Amazônia Ocidental, Manaus, AM, Brasil, 3 p.
GUPTAUC. 1993. Boron and its role in crop production. CRC Press, Boca Raton, USA, 237 p.
IBGE – INSTITUTO BRASILEIRO DE GEOGRAFIA E ES
-TATÍSTICA. 2008.<https://www.ibge.gov.br>. Accessed in 2010.09.09.
ISHIIT, MATSUNAGATANDHAYASHIN. 2001. Formation of rhamnogalacturonan II-borate dimmer in pectin deter-mines cell wall thickness of pumpkin tissue. Plant Physio 116: 1698–1705.
JINJ, MARTENSDCANDZELAZNYLW. 1987. Distribution
and plants availability of soil boron fractions. Soil Sci Soc Am J 51: 1228–1231.
LOOMISWDANDDURSTRW. 1992. Chemistry and biology of boron. Biofactors 3: 229–239.
LOUÉ A. 1993. Oligoéléments en agriculture. SCPA-NA-THAN, Antibes, France, 577 p.
MALAVOLTAE, VITTIGCANDOLIVEIRAAS. 1997. Ava-liação do estado nutricional das plantas: princípios e apli-cações. Potafos, Piracicaba, SP, Brasil, 319 p.
MARSCHNERH. 1995. Mineral nutrition of higher plants.
Academic Press, London, England, 888 p.
MEHLICHA. 1984. Mehlich 3 soil test extractant; a
modifi-cation of Mehlich 2 extractant. Comm Soil Sci Plant Anal 15: 1409–1416.
MORAES LAC, MORAES VHF AND MOREIRA A. 2002.
MOREIRA A AND CASTRO C. 2006. Extratores ácidos e sais na determinação da disponibilidade de boro no solo. Embrapa Amazônia Ocidental, Manaus, AM, Brasil, 5 p. MOREIRA AANDFAGERIANK. 2009a. Soil chemical
at-tributes of Amazonas State, Brazil. Comm Soil Sci Plant Anal 40: 2912–2925.
MOREIRAAANDFAGERIANK. 2009b. Repartição e remo-bilização de nutrientes na bananeira. Rev Bras Frut 31: 574–581.
MOREIRAA, ALMEIDAMP, COSTADGANDSANTOSLS. 2004. Acidez potencial pelo método pH SMP no Estado do Amazonas. Pesq Agropec Bras 39: 89–92.
MOREIRAA, PEREIRAJCANDARRUDAMR. 2005a. Ava-liação do estado nutricional de bananais cultivados no Estado do Amazonas. Rev Ci Agra 40: 29–42.
MOREIRAA, ARRUDA MR, PEREIRAJCR, GASPAROTTO
LANDPEREIRAMCN. 2005b. Recomendação de
adu-bação e calagem para bananeira no Estado do Amazonas, 1aaproximação. Embrapa Amazônia Ocidental, Manaus,
AM, Brasil, 18 p.
MOREIRA A, BORGESAL, ARRUDA MRAND PEREIRA
JCR. 2010a. Nutrição e adubação de bananais cultivados na região Amazônica. In: GASPAROTTOLANDPEREI
-RA JCR (Eds), A cultura da bananeira na região norte do Brasil. Embrapa Amazônia Ocidental, Manaus, AM, Brasil, p. 97–132.
MOREIRAA, CASTRO CANDOLIVEIRAFA. 2010b. Pro-dução, teor de boro e avaliação de extratores em solos cultivados com soja. Ci Agrotec 34: 367–373.
PIMENTELGOMESF ANDGARCIACH. 2002. Estatística
aplicada a experimentos agronômicos e florestais; exposi-ção com exemplos e orientações para uso de aplicativos. FEALQ, Piracicaba, SP, Brasil, 309 p.
SALVADORJO, MOREIRAA, MALAVOLTAEANDCABRAL
CP. 2003. Influência do boro e do manganês no cresci-mento e na composição mineral de mudas de goiabeira. Ci Agrotec 27: 325–331.
SILVAJTA, BORGESALANDMALBURGJL. 1999. Solos, adubação e nutrição da bananeira. Infor Agropec 20: 21– 36.