Likelihood ratio test between two groups of castor oil plant traits
Teste de razão de verossimilhança entre dois grupos de caracteres de mamoneira
Betania BrumI* Sidinei José LopesII Daniel Furtado FerreiraIII Lindolfo StorckI Alberto Cargnelutti FilhoII
ISSN 1678-4596
ABSTRACT
The likelihood ratio test (LRT), to the independence between two sets of variables, allows to identify whether there is a dependency relationship between them. The aim of this study was to calculate the type I error and power of the LRT for determining independence between two sets of variables under multivariate normal distributions in scenarios consisting of combinations of 16 sample sizes; 40 combinations of the number of variables of the two groups; and nine degrees of correlation between the variables (for the power). The rate of type I error and power were calculate at 640 and 5,760 scenarios, respectively. A performance evaluation of the LRT was conducted by computer simulation by the Monte Carlo method, using 2,000 simulations in each scenario. When the number of variables was large (24), the TRV controlled the rate of type I errors and showed high power in sizes greater than 100 samples. For small sample sizes (25, 30 and 50), the test showed good performance because the number of variables did not exceed 12.
Key words: Ricinus communis L., type I error, power test, multivariate normal distribution.
RESUMO
O teste de razão de verossimilhança para a independência entre dois grupos de variáveis permite-nos
identificar se existe uma relação de dependência entre eles. O
objetivo deste trabalho foi calcular o erro tipo I e o poder do teste de razão de verossimilhança para independência entre dois grupos de caracteres, com distribuição normal multivariada, em cenários constituídos pelas combinações de: 16 tamanhos de amostra; 40 combinações de número de caracteres dos dois grupos; e nove graus de correlação entre os caracteres (para o poder). A taxa de erro tipo I e o poder foram calculados em 640 e 5.760 cenários a taxa de erro tipo I e o poder, respectivamente. A avaliação do desempenho do teste de razão de verossimilhança foi realizada
por meio de simulação computacional pelo método Monte Carlo, utilizando-se 2.000 simulações em cada um dos cenários. Quando o número de caracteres é grande (24), o teste de razão de verossimilhança controla a taxa de erro tipo I e apresenta poder elevado (próximo a 100%), em tamanhos de amostra superiores a 100. Para tamanhos amostrais pequenos (25, 30 e 50), o teste apresenta bom desempenho (erro tipo I esperado e poder elevado), desde que o número de caracteres não exceda a 12.
Palavras-chave: Ricinus communis L., Erro tipo I, Poder do teste, distribuição normal multivariada.
INTRODUCTION
Brazil, the largest producer of castor bean in the world in the 1970s, suffered a drastic reduction in the planted area due to production and marketing problems. Studies (BRUM et al., 2011; SANTOS et al., 2011; MESQUITA et al., 2012) have been conducted with the castor oil plant to increase yield because the production level of this crop has stagnated at 600kg ha-1 since the 1990s. Records indicate a mean yield of 2,000kg ha-1 in India, the major producing country (SEVERINO, 2006).
An understanding of the linear associations between groups of seed, seedling, adult plant and produced bean variables allows the determination of the most important variables for the selection of plants
to obtain a final product of high quality (BRUM et al.,
2011). The association between groups of variables
IDepartamento de Ciências Agrárias, Universidade Tecnológica Federal do Paraná (UTFPR), 85503-390, Pato Branco, PR, Brasil. E-mail:
[email protected]. *Corresponding author.
II Departamento de Fitotecnia, Centro de Ciências Rurais (CCR), Universidade Federal de Santa Maria (UFSM), Santa Maria, RS, Brasil. IIIUniversidade Federal de Lavras (UFLA), Lavras, MG, Brasil.
can be rigorously evaluated by canonical correlation analysis (MINGOTI, 2007). There are studies that employ canonical correlation analysis in agricultural crops, such as pigeon pea (SANTOS et al., 1994), bean (COIMBRA et al., 2000), potato (RIGÃO et al., 2009), and castor bean (BRUM et al., 2011).
An important assumption to be tested for the use of canonical correlation is whether the measurement vectors of variables from two groups, X and Y, are independent or uncorrelated; if they are, the canonical correlation analysis is no longer useful, as the correlation between all of the linear combinations
will be equal to zero (CRUZ & REGAZZI, 1997).
The condition of independence between two sets of variables can be tested using the likelihood ratio test (LRT), i.e., if the covariances between the two groups
are equal to zero (FERREIRA, 2008).
There is very little information available in the literature about the use of the LRT for determining the independence between two groups of variables. Thus, the objective of this study was to calculate the type I error and the power of the LRT for determining the independence between two groups of castor oil plant traits under a multivariate normal distribution in scenarios consisting of the combinations of 16 sample sizes; 40 combinations of the number of traits from the two groups; and nine degrees of correlation between the traits (for the power).
MATERIALS AND METHODS
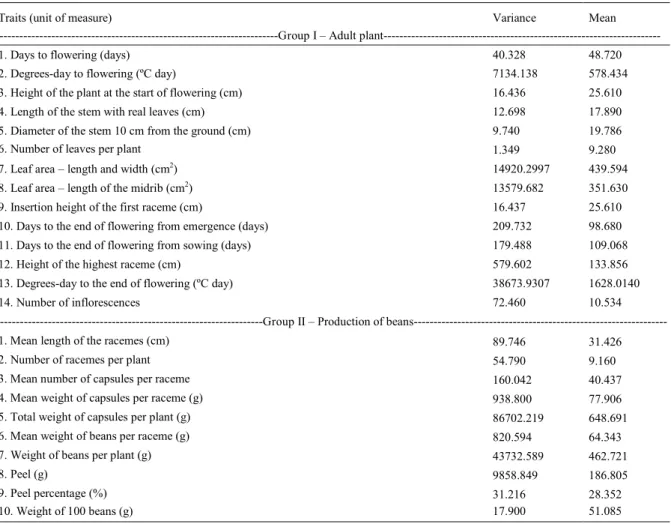
The variable database of the castor oil plant hybrid Lyra, from which the means and variances were used to generate multivariate random samples, was obtained from the experiment by BRUM (2009). For this study, the adult plant and production variables were used (Table 1). The means and variances used to generate the covariance matrices and; therefore, the multivariate random samples for the calculations of the type I error and the power of the LRT for the independence between two groups of variables belong to the groups of adult plants and the production of the hybrid Lyra (Table 1).
To obtain the multivariate normal samples used in the calculations of the type I error rates of the LRT for the independence between two groups of variables under the null hypothesis, matrices with zero covariances and real variances and means were used. These were obtained from 14 adult plant variables (Group I) and from 10 bean production variables (Group II) of the castor oil plant hybrid Lyra.
The matrices were obtained by the combination of variables from the two groups (14 from
adult plants and 10 from bean production), beginning with the combination 3+3 (3 variables from Group I and 3 variables from Group II), then 3+4 (3 variables from Group I and 4 variables from Group II) up to the 14+10 combination (14 variables from Group I and 10 variables from Group II), totaling 40 combinations.
Hypotheses that were established in the LRT for the independence between two groups of variables were H0: ∑xy= 0p+q (the two groups of variables are independent) and H1: ∑xy≠ 0p+q (the two groups of variables are not independent), where 0p+q is the zero matrix.
The chi-squared statistic of the LRT for the
independence between two groups of variables that was used was that corrected by Bartlett (JOHNSON
& WICHERN, 2007; MINGOTI, 2007; FERREIRA,
2008). In this test, the value of the statistic calculated was compared to the tabulated critical value of the
chi-squared distribution (upper 5% quantile), with p×q degrees of freedom at 5% level of significance;
when the calculated value is greater than the tabulated value, the null hypothesis is rejected, and it is concluded that the two groups considered in the study are not independent.
To calculate the probability of making a type I error in the LRT for the independence between two groups of variables, a computational simulation by the Monte Carlo method was performed, considering the following scenarios: 16 sample sizes - 25, 30, 50, 100, 200, 300, 400, 500, 600, 750, 1,000, 1,500, 2,000, 3,000, 4,000 and 5,000; 40 combinations of the number of variables between the two groups – starting with 3+3, 3+4, 3+5, 3+6, 3+7, 3+8, 3+9, 3+10, 4+4, 4+5, 4+6, 4+7, 4+8, 4+9, 4+10, and 5+3 up to 14+10; and a degree of correlation between the variables of the covariance matrices:
∑XY = 0; totaling 640 scenarios (16 × 40 × 1). For each scenario, 2,000 simulations with multivariate normal distribution were performed, which resulted in 1,280,000 simulations (640 x 2,000). In each
simulation, the calculated chi-squared values and the
p-value of the LRT for the independence between two groups of variables were obtained. The type I error rate was calculated as the ratio between the number of times the null hypothesis was rejected (p-value
≤0.05) and the total number of simulations, 2,000.
To test if the type I error rates differed
from the significance level adopted (α=1%), the lower limit (3.475%) and the upper limit (6.255%) of the exact confidence interval (CI) of 99% were used
for a proportion , which was calculated as
and Za/2=2.575829304, obtained from the standard normal with mean zero and standard deviation of one. Therefore, only type I error rates outside of
this interval (3.475% to 6.255%) were considered different from the nominal significance value of 5%.
To obtain the multivariate normal samples used in the power calculations of the LRT for the independence between two groups of variables, the same variances and vector of means as in the calculation of the type I error rates (Table 1) and
covariances given by ∑xy=si × sy × r, in which Si is the standard deviation of the ith variable; S
j is the standard deviation of the jth variable, i = 1, 2, ..., p and
j 1, 2, ..., q; and r is the Pearson correlation coefficient
between the variables i and j (evaluated degrees of correlation: r = 0.1, 0.2, 0.3, 0.4, 0.5, 0.6, 0.7, 0.8 and 0.9), were used. Therefore, the total number of matrices generated for the power calculation was 360 (40 combinations of variables × 9 degrees of
correlation). Vectors of the means of groups 1 (μX)
and 2 (μY) were the same used to generate multivariate random samples in the calculation of the type I error rates, without loss of generality.
Regarding the application of the test for the power calculation, the only difference in relation to the procedure applied to calculate the type I error rates was that the LRT for the independence between two groups of variables was constructed under the alternative hypothesis, i.e., covariance matrices exhibited correlation between the variables (r=0.1 to 0.9). In other words, multivariate normal random samples were generated to assess the power of the test to reject the H0, which is false by construction.
In the Monte Carlo simulation for the power calculations, the following scenarios were considered: 16 sample sizes - 25, 30, 50, 100, 200, 300, 400, 500, 600, 750, 1,000, 1,500, 2,000, 3,000, 4,000 and 5,000; 40 combinations of variables between the
Table 1 – Variance and mean of the castor bean adult plant and production variables in 50 Lyra hybrid plants.
Traits (unit of measure) Variance Mean
---Group I – Adult
plant---1. Days to flowering (days) 40.328 48.720
2. Degrees-day to flowering (ºC day) 7134.138 578.434
3. Height of the plant at the start of flowering (cm) 16.436 25.610
4. Length of the stem with real leaves (cm) 12.698 17.890
5. Diameter of the stem 10 cm from the ground (cm) 9.740 19.786
6. Number of leaves per plant 1.349 9.280
7. Leaf area – length and width (cm2) 14920.2997 439.594
8. Leaf area – length of the midrib (cm2) 13579.682 351.630
9. Insertion height of the first raceme (cm) 16.437 25.610
10. Days to the end of flowering from emergence (days) 209.732 98.680 11. Days to the end of flowering from sowing (days) 179.488 109.068
12. Height of the highest raceme (cm) 579.602 133.856
13. Degrees-day to the end of flowering (ºC day) 38673.9307 1628.0140
14. Number of inflorescences 72.460 10.534
---Group II – Production of
beans---1. Mean length of the racemes (cm) 89.746 31.426
2. Number of racemes per plant 54.790 9.160
3. Mean number of capsules per raceme 160.042 40.437
4. Mean weight of capsules per raceme (g) 938.800 77.906
5. Total weight of capsules per plant (g) 86702.219 648.691
6. Mean weight of beans per raceme (g) 820.594 64.343
7. Weight of beans per plant (g) 43732.589 462.721
8. Peel (g) 9858.849 186.805
9. Peel percentage (%) 31.216 28.352
two groups – starting with 3+3, 3+4, 3+5, 3+6, 3+7, 3+8, 3+9, 3+10, 4+4 up to 14+10; and nine degrees of correlation between the variables (r=0.1, 0.2, 0.3, 0.4, 0.5, 0.6, 0.7, 0.8 and 0.9), totaling 5,760 scenarios (16 × 40 × 9) and 11,520,000 simulations (5,760 x 2,000). In each scenario, the power was calculated by the ratio between the number of times the null hypothesis was rejected and the total number of simulations (2,000),
considering a significance level of 5%.
Simulations were performed with the use of the Monte Carlo method, and the calculations of the type I error rates and the power were conducted by means of a program developed in the R environment
for Windows, version 2.13.0 (R DEVELOPMENT
CORE TEAM, 2010). Multivariate normal samples were obtained in R with the use of the mvrnorm
function from the MASS package. To confirm the
normality (multivariate normal distribution) of the multivariate random samples generated, the
mvShapiro test function (α= 5%) of the mvShapiro test
package of the R software was used (VILLASENOR
ALVA & ESTRADA, 2009).
RESULTS AND DISCUSSION
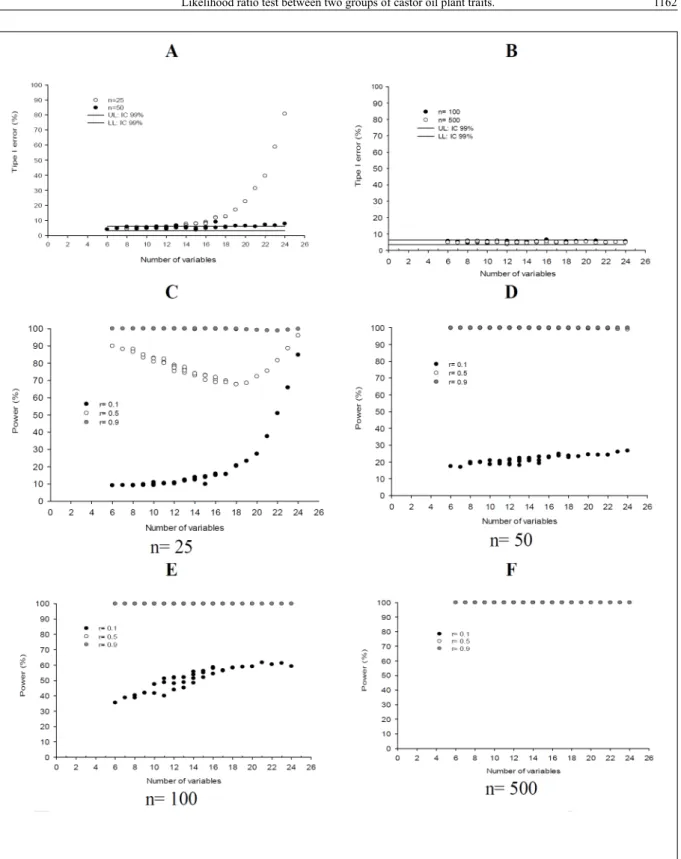
Values of the type I error rates of the LRT for the independence between two groups of variables under multivariate normal distribution in small sample
sizes, n=25, (Figure 1A) increased significantly with the increase in the number of variables. With n=50, the
values of the type I error tended to stabilize, even when the number of variables was increased (Figure 1A).
In both situations (n=25 and 50), the effect on the type I error rates was primarily due to the total number of variables used in the two groups of variables and not to the number of variables in each group because different combinations of the number of variables in each group generated similar type I
error results (repeated points for the same p in figure 1
A and B). In sample sizes of 100 and 500 observations (Figure 1B), all of the type I error rates stayed within
the 99% confidence interval, regardless of the number
of variables. In sample sizes greater than 500, the same result was observed (data not shown).
The minimum level of significance of 5% of the LRT for the independence between two
groups of variables was not violated in the sample size n=25 when the number of variables in the study was at most 12 (Figures 1A). However, with 14 or more variables, the type I error rates increased, and the test became liberal (it exceeded the upper
limit of 99% of the CI=6.255%). A hypothesis test is classified as liberal when the type I error rates are
higher than the minimum significance level that is established (α) (SILVA et al., 2008). With samples
larger than n=50 (Figure 1B), increases in the total number of variables did not affect the type I error
rate, and it stayed close to 5%. In this case, the type I error rates exceeded the upper limit of 99% of the
CI only with n=22, 23 and 24 variables.
When evaluating the behavior of two tests for the equality of variance matrices of k populations
(multivariate Bartlett test and its bootstrap version) with the use of a Monte Carlo simulation, in normal and non-normal populations, in combinations of the sample sizes (n), number of variables (p), correlations (r) and number of populations (k), SILVA et al. (2008) reported that the multivariate Bartlett test controls the type I error in almost all combinations for k=2; however, it becomes liberal when k is increased to 5. In both situations (k=2 and 5), the type I error rates increased greatly with the increase in the number of variables in sample sizes varying from 5 to 50. These results corroborate those observed in this study.
Studying various tests for covariance matrices in samples with P=2, 3 and 5 variables
in different matrix structures (modification in the
variance, in the correlation, and in both), including the LRT, to test the hypothesis that the covariance matrix
of a process (∑) is equal to a particular matrix (∑0), PINTO (2009) reported that the LRT approximated
by the chi-squared distribution does not control type I
errors for samples of size n=10 in bivariate situations and for samples of sizes n=10 and 25 in situations with P=3 and 5 variables. Thus, the study concluded that the LRT is not a good test for studies involving a small number of samples. This result, as well as those observed in this study, indicate that LRTs for
covariance matrices approximated by the chi-squared
distribution do not control type I error in situations with small sample sizes combined with an increase in the number of variables.
Considering only type I errors, the recommendation is that when working with small
sample sizes (n≤30), 12 variables at most should be
used; for n=50, 18 variables at most should be used. In sample sizes greater than 100, any number of variables can be adopted within the interval studied (P=6 to 24 variables).
The power of the LRT for the independence between two groups of variables is small when the sample size is 25 elements, which is associated with the low correlation (r=0.1) between the variables (Figure 1C). Considering n=25 and r=0.1 when using 24 variables, there is a marked increase in the
Keeping P and n fixed and increasing the correlation,
an increase in the values of power is observed in both cases, as expected; when the correlation is increased, the probability of rejecting H0 increases when it is, in fact, false (Figure 1C, 1D and 1E).
This observation indicates that the LRT for the independence between two groups of variables is
efficient in the detection of small changes (r=0.1) in
the degree of correlation of the covariance matrices of the two groups of variables, which decreases the probability of making a type II error.
In the same way as observed for type I errors, the sample sizes affect the power of the test. In the situations with sample sizes n=25 and 50 and weak correlation (r=0.1), the power values
are significantly lower (Figure 1C, 1D and 1E),
regardless of the number of variables; in these situations, the type I error values were generally high (Figure 1A). PINTO (2009) observed that for H1 close to H0 (as is the case with r=0.1 in this study), several tests of covariance matrices, including the LRT, are less powerful in small samples (n=10) and that the power of the tests increases with an increase in the sample size. RIBEIRO (2010) concluded that in general, when increasing the sample size, the power of the tests increases. Furthermore, the author notes that the good behavior presented by the LRT and by the test proposed by SULLIVAN et al. (2007) for autocorrelated data corroborate the data presented by Pinto (2009), who states that these are the best tests for independent data.
Starting at n=500, all of the scenarios (including the lowest correlation, r=0.1) reach
power values of 100% (Figure 1D). This observation
indicates that with the LRT, the use of very large samples may lead the researcher to incorrect decisions. By having a covariance matrix whose degree of correlation is low (r=0.1), the test will reject the H0, indicating that there is no independence between the two groups of variables (the groups are correlated); in fact, that decision (rejecting H0) was caused by the large sample size. Therefore, in situations in which
n is large, the significance results of the hypotheses
tests should be interpreted considering the practical
significance because large samples can make the
statistic tests very sensitive. This means that even very small effects without practical importance will
be statistically significant (HAIR et al., 2009). In evaluating the quality of fit of models of structural equations, HAIR et al. (2009) state
that this effect is due to the sensitivity of the
chi-squared statistic of the LRT to the sample size,
especially when the sample size is greater than 200
observations; when n is less than or equal to 100, the chi-squared test will exhibit an acceptable fit (the differences are not significant between the estimated
and observed covariance matrices), even when the
model relationships are not significant. The authors
concluded that because of this, the use of the
chi-squared test in structural equations will only be
reliable within the sample size interval from 100 to 200 observations.
It was observed that there is a strong
influence of the number of variables and the degree of correlation on the power values. With P≥10 variables and r≥0.2 (data not shown), high power values can already be observed when n≥100.
In medium to high correlations (r=0.5 to 0.9) (CARVALHO et al., 2004), the power values are
close to 100% even in the smaller sample sizes and
in the lowest number of variables considered (six) (Figures 1C, 1D, 1E and 1F).
Similar results were reported by PINTO (2009), who observed that the power values of the
LRT (for a specific covariance) with exact distribution and of the LRT with approximate chi-squared
distribution were similar when the sample size was increased to 50 and 100 observations. However, the correlation or proximity between the power values of the test statistics in that case occurred in sample
sizes lower than those observed in this study (n ≥
500) of the LRT for the independence between two groups of variables.
Situations in which there are simultaneously higher, type I error and power characterizing a liberal test. In these cases, the high power values cannot be
considered real (CANTELMO & FERREIRA, 2007). When assessing the performance of the multivariate Shapiro-Wilk normality test, the authors report such
a situation in which the test exhibited type I error
values that were always high and close to 100% when increasing the number of variables to a certain fixed
sample size (n varied from 10 to 200) while the power
values were close to 100% in any situation.
CONCLUSION
Under multivariate normal distributions, for the LRT for the independence between two groups of variables to be robust, the following situations should be considered: i. type I errors are controlled up to P=12 variables, even in small sample sizes (n=25 and 30); in this situation, the power is low. For
n≥100 and r≥0.2, the power values are high. When n
the maximum number of variables (P=24), starting at
n≥500, increasing p did not cause significant changes in the type I error rates, which are kept close to 5%,
while the power increases in this situation.
ACKNOWLEDGEMENTS
To the Conselho Nacional de Desenvolvimento Científico e Tecnológico (CNPq) for the Doctoral, Post-Doctoral and Productivity in Research Scholarships.
REFERENCES
BRUM, B. Relações entre variáveis de: sementes, plântulas, plantas, produção e óleo em mamoneira. 2009. 120f. Dissertação (Mestrado em Agronomia) – Programa de Pós-Graduação em Agronomia, Universidade Federal de Santa Maria, RS.
BRUM, B. et al. Correlações canônicas entre variáveis de semente, plântula, planta e produção de grãos em mamoneira. Ciência Rural, v.41, n.3, p.404-411, 2011. Available from: <http://www.scielo.br/scielo.php?script=sci_ arttext&pid=S0103-84782011000300007&lng=en&nrm=iso>. ISSN 0103-8478. Accessed: Jan. 15, 2014. doi: 10.1590/ S0103- 84782011000300007.
CANTELMO, N.F.; FERREIRA, D.F. Desempenho de testes de normalidade multivariados avaliados por simulação Monte Carlo. Ciência e Agrotecnologia, v.31, n.6, p.1630-1636, 2007. Available from: <http://www.scielo.br/scielo. php?script=sci_arttext&pid=S1413-70542007000600005&lng =pt&nrm=iso>. Accessed: Ago. 11, 2014. doi: 10.1590/S1413-70542007000600005.
CARVALHO, F.I.F. et al. Estimativas e implicações da correlação no melhoramento vegetal. Pelotas: UFPel, 2004. 142p.
COIMBRA, J.L. M. et al. Correlações canônicas: II - análise do rendimento de grãos de feijão e seus componentes. Ciência Rural, v.30, n.1, p.347-352, 2000. Available from <http:// www.scielo.br/scielo.php?script=sci_arttext&pid=S0103-84782000000100005&lng=en&nrm=iso>. Accessed: Mar. 15, 2014. doi:10.1590/S0103-84782000000100005.
CRUZ, C.D., REGAZZI, A.J. Modelos biométricos aplicados ao melhoramento genético. 2.ed. Viçosa: UFV, 1997. 390p.
FERREIRA, D.F. Estatística multivariada. Lavras: UFLA, 2008. V.1. 662p.
HAIR, J.F. et al. Análise multivariada de dados. 6.ed. Porto Alegre: Bookman, 2009. 595p.
JOHNSON, R.A; WICHERN, D.W. Applied multivariate statistical analysis. 6.ed. New Jersey: Prentice Hall, 2007. 800p.
MESQUITA, E.F. et al. Crescimento e produção de duas cultivares de mamoneira sob fertilização NPK. Revista Caatinga, v.25, p.35-43, 2012. Available from: <http://periodicos.ufersa.edu.br/ revistas/index.php/sistema/article/viewFile/2140/pdf>. Accessed: Mar. 18, 2014.
MINGOTI, S.A. Análise de dados através de métodos de estatística multivariada: uma abordagem aplicada. Belo Horizonte: UFMG, 2007. 297p.
PINTO, L. P. Estudo comparativo de testes de hipótese multivariados para matrizes de covariâncias via simulação de Monte Carlo e suas aplicações em Controle de Qualidade. 2009. 109f. Dissertação (Mestrado em Estatística) – Programa de Pós-Graduação em Estatística, Universidade Federal de Minas Gerais, Belo Horizonte, MG.
R DEVELOPMENT CORE TEAM. R: A language and environment for statistical computing. Vienna, Austria, 2010. Available from: <http://www.Rproject.org>. Accessed: Apr. 19, 2014.
RIBEIRO, R. L. F. Testes de hipótese multivariados para matrizes de covariâncias em processos autocorrelacionados com aplicações em controle de qualidade. 2010. 138f. Dissertação (Mestrado em Estatística) – Programa de Pós-Graduação em Estatística, Universidade Federal de Minas Gerais, Belo Horizonte, MG.
RIGÃO, M.H. et al. Correlação canônica entre caracteres de tubérculos para seleção precoce de clones de batata. Ciencia Rural, v.39, n.8, p.2347-2353, 2009. Available from <http:// www.scielo.br/scielo.php?script=sci_arttext&pid=S0103-84782009000800012&lng=en&nrm=iso>. Accessed: Feb. 12, 2014. doi: 10.1590/S0103-84782009005000190.
SANTOS, C.A.F. et al. Correlações canônicas entre componentes primários e secundários na produção de grãos em Guandu (Cajanus cajan (L.) Millsp). Revista Ceres, v.41, n.236, p.456-464, 1994. Available from: <http://www.ceres.ufv.br/ojs/index.php/ ceres/ article/view/2096>. Accessed: Mar. 20, 2014.
SANTOS, V. M. et al. Avaliação do crescimento e da produtividade da mamoneira BRS 149, Nordestina em dois níveis tecnológicos. Journal of Biotechnology and Biodiversity, v.2, p.58-66, 2011. Available from: <http://revista.uft.edu.br/index.php/JBB/article/ view/250>. Accessed: Apr. 15, 2014.
SEVERINO, S.L. Como a Índia tornou-se líder mundial na produção de mamona, 2006. Available from: <http://www. biodieselbr.com/colunistas/liv/india-lider-mundial-producao-mamona.htm>. Accessed: Sept. 20, 2014.
SILVA, R.B.V. et al. Robustness of asymptotic and bootstrap tests for multivariate homogeneity of covariance matrices. Ciência e Agrotecnologia, v.32, n.1, p.157-161, 2008. Available from <http://www.scielo.br/scielo.php?script=sci_arttext&pid=S1413-70542008000100023&lng=en&nrm=iso>. Accessed: Mar. 15, 2014. doi: 10.1590/S1413-70542008000100023.
SULLIVAN, J.H. et al. Step-down analysis for change in the covariance matrix and other parameters, Journal of Quality Technology, v.39, n.1, p.66-84, 2007. Available from: <http://connection.ebscohost. com/c/articles/23550322/step-down-analysis-changes-covariance-matrix-other-parameters>. Accessed: Jan. 15, 2014.