Functional Regression Models for Epistasis
Analysis of Multiple Quantitative Traits
Futao Zhang1, Dan Xie2, Meimei Liang3, Momiao Xiong4*
1Department of Computer Science, College of Internet of Things, Hohai University, Changzhou, China,
2College of Information Engineering, Hubei University of Chinese Medicine, Hubei, China,3Institute of Bioinformatics, Zhejiang University, Hangzhou, Zhejiang, China,4Human Genetics Center, Division of Biostatistics, The University of Texas School of Public Health, Houston, Texas, United States of America *Momiao.Xiong@uth.tmc.edu
Abstract
To date, most genetic analyses of phenotypes have focused on analyzing single traits or analyzing each phenotype independently. However, joint epistasis analysis of multiple plementary traits will increase statistical power and improve our understanding of the com-plicated genetic structure of the complex diseases. Despite their importance in uncovering the genetic structure of complex traits, the statistical methods for identifying epistasis in mul-tiple phenotypes remains fundamentally unexplored. To fill this gap, we formulate a test for interaction between two genes in multiple quantitative trait analysis as a multiple functional regression (MFRG) in which the genotype functions (genetic variant profiles) are defined as a function of the genomic position of the genetic variants. We use large-scale simulations to calculate Type I error rates for testing interaction between two genes with multiple pheno-types and to compare the power with multivariate pairwise interaction analysis and single trait interaction analysis by a single variate functional regression model. To further evaluate performance, the MFRG for epistasis analysis is applied to five phenotypes of exome sequence data from the NHLBI’s Exome Sequencing Project (ESP) to detect pleiotropic epistasis. A total of 267 pairs of genes that formed a genetic interaction network showed sig-nificant evidence of epistasis influencing five traits. The results demonstrate that the joint interaction analysis of multiple phenotypes has a much higher power to detect interaction than the interaction analysis of a single trait and may open a new direction to fully uncover-ing the genetic structure of multiple phenotypes.
Author Summary
The widely used statistical methods test interaction for single phenotype. However, we often observe pleotropic genetic interaction effects. The simultaneous gene-gene (GxG) interaction analysis of multiple complementary traits will increase statistical power to detect GxG interactions. Although GxG interactions play an important role in uncovering the genetic structure of complex traits, the statistical methods for detecting GxG interac-tions in multiple phenotypes remains less developed owing to its potential complexity. a11111
OPEN ACCESS
Citation:Zhang F, Xie D, Liang M, Xiong M (2016) Functional Regression Models for Epistasis Analysis of Multiple Quantitative Traits. PLoS Genet 12(4): e1005965. doi:10.1371/journal.pgen.1005965
Editor:Scott M. Williams, Case Western Reserve University School of Medicine, UNITED STATES
Received:May 28, 2015
Accepted:March 8, 2016
Published:April 22, 2016
Copyright:© 2016 Zhang et al. This is an open access article distributed under the terms of the Creative Commons Attribution License, which permits unrestricted use, distribution, and reproduction in any medium, provided the original author and source are credited.
Data Availability Statement:This study uses data from the NHLBI’s Exome Sequencing Project (ESP). These confidential data are available to interested researchers through application to NIH data Access Committees for authorization. Data access is provided via dbGaP Authorized Access. Contact information for the NIH data access commitees can be found athttps://gds.nih.gov/04po2_1DAC.html
Therefore, we extend functional regression model from single variate to multivariate for simultaneous GxG interaction analysis of multiple correlated phenotypes. Large-scale simu-lations are conducted to evaluate Type I error rates for testing interaction between two genes with multiple phenotypes and to compare power with traditional multivariate pair-wise interaction analysis and single trait interaction analysis by a single variate functional regres-sion model. To further evaluate performance, the MFRG for interaction analysis is applied to five phenotypes of exome sequence data from the NHLBI’s Exome Sequencing Project (ESP) to detect pleiotropic GxG interactions. 267 pairs of genes that formed a genetic inter-action network showed significant evidence of interinter-actions influencing five traits.
Introduction
In the past several years, we have witnessed remarkable progresses in the development of meth-odologies for identification of epistasis that detect deviation from summation of genetic addi-tive effects for a quantitaaddi-tive trait [1]. The classical approach to epistasis analysis is a single variant test. The epistasis is typically evaluated by testing interaction between a pair of variants one at a time. The classical methods for epistasis tests are originally designed to detect epistasis for common variants and are difficult applied to rare variants due to multiple testing problems and the low power to detect interaction. To overcome the critical barrier in interaction analysis for rare variants, instead of testing each pair of variants individually, group interaction tests that evaluate cumulative interaction effects of multiple genetic variants in a region or gene have recently been developed. Regression-based methods [2–8], haplotype-based methods [9–15], and machine learning-based methods [16–20] are proposed for epistasis analysis.
The classical statistical methods for interaction analysis have mainly tested association with single traits, one time analyzing one trait [21]. However, multiple phenotypes are highly corre-lated. More than 4.6% of the SNPs and 16.9% of the genes in previous genome-wide association studies (GWAS) are reported to be significantly associated with more than one trait [22]. These results demonstrate that genetic pleiotropic effects likely play a crucial role in the molecular basis of correlated phenotypes [23–26]. Joint epistasis analysis of multiple complementary traits will increase statistical power to unravel the interaction structure of multiple phenotypes [27,28]. Despite their importance in understanding genetic mechanism underlying the complex diseases, the statistical methods for identifying epistasis in multiple phenotypes have been less developed [1]. The interaction analyses for multiple phenotypes have been limited to common variants in carefully controlled experimental crosses [29,30]. Simultaneously analyzing interactions for mul-tiple phenotypes in humans poses enormous challenges for methodologies and computations.
Purpose of this paper is to develop a general analytic framework and novel statistical meth-ods for simultaneous epistasis analysis of multiple correlated phenotypes. To unify the
approach to epistasis analysis for both common and rare variants, we take a genome region (or gene) as a basic unit of interaction analysis and use all the information that can be accessed to collectively test interaction between all possible pairs of SNPs within two genome regions (or genes). Functional data analysis is used to reduce the dimension of next-generation sequencing data. Specifically, genetic variant profiles that will recognize information contained in the phys-ical location of the SNP are used as a major data form. The densely typed genetic variants in a genomic region for each individual are so close that these genetic variant profiles can be treated as observed data taken from curves [8,31]. Since standard multivariate statistical analyses often fail with functional data [32] we formulate a test for interaction between two genomic regions in multiple quantitative trait analysis as a multiple functional regression (MFRG) model [33] with scalar response. In the MFRG model the genotype functions (genetic variant
profiles) are defined as a function of the genomic position of the genetic variants rather than a set of discrete genotype values and the quantitative trait is predicted by genotype functions with their interaction terms. By functional principal component analysis, the genotype functions are expanded as a few functional principal components (FPC) and the MFRG model is transformed to the classical multivariate regression model (MRG) in which FPC scores are taken as variates. Statistics are developed in this publication which can be applied to pairwise interaction tests and gene-based interaction tests for multiple phenotypes. By investigating SNP-SNP interactions or gene-gene interactions that are shared across multiple traits, pleiotropic epistasis can be studied.
To evaluate performance for multiple traits epistasis analysis, large scale simulations are used to calculate the Type I error rates of the MFRG for testing interaction between two geno-mic regions with multiple phenotypes and to compare power with multivariate pair-wise inter-action analysis and single trait interinter-action analysis by functional regression (FRG) model. To further evaluate performance, the MFRG for epistasis analysis is applied to five traits: high den-sity lipoprotein (HDL), low denden-sity lipoprotein (LDL), total cholesterol, systolic blood pressure (SBP), and diastolic blood pressure (DBP), from exome sequence data from the NHLBI’s Exome Sequencing Project (ESP) to detect pleiotropic epistasis.
Methods
Assume thatnindividuals are sampled. Letyik,k= 1,2,. . .,K, be thek-th trait values of thei-th
individual. Consider two genomic regions [a1,b1] and [a2,b2]. Letxi(t) andxi(s) be genotypic
functions of thei-th individual defined in the regions [a1,b1] and [a2,b2], respectively. Letyi=
[yi1,. . .,yiK]Tbe the vector of the trait values measured on thei-th individual. Lettandsbe a
genomic position in the first and second genomic regions, respectively. Define a genotype pro-filexi(t) of the i-th individual as
XiðtÞ ¼
(
0; mm1; Mm
2; MM ;
where M and m are two alleles of the marker at the genomic positiont. Recall that a regression model for interaction analysis with thek-th trait is defined as
yik¼μkþ XD
d¼1νidτkdþ XJ
1
j¼1
xijαkjþ XJ
2
l¼1
zilβklþ XJ
1
j¼1 XJ
2
l¼1
xijzilγkjlþεik; ð1Þ
whereμkis an overall mean of thek-th trait,zkdis the coefficient associated with the covariateνd,
αkjis the main genetic additive effect of thej-th SNP in thefirst genomic region for thek-th trait,
βklis the main genetic additive effect of thel-th SNP in the second genomic region for thek-th trait,γkjlis an additive × additive interaction effect between thej-th SNP in thefirst genomic
region and thel-th SNP in the second genomic region for thek-th trait;xijandzilare indicator
variableS for the genotypes at thej-th SNP and thel-th SNP, respectively;εik,k= 1,..,Kare
inde-pendent and identically distributed normal variables with mean of zero and covariance matrixS. Similar to the multiple regression models for interaction analysis with multiple quantitative traits, the functional regression model for a quantitative trait can be defined as
yik¼α0kþ XD
d¼1νidτkdþ Z
T
αkðtÞxiðtÞdtþ Z
S
βkðsÞxiðsÞdsþ Z
T Z
S
γkðt;sÞxiðtÞxiðsÞdtdsþεik; ð2Þ
putative QTLs located at the genomic positionstands, respectively;γk(t,s) is the interaction effect between two putative QTLs located at the genomic positionstandsfor thek-th trait,k= 1,. . .,K,xi(t)
andxi(s) are genotype profiles, andεikare independent and identically distributed normal variables with mean of zero and covariance matrixS. Consider covariates in the model (2) allows incorporating PCA scores for population stratification, sex, age, BMI and other biomarkers into the model.
Estimation of Interaction Effects
We assume that both phenotypes and genotype profiles are centered. The genotype profiles
xi(t) andxi(s) are expanded in terms of the orthonormal basis function as:
xiðtÞ ¼ X1
j¼1
xijjðtÞand
xiðsÞ ¼ X1
l¼1
ZilclðsÞ; ð3Þ
whereϕj(t) andψl(s) are sequences of the orthonormal basis functions. The more number of
variants in the genes the more accurate the eigenfunction expansion. If the number of variants is less than 3 the eigenfunction expansion of the genotypic profiles is impossible. MFRG can only be used for gene with more than 3 variants.
In practice, numerical methods for the integral will be used to calculate the expansion coeffi-cients. Substituting Eq (3) into Eq (2), we obtain (Appendix)
yik¼α0kþ XD
d¼1νidτkdþ
X1
j¼1 ξijαkjþ
X1
l¼1 ηilβklþ
X1
j¼1
X1
l¼1
ξijηilγkjlþεik;i¼1;. . .;n;k¼1;. . .;K; ð4Þ
The parametersαkj,βklandγkjlare referred to as genetic additive and additive × additive
effect scores for thek-th trait. These scores can also be viewed as the expansion coefficients of the genetic effect functions with respect to orthonormal basis functions.
Then, Eq (4) can be approximated by (Appendix)
Y¼eα0þντþξαþηβþΓγþε
¼WBþε; ð5Þ
whereW¼ ½e ν x η ΓandB¼
α0 τ α β γ 2 6 6 6 6 6 6 6 6 4 3 7 7 7 7 7 7 7 7 5 .
Therefore, we transform the original functional regression interaction model into the classi-cal multivariate regression interaction model by eigenfunction expansions. All methods for multivariate regression interaction analysis can directly be used for solving problem (5).
The standard least square estimators of B and the variance covariance matrixSare, respec-tively, given by
^
B¼ ðWTWÞ 1
WTY; ð6Þ
^ S¼1
nðY WBÞ
T
Denote the lastJLrow of the matrix (WTW)−1WTbyA. Then, the estimator of the
parame-terγis given by
^
γ¼AY: ð8Þ
The vector of the matrixγcan be written as
vecðγ^Þ ¼ ðIAÞvecðYÞ: ð9Þ
By the assumption of the variance matrix ofY, we obtain the variance matrix ofvec(Y):
varðvecðYÞÞ ¼SI: ð10Þ
Thus, it follows from Eqs (9) and (10) that
Λ ¼varðvecðγ^ÞÞ ¼ ðIAÞðSIÞðIATÞ
¼S ðAATÞ: ð11Þ
Test Statistics
An essential problem in genetic interaction studies of the quantitative traits is to test the inter-action between two genomic regions (or genes). Formally, we investigate the problem of testing the following hypothesis:
γkðt;sÞ ¼0;8t2 ½a
1;b1;s2 ½a2;b2;k¼1;. . .;K;
which is equivalent to testing the hypothesis:
H0 : g¼0:
Define the test statistic for testing the interaction between two genomic regions [a1,b1] and
[a2,b2] withKquantitative traits as
TI¼ ðvecð^γÞÞ T
Λ 1
vecðγ^Þ: ð12Þ
Then, under the null hypothesisH0:γ= 0,TIis asymptotically distributed as a centralw
2 ðKJLÞ dis-tribution ifJLcomponents are taken in the expansion Eq (3).
Group tests often make implicit homogeneity assumptions where all putatively functional variants within the same genomic region are assumed to have the same direction of effects. However, in practice, the variants with opposite directions of effects will be simultaneously pre-sented in the same genomic region. MFRG can efficiently use information of both risk and pro-tective variants and allow for sign and size heterogeneity of genetic variants. In general, the trait increasing and decreasing variants will be present in different locations in the genomic region. Information of trait increasing and decreasing variants usually will be reflected in dif-ferent eigenfunctions and hence will be included in difdif-ferent functional principal component scores. The MFRG test statistic is essentially to summarize the square of the functional princi-pal component scores. Therefore, the opposite effects of trait increasing and decreasing vari-ants on the phenotype will not compromise each other in the MFRG test statistics. The MFRG statistics automatically take the opposite effects of the trait increasing and decreasing variants on the phenotype into account and do not require additional computations. MFRG will take the sign and size heterogeneity of the variants into account and be less sensitive to the presence of variants with opposite directions of effect.
SettingW¼ ½W1 W2, we can write the model as
E½Y ¼W1 a
b " #
þW2g:
UnderH0:γ= 0, we have the model:
Y ¼W1
a
b " #
þε:
The estimators will be
^ a ^ b " #
¼ ðWT 1W1Þ
1
WT 1Yand
^ S1¼
1
nðY W1
^ a ^ b " #
ÞTðY W1 ^ a ^ b " # Þ:
The likelihood for the full model and reduced model are, respectively, given by
Lða^;b^;^g;S^Þ ¼ e nK=2
ð2pÞnK=2jS^jn=2 and
Lð^a;b^;S^ 1Þ ¼
e nK=2 ð2pÞnK=2jS^
1j n=2:
The likelihood-ratio-based statistic for testing interaction between two genomic regions with multivariate traits is defined as
TIL ¼ nlog
j^ Sj j^
S1j !
: ð13Þ
Under the null hypothesisH0:γ= 0,TIΛis asymptotically distributed as a centralw
2 ðKJLÞ dis-tribution ifJLcomponents are taken in the expansion Eq (3).
Simulation Model for Type 1 Error Rate Calculation
The genetic models for simulations to calculate Type 1 error rates of the tests are briefly given below. We first assume the model with no marginal effects for all traits:
Yi¼mþεi; i¼1;. . .;n;
whereYi= [yi1,. . .,yik],μ= [μ1,. . .,μk], andεiis distributed as
½ε1 . . . εk N ½0 . . . 0;
1 0:5
. . . . . . . . .
0:5 1 0 B B B B B B @ 1 C C C C C C A 0 B B B B B B @ 1 C C C C C C A :
Then, we considered the model with marginal genetic effect (additive model) at one gene:
yik¼mkþ XJ
where
xij¼
(
2ð1 PjÞ AjAj 1 2P
j Ajaj
2P
j ajaj
; ak¼ ðrk 1Þf0;
wherePjis a frequency of the alleleAj,rkis a risk parameter of thek-th trait which was randomly
selected from 1.1 to 1.6. The risk parameter affect the genetic effects and is used to control the contribution effort by genotype to the phenotype. The risk parameter influences the relative mag-nitude of the genetic effects.f0is a baseline penetrance and set to 1 andεare defined as before.
Finally, we consider the model with marginal genetic effects (additive model) at both genes:
yik¼mkþ XJ
j¼1xijakjþ XL
l¼1zilbklþεik; where
xij¼
2ð1 PjÞ AjAj 1 2P
j Ajaj
2P
j ajaj ; zil¼
(
2ð1 qlÞ BlBl
1 2q l Blbl
2q l blbl
; akj¼ak¼ ðrpk 1Þf0;bkl¼bk¼ ðrqk 1Þf0; 8
> > > > <
> > > > :
Pjandqlare frequencies of the allelesAjandBl, respectively,rpkandrqkare risk parameters
of thek-th trait for the SNPs in the first and second genes, respectively, and randomly selected from 1.1 to 1.6,f0is a baseline penetrance and set to 1 andεare defined as before.
Results
Null Distribution of Test Statistics
To examine the null distribution of test statistics, we performed a series of simulation studies to compare their empirical levels with the nominal ones. We calculated the Type I error rates for rare alleles, and common alleles. To make simulations more close to real whole exome sequencing data, we generated 50,000 datasets consisting of 1,000,000 chromosomes randomly sampled from the NHLBI’s Exome Sequencing Project (ESP) with 2,016 individuals and 18,587 genes. Each dataset included randomly selected a pair of genes from sequenced 18,587 genes. We randomly selected 20% of SNPs from each gene as causal variants. The number of sampled individuals from populations of 1,000,000 chromosomes ranged from 1,000 to 5,000. For each dataset, we repeated 5,000 simulations. We presented average type I error rates over 50,000 randomly selected pairs of genes from whole exome sequencing ESP dataset.
Table 1andS1andS2Tables summarized the average Type I error rates of the test statistics for testing the interaction between two genes with no marginal effect and consisting of only rare variants with 5 traits, 2 traits and 10 traits, respectively, over 50,000 pairs of genes at the nominal levelsα= 0.05,α= 0.01 andα= 0.001.Table 2andS3andS4Tables summarized the average Type I error rates of the test statistics for testing the interaction between two genes with marginal effect at one gene consisting of only rare variants with 5 traits, 2 traits and 10 traits, respectively, over 50,000 pairs of genes at the nominal levelsα= 0.05,α= 0.01 andα= 0.001.Table 3andS5
consisting of only common variants with 5 traits, 2 and 10 traits, respectively, over 10 pairs of genes at the nominal levelsα= 0.05,α= 0.01 andα= 0.001, inTable 4andS7andS8Tables, respectively. The statistics for testing interaction between two genomic regions with only common variants have the similar Type 1 error rates in the other two scenarios: with marginal genetic effects at one gene or without marginal genetic effects at two genes. These results clearly showed that the Type I error rates of the MFRG-based test statistics for testing interaction between two genes with multiple traits and common variants with or without marginal effects were not appre-ciably different from the nominalαlevels. For the rare variants when the sample sizes increased to 5,000, the Type 1 error rates were still not appreciably different from the nominal levels.
Power Evaluation
To evaluate the performance of the MFRG models for interaction analysis of multiple traits, we used simulated data to estimate their power to detect interaction between two genes for two, four, five, six and ten quantitative traits. A true multiple quantitative genetic model is given as fol-lows. ConsiderHpairs of quantitative trait loci (QTL) from two genes (genomic regions). LetQh1
andqh1be two alleles at thefirst QTL, andQh2andqh2be two alleles at the second QTL, for theH
pair of QTLs. Letuijklbe the genotypes of theu-th individual withij¼Qh1Qh1;Qh1qh1;qh1qh1and kl¼Qh2Qh2;Qh2qh2;qh2qh2, andgmuijklbe its genotypic value for them-th trait. The following
mul-tiple regression is used as a genetic model for them-th quantitative trait:
ymu¼ XH
h¼1
gh
muijklþεmu; u¼1;2;. . .;n;m¼1;. . .;M;
wheregh
muijklis a genotypic value of theh-th pair of QTLs for them-th quantitative trait andεmu
are distributed as½ε1 . . . εm N ½0 . . . 0;
1 0:5
. . . . . . . . .
0:5 1 0 B B B B B B @ 1 C C C C C C A 0 B B B B B B @ 1 C C C C C C A .
Table 1. Average type 1 error rates of the statistic for testing interaction between two genes with no marginal effect consisting only rare variants with 5 traits over random selected 50,000 pairs of genes from whole exome.
Sample Size 0.05 0.01 0.001
1000 0.0784 0.0188 0.0019
2000 0.0693 0.0097 0.0016
3000 0.0617 0.0135 0.0010
4000 0.0591 0.0126 0.0014
5000 0.0546 0.0095 0.0012
doi:10.1371/journal.pgen.1005965.t001
Table 2. Average type 1 error rates of the statistic for testing interaction between two genes with mar-ginal effect at one gene consisting only rare variants with 5 traits over randomly selected 50,000 pairs of genes from the whole exome.
Sample Size 0.05 0.01 0.001
1000 0.0785 0.0177 0.0018
2000 0.0672 0.0154 0.0017
3000 0.0604 0.0149 0.0010
4000 0.0555 0.0120 0.0012
5000 0.0510 0.0132 0.0009
Four models of interactions are considered: (1) Dominant OR Dominant, (2) Dominant AND Dominant, (3) Recessive OR Recessive and (4) Threshold model (S9 Table). We assume that the genotypes at two loci affect a complex trait. Intuitively, Dominant OR Dominant model means that presence of risk allele at least one locus will cause the phenotype variation. Dominant AND Dominant model means that only when risk alleles at both loci are present the phenotype variation can be affected. Recessive OR recessive model indicates that when both risk alleles are at least present at one locus the phenotype variation can be observed. Threshold model implies that when two risk alleles at one locus and at least one risk allele at another locus are present, the phenotype variation will be observed. Recessive AND Recessive model is excluded due to low fre-quency of that condition with rare variants. The risk parameterrvaries from 0 to 1.
We generated 2,000,000 chromosomes by resampling from 2,016 individuals of European origin with variants in random two genes selected from the NHLBI’s Exome Sequencing Proj-ect (ESP). Two haplotypes were randomly sampled from the population and assigned to an individual. We randomly selected 20% of the variants as causal variants. A total of 2,000 indi-viduals for the four interaction models were sampled from the populations. A total of 1,000 simulations were repeated for the power calculation.
The power of the proposed MFRG model is compared with the single trait functional regres-sion (SFRG) model, the multi-trait pair-wise interaction test and the regresregres-sion on principal components (PCs). For SNPs genotypes in each genomic region principal component analysis (PCA) were performed. The number of principal components for each individual which can explain 80% of the total genetic variation in the genomic region will be selected as the variables. Specifically, the principal component score of the i-th individual in the first and second geno-mic regions are denoted byxi1;. . .;xik1andzi1;. . .zik2, respectively. The regression model for detection of interaction for the m-th trait is then given by
ymi¼mmþ Xk
1
j¼1
xijamjþ Xk
2
l¼1
zilbmlþ Xk
1
j¼1 Xk
2
l¼1
xijzilgmjlþεmi:
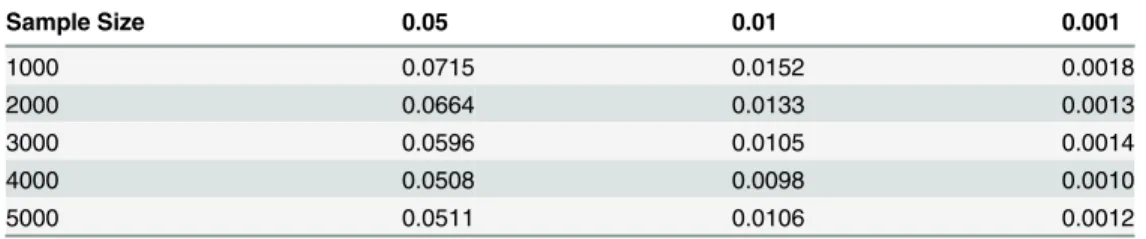
Table 3. Average type 1 error rates of the statistic for testing interaction between two genes with mar-ginal effects at two genes consisting only rare variants with 5 traits over randomly selected 50,000 pairs of genes from the whole exome.
Sample Size 0.05 0.01 0.001
1000 0.0715 0.0152 0.0018
2000 0.0664 0.0133 0.0013
3000 0.0596 0.0105 0.0014
4000 0.0508 0.0098 0.0010
5000 0.0511 0.0106 0.0012
doi:10.1371/journal.pgen.1005965.t003
Table 4. Average type 1 error rates of the statistic for testing interaction between two genes with mar-ginal effects at two genes consisting only common variants with 5 traits over randomly selected 50,000 pairs of genes from the whole exome.
Sample Size 0.05 0.01 0.001
1000 0.0529 0.0112 0.0011
2000 0.0513 0.0098 0.0013
3000 0.0499 0.0101 0.0009
4000 0.0471 0.0094 0.0010
5000 0.0469 0.0102 0.0008
The power of the MFRG is compared with the traditional point-wise interaction test which takes the following model:
ymi¼mmþxi1am1þxi2am2þxi1xi2gmþεmi;i¼1;. . .;n;m¼1;. . .;M:
For a pair of genes, we assume that the first gene hask1SNPs, and the second gene hask2
SNPs, then, the total number of all possible pairs isk=k1×k2. For each pair of SNPs, we
calcu-lated a statistic for testing pair-wise interactionTmjpair. Finally, the maximum ofTmjpair:Tmax=
max(T1,1pair,T1,2pair,. . .,T1,kpair,. . .,TM,1pair,. . .,TM,kpair) is computed.
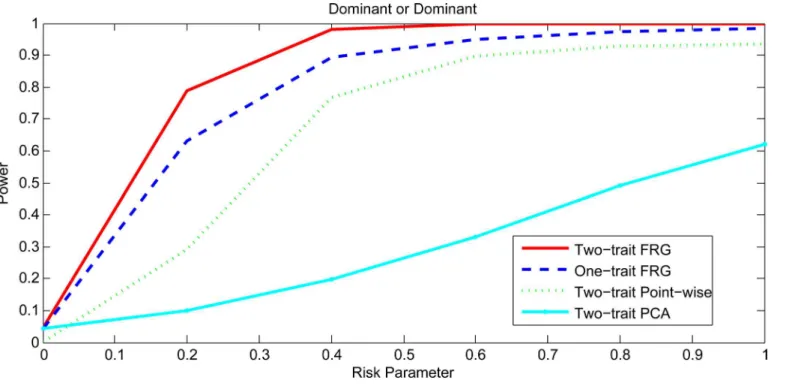
Figs1and2,S1 FigandS2 Figplotted the power curves of the two-trait FRG, single trait FRG, two-trait regression on PCs and two-trait pair-wise interaction tests for a quantitative trait under Dominant OR Dominant, Dominant AND Dominant, Threshold, and Recessive OR Recessive models, respectively. Only two genes include rare variants. These power curves are a function of the risk parameter at the significance levelα= 0.05. Permutations in the point-wise interaction tests were used to adjust for multiple testing. In all cases, the two-trait FRG had the highest power to detect epistasis. We observed two remarkable features. First, two-trait test had higher power than the one-trait test. Second, the two-trait FRG had the high-est power among all two-trait thigh-ests.
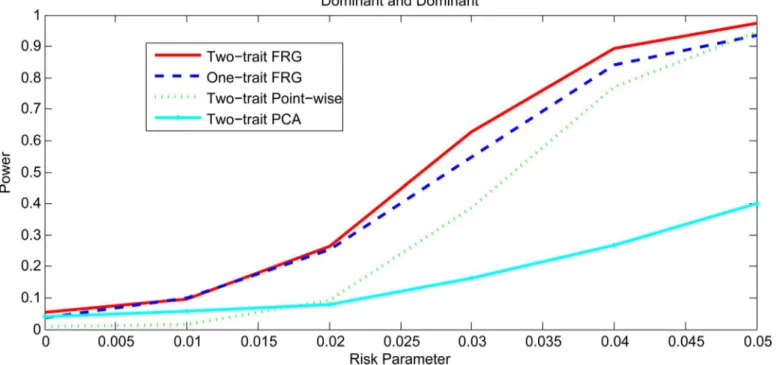
Figs3and4,S3 FigandS4 Figplotted the power curves of the two-trait FRG, single trait FRG, two-trait regression on PCs and two-trait pair-wise interaction tests for a quantitative trait under Dominant OR Dominant, Dominant AND Dominant, Threshold and Recessive OR Recessive models, respectively. Only two genes include common variants. These power curves are a function of the risk parameter at the significance levelα= 0.05. Permutations in the point-wise interaction tests were used to adjust for multiple testing. These figures showed that the power patterns of the epistasis tests for common variants were similar to that for rare variants.
Fig 1. Power curves under Dominant OR Dominant with two genes including rare variants only.
Next we investigate the impact of the number of traits on the power.Fig 5plotted the power curves of two-trait FRG, four-trait FRG, five-trait FRG, six-trait FRG and ten-trait FRG under Dominant OR Dominant interaction model.Fig 5showed that if the multiple phenotypes are correlated then the power of the MFRG to detect epistasis will increase as the number of phe-notypes increases.
Fig 2. Power curves under Dominant AND Dominant with two genes including rare variants only.
doi:10.1371/journal.pgen.1005965.g002
Fig 3. Power curves under Dominant OR Dominant with two genes including common variants only.
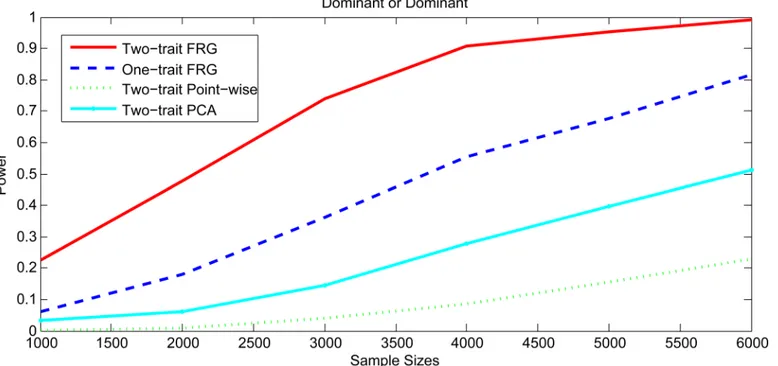
To investigate the impact of sample size on the power, we plottedFig 6andS5–S7Figs showing the power of three statistics for testing the interaction between two genomic regions (or genes) with only rare variants as a function of sample sizes under four interaction models, assuming 20% of the risk rare variants and the risk parameterr= 0.05 for Dominant OR
Fig 4. Power curves under Dominant AND Dominant with two genes including common variants only.
doi:10.1371/journal.pgen.1005965.g004
Fig 5. Power curves of MFRG with different trait number under Dominant OR Dominant.
Dominant, Dominant AND Dominant, and Recessive OR Recessive, andr= 0.5 for Threshold models, respectively. Again, we observed that the power of the two-trait FRG was the highest.
Application to Real Data Examples
To further evaluate the performance, the MFRG for testing epistasis was applied to data from the NHLBI’s ESP Project. Five phenotypes: HDL, LDL, total cholesterol, SBP and DBP were considered with a total of 2,016 individuals of European origin from 15 different cohorts in the ESP Project. No evidence of cohort- and/or phenotype-specific effects, or other systematic biases was found [34]. Exomes from related individuals were excluded from further analysis. We took the rank-based inverse normal transformation of the phenotypes [35] as trait values. The total number of genes tested for interactions which included both common and rare vari-ants was 18,587. The remaining annotated human genes which did not contain any SNPs in our dataset were excluded from the analysis. A P-value for declaring significant interaction after applying the Bonferroni correction for multiple tests was 2.89×10⁻¹⁰. Population
stratifi-cation may inflate the test statistics. To reduce the inflation, the standard strategy is to adjust for population stratification via principal components. All the tests were adjusted for sex, age and population stratification via 5 principal components.
To examine the behavior of the MFRG, we plotted the QQ plot of the two-trait FRG test (Fig 7). The QQ plots showed that the false positive rate of the MFRG for detection of interac-tion in some degree is controlled.
A total of 91 pairs of genes which were derived from 85 genes showed significant evidence of epistasis with P-values<2.7×10⁻¹⁰which were calculated using the MFRG model and
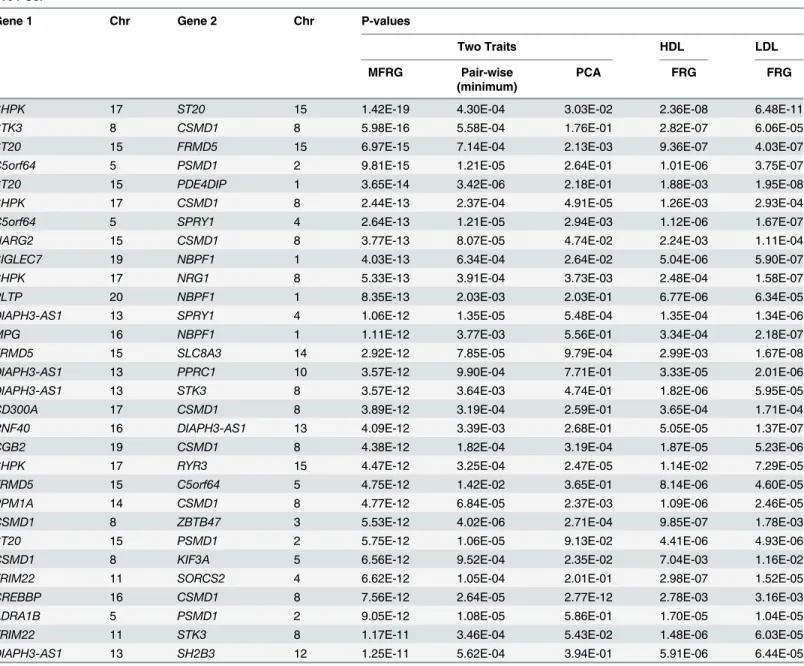
simultaneously analyzing interaction of inverse normally transformed HDL and LDL (S10 Table). The top 30 pairs of significantly interacted genes with HDL and LDL were listed in
Table 5. InTable 5andS10 Table, P-values for testing interactions between genes by regression on PCA and the minimum of P-values for testing all possible pairs of SNPs between two genes
Fig 6. Power curves as a function of sample sizes under Dominant OR Dominant with two genes including rare variants only.
using standard regression model simultaneously analyzed for the HDL and LDL and P-values for testing epistasis by the FRG separately against single trait HDL or LDL were also listed.
Several remarkable features from these results were observed. First, we observed that although pairs of genes showed no strong evidence of interactions influencing individual trait HDL or LDL, they indeed demonstrated significant interactions if interactions were simulta-neously analyzed for correlated HDL and LDL. Second, the MFRG often had a much smaller P-value to detect interaction than regression on the PCA and the minimum of P-values of pair-wise tests.
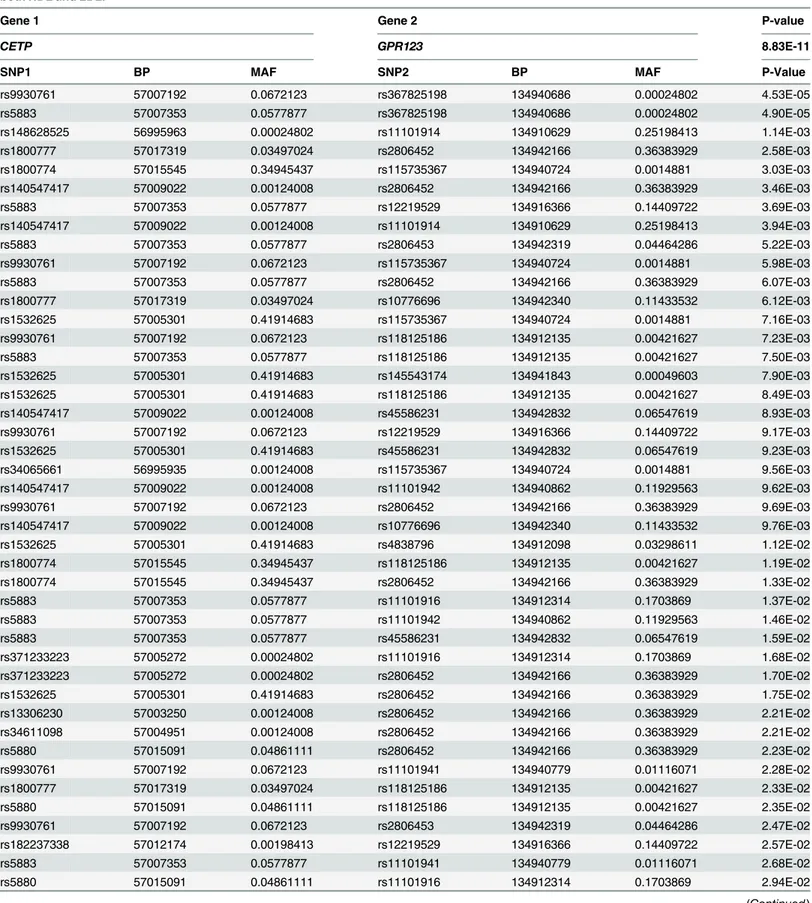
Third, pairs of SNPs between two genes jointly have significant interaction effects, but indi-vidually each pair of SNPs make mild contributions to the interaction effects as shown in
Table 6. There were a total of 60 pairs of SNPs between genesCETPon chromosome 16 and
GPR123on chromosome 10 with P-values<0.0488. None of the 60 pairs of SNPs showed strong evidence of interaction. However, a number of pairs of SNPs between genesCETPand
GPR123collectively demonstrated significant interaction influencing the traits HDL and LDL. Fourth, 91 pairs of interacting genes formed a network (Fig 8). The genesC5orf64that had interactions with 19 genes,CSMD1that had interactions with 20 genes, were hub genes in the network. 26 genes out of total 85 genes in the network were mainly located in 18 pathways. Each of 12 pathways included at least two interacting genes. However, the majority of interact-ing genes are located in different pathways. Among 18 pathways, calcium signalinteract-ing pathway mediates the effect of LDL and plays a role in control of atherosclerosis susceptibility [36], LDL-cholesterol has multiple roles in regulating focal adhesion dynamics [37], LDL is involved in free radical induced apoptosis pathway [38], MAPK and JAK-STAT pathways are involved in dietary flavonoid protection against oxidized LDL [39], up-regulation of autophagy via AMPK/mTOR signaling pathway alleviates oxidized -LDL induced inflammation [40], PPARα
Fig 7. QQ plot of the two-trait FRG test adjusted for sex, age and population stratification via five PCs.
holds a fundamental role in control of lipid homeostasis [41] and lectin-like ox-LDL receptor 1 mediates PKC-α/ERK/PPAR-γ/MMP pathway [42], HDL reduces the TGF-β1-induced colla-gen deposition [43], the Wnt pathway plays an important role in lipid storage and homeostasis [44], From the literatures, we found that both common and rare variants inCETPwere associ-ated with the HDL [45],CREBBPregulated LDL receptor transcription [46],PLTPwas associ-ated with HDL and LDL [47],TMEM57was associated with serum lipid levels [48],SH2B3was associated with LDL cholesterol [49]. It was also reported thatCSMD1was associated with multivariate phenotype defined as low levels of low density lipoprotein cholesterol
(LDL-C<or = 100 mg/dl) and high levels of triglycerides (TG>or = 180 mg/dl) [50], associ-ated with hypertension [51]. It was also reported thatCSMD1was associated with LDL and total cholesterol [52].
Table 5. P-values of top 30 pairs of significantly interacted genes with HDL and LDL after adjusting for sex, age and population stratification via five PCs.
Gene 1 Chr Gene 2 Chr P-values
Two Traits HDL LDL
MFRG Pair-wise PCA FRG FRG
(minimum)
SHPK 17 ST20 15 1.42E-19 4.30E-04 3.03E-02 2.36E-08 6.48E-11
STK3 8 CSMD1 8 5.98E-16 5.58E-04 1.76E-01 2.82E-07 6.06E-05 ST20 15 FRMD5 15 6.97E-15 7.14E-04 2.13E-03 9.36E-07 4.03E-07 C5orf64 5 PSMD1 2 9.81E-15 1.21E-05 2.64E-01 1.01E-06 3.75E-07 ST20 15 PDE4DIP 1 3.65E-14 3.42E-06 2.18E-01 1.88E-03 1.95E-08 SHPK 17 CSMD1 8 2.44E-13 2.37E-04 4.91E-05 1.26E-03 2.93E-04 C5orf64 5 SPRY1 4 2.64E-13 1.21E-05 2.94E-03 1.12E-06 1.67E-07 NARG2 15 CSMD1 8 3.77E-13 8.07E-05 4.74E-02 2.24E-03 1.11E-04 SIGLEC7 19 NBPF1 1 4.03E-13 6.34E-04 2.64E-02 5.04E-06 5.90E-07
SHPK 17 NRG1 8 5.33E-13 3.91E-04 3.73E-03 2.48E-04 1.58E-07
PLTP 20 NBPF1 1 8.35E-13 2.03E-03 2.03E-01 6.77E-06 6.34E-05 DIAPH3-AS1 13 SPRY1 4 1.06E-12 1.35E-05 5.48E-04 1.35E-04 1.34E-06 MPG 16 NBPF1 1 1.11E-12 3.77E-03 5.56E-01 3.34E-04 2.18E-07 FRMD5 15 SLC8A3 14 2.92E-12 7.85E-05 9.79E-04 2.99E-03 1.67E-08 DIAPH3-AS1 13 PPRC1 10 3.57E-12 9.90E-04 7.71E-01 3.33E-05 2.01E-06 DIAPH3-AS1 13 STK3 8 3.57E-12 3.64E-03 4.74E-01 1.82E-06 5.95E-05 CD300A 17 CSMD1 8 3.89E-12 3.19E-04 2.59E-01 3.65E-04 1.71E-04 RNF40 16 DIAPH3-AS1 13 4.09E-12 3.39E-03 2.68E-01 5.05E-05 1.37E-07 CGB2 19 CSMD1 8 4.38E-12 1.82E-04 3.19E-04 1.87E-05 5.23E-06
SHPK 17 RYR3 15 4.47E-12 3.25E-04 2.47E-05 1.14E-02 7.29E-05
Table 6. P-values of 60 pairs of SNPs between genes CETP on chromosome 16 and GPR123 on chromosome 10 for testing interaction affecting both HDL and LDL.
Gene 1 Gene 2 P-value
CETP GPR123 8.83E-11
SNP1 BP MAF SNP2 BP MAF P-Value
rs9930761 57007192 0.0672123 rs367825198 134940686 0.00024802 4.53E-05
rs5883 57007353 0.0577877 rs367825198 134940686 0.00024802 4.90E-05
rs148628525 56995963 0.00024802 rs11101914 134910629 0.25198413 1.14E-03
rs1800777 57017319 0.03497024 rs2806452 134942166 0.36383929 2.58E-03
rs1800774 57015545 0.34945437 rs115735367 134940724 0.0014881 3.03E-03
rs140547417 57009022 0.00124008 rs2806452 134942166 0.36383929 3.46E-03
rs5883 57007353 0.0577877 rs12219529 134916366 0.14409722 3.69E-03
rs140547417 57009022 0.00124008 rs11101914 134910629 0.25198413 3.94E-03
rs5883 57007353 0.0577877 rs2806453 134942319 0.04464286 5.22E-03
rs9930761 57007192 0.0672123 rs115735367 134940724 0.0014881 5.98E-03
rs5883 57007353 0.0577877 rs2806452 134942166 0.36383929 6.07E-03
rs1800777 57017319 0.03497024 rs10776696 134942340 0.11433532 6.12E-03
rs1532625 57005301 0.41914683 rs115735367 134940724 0.0014881 7.16E-03
rs9930761 57007192 0.0672123 rs118125186 134912135 0.00421627 7.23E-03
rs5883 57007353 0.0577877 rs118125186 134912135 0.00421627 7.50E-03
rs1532625 57005301 0.41914683 rs145543174 134941843 0.00049603 7.90E-03
rs1532625 57005301 0.41914683 rs118125186 134912135 0.00421627 8.49E-03
rs140547417 57009022 0.00124008 rs45586231 134942832 0.06547619 8.93E-03
rs9930761 57007192 0.0672123 rs12219529 134916366 0.14409722 9.17E-03
rs1532625 57005301 0.41914683 rs45586231 134942832 0.06547619 9.23E-03
rs34065661 56995935 0.00124008 rs115735367 134940724 0.0014881 9.56E-03
rs140547417 57009022 0.00124008 rs11101942 134940862 0.11929563 9.62E-03
rs9930761 57007192 0.0672123 rs2806452 134942166 0.36383929 9.69E-03
rs140547417 57009022 0.00124008 rs10776696 134942340 0.11433532 9.76E-03
rs1532625 57005301 0.41914683 rs4838796 134912098 0.03298611 1.12E-02
rs1800774 57015545 0.34945437 rs118125186 134912135 0.00421627 1.19E-02
rs1800774 57015545 0.34945437 rs2806452 134942166 0.36383929 1.33E-02
rs5883 57007353 0.0577877 rs11101916 134912314 0.1703869 1.37E-02
rs5883 57007353 0.0577877 rs11101942 134940862 0.11929563 1.46E-02
rs5883 57007353 0.0577877 rs45586231 134942832 0.06547619 1.59E-02
rs371233223 57005272 0.00024802 rs11101916 134912314 0.1703869 1.68E-02
rs371233223 57005272 0.00024802 rs2806452 134942166 0.36383929 1.70E-02
rs1532625 57005301 0.41914683 rs2806452 134942166 0.36383929 1.75E-02
rs13306230 57003250 0.00124008 rs2806452 134942166 0.36383929 2.21E-02
rs34611098 57004951 0.00124008 rs2806452 134942166 0.36383929 2.21E-02
rs5880 57015091 0.04861111 rs2806452 134942166 0.36383929 2.23E-02
rs9930761 57007192 0.0672123 rs11101941 134940779 0.01116071 2.28E-02
rs1800777 57017319 0.03497024 rs118125186 134912135 0.00421627 2.33E-02
rs5880 57015091 0.04861111 rs118125186 134912135 0.00421627 2.35E-02
rs9930761 57007192 0.0672123 rs2806453 134942319 0.04464286 2.47E-02
rs182237338 57012174 0.00198413 rs12219529 134916366 0.14409722 2.57E-02
rs5883 57007353 0.0577877 rs11101941 134940779 0.01116071 2.68E-02
rs5880 57015091 0.04861111 rs11101916 134912314 0.1703869 2.94E-02
Next we analyzed five traits: HDL, LDL, SBP, DBP and TOTCHOL. Again, for each trait, inverse normal rank transformation was conducted to ensure that the normality assumption of the transformed trait variable was valid. To examine the behavior of the MFRG, we plotted QQ
Table 6. (Continued)
Gene 1 Gene 2 P-value
CETP GPR123 8.83E-11
SNP1 BP MAF SNP2 BP MAF P-Value
rs9930761 57007192 0.0672123 rs45586231 134942832 0.06547619 2.95E-02
rs9930761 57007192 0.0672123 rs11101914 134910629 0.25198413 3.19E-02
rs376545293 57016085 0.00024802 rs11101916 134912314 0.1703869 3.23E-02
rs9930761 57007192 0.0672123 rs11101942 134940862 0.11929563 3.24E-02
rs376545293 57016085 0.00024802 rs11101914 134910629 0.25198413 3.28E-02
rs139594305 57007286 0.00024802 rs4838796 134912098 0.03298611 3.46E-02
rs376545293 57016085 0.00024802 rs2806452 134942166 0.36383929 3.48E-02
rs139594305 57007286 0.00024802 rs12219529 134916366 0.14409722 3.55E-02
rs201267603 57005220 0.00099206 rs12219529 134916366 0.14409722 3.85E-02
rs13306230 57003250 0.00124008 rs11101916 134912314 0.1703869 4.00E-02
rs34611098 57004951 0.00124008 rs11101916 134912314 0.1703869 4.00E-02
rs9930761 57007192 0.0672123 rs11101916 134912314 0.1703869 4.11E-02
rs1800774 57015545 0.34945437 rs189113844 134941821 0.00173611 4.35E-02
rs1800774 57015545 0.34945437 rs11101941 134940779 0.01116071 4.38E-02
rs28381708 57007413 0.00124008 rs11101914 134910629 0.25198413 4.57E-02
rs34855278 57015076 0.0014881 rs11101914 134910629 0.25198413 4.69E-02
rs1532625 57005301 0.41914683 rs10776696 134942340 0.11433532 4.88E-02
doi:10.1371/journal.pgen.1005965.t006
Fig 8. Networks of 91 pairs of genes showing significant evidence of interactions as identified by MFRG.
plot of the test (S8 Fig). The QQ plots showed that the false positive rate of the MFRG for detection of interaction is controlled.
A total of 267 pairs of genes which were derived from 160 genes showed significant evidence of epistasis influencing five traits with P-values<1.96×10⁻¹⁰which were calculated using the
MFRG model (S11 Table). Of them formed a largest connected subnetwork (Fig 9). The top 25 pairs of significantly interacted genes with five traits were listed inTable 7. We observed the same pattern as was observed for the two traits: HDL and LDL. 46 genes out of 160 genes in the networks were mainly located in 42 pathways including 15 signaling pathways. Among them, 14 pathways were inFig 8. The interacting genes may be involved in the same biological path-way or in the different biological pathpath-ways. We observed 12 pathpath-ways, each of which contained at least two genes connected via interaction. However, the majority of interacting genes were not located in the same pathways.
Again, we observed that pairs of SNPs between two genes jointly have significant interaction effects, but individually each pair of SNPs might make mild contributions to the interaction effects as shown inS12 Table. There were a total of 6,766 pairs of SNPs between genesCSMD1
andFOXO1.S12 Tablelisted 101 pairs of SNPs with P-values<0.049. The majority of the 101 pairs of SNPs showed no strong evidence of interaction. However, they collectively demon-strated significant interaction influencing five traits.
Among 42 pathways, in the previous sections we reported that 14 pathways were associated with HDL and LDL. From the literatures, we also know that unsaturated fatty acids stimulated the uptake of the LDL particles [53], PPAR signaling pathway was correlated with blood pres-sure [54], purine metabolism was associated with SBP [55], Wnt signaling pathway mediated cholesterol transportation [56], glycerolipid metabolism pathway was correlated with total
Fig 9. Networks of 267 pairs of genes showing significant evidence of interactions as identified by MFRG.
cholesterol [57], focal adhesion pathway was involved in lipid modulation [58], Cell adhesion molecules was correlated with blood pressure [59].
We also observed from the literatures that a number of genes that appeared in the list of interacted genes with five traits had major genetic effects with single trait. Many reports showed thatCETP,LIPCandLIPGwere associated with HDL and LDL [60–62] and that
MTHRRhad known main effects for LDL [63] and blood pressure [64],NR1I3for lipid metab-olism [65],PLTPfor LDL [66],[67],FOXO1for LDL [68] and hypertension [69],SMAD9for hypertension [70], andCSMD1for SBP [51].
Discussion
Most genetic analyses of phenotypes have focused on analyzing single traits or, analyzing each phenotype independently. However, multiple phenotypes are highly correlated. Genetic vari-ants can be associated with more than one trait. Genetic pleiotropic effects likely play a crucial role in the molecular basis of correlated phenotypes. To address these central themes and criti-cal barriers in interaction analysis of multiple phenotypes, we shift the paradigm of interaction analysis from individual interaction analysis to pleiotropic interaction analysis and uncover the global organization of biological systems. MFRG was used to develop a novel statistical
Table 7. P-values of top 25 pairs of significantly interacted genes with five traits.
Gene 1 Gene 2 P-values
Five Traits LDL HDL SBP DBP TOTCHOL
MFRG Pair-wise(min) PCA FRG FRG FRG FRG FRG
PDZK1IP1 CSMD1 4.29E-35 5.61E-16 1.36E-10 4.52E-03 6.44E-02 8.62E-03 2.43E-03 1.19E-03 STK3 CSMD1 5.84E-34 3.39E-05 5.81E-03 6.06E-05 2.82E-07 1.37E-05 1.79E-05 3.22E-04 MEGF6 IRF2BPL 1.51E-31 2.55E-23 3.33E-18 7.65E-01 8.99E-02 2.75E-03 4.07E-02 1.25E-01 PLTP C5orf64 1.52E-31 2.96E-03 9.32E-01 1.77E-04 3.39E-07 3.37E-08 1.61E-06 3.26E-04 CSMD1 CCNDBP1 3.57E-31 1.66E-05 9.71E-04 1.14E-04 3.57E-03 8.80E-05 4.84E-04 8.23E-04 KIF3A C5orf64 1.06E-30 4.94E-05 5.63E-02 7.44E-05 1.21E-06 2.03E-03 1.50E-03 1.05E-03 CSMD1 KIF3A 1.10E-30 3.97E-05 1.13E-05 1.16E-02 7.04E-03 3.60E-01 3.54E-01 1.42E-02 ST20 PDE4DIP 1.93E-30 1.14E-06 6.03E-02 1.95E-08 1.88E-03 2.06E-03 3.22E-03 2.11E-06 CSMD1 NARG2 2.86E-30 3.97E-05 1.90E-06 1.11E-04 2.24E-03 1.78E-02 1.90E-03 3.56E-04 PDZK1IP1 ST20 3.17E-30 9.82E-16 2.09E-03 6.15E-03 1.34E-02 2.30E-03 7.63E-03 3.30E-03 CSMD1 FOXO1 3.32E-30 3.01E-19 2.59E-08 1.49E-06 2.61E-06 1.49E-05 9.21E-07 8.65E-07
SHPK ST20 1.11E-29 3.27E-03 9.68E-02 6.48E-11 2.36E-08 4.26E-04 8.34E-05 1.63E-09
framework for joint interaction analysis of multiple correlated phenotypes. By large simula-tions and real data analysis the merits and limitasimula-tions of the proposed new paradigm of joint interaction analysis of multiple phenotypes were demonstrated.
The new approach fully uses all phenotype correlation information to jointly analyze inter-action of multiple phenotypes. By large simulations and real data analysis, we showed that the proposed MFRG for joint interaction analysis of correlated multiple phenotypes substantially increased the power to detect interaction while keeping the Type 1 error rates of the test statis-tics under control. In real data analysis, we observed that although pairs of genes showed no strong evidence of interactions influencing individual trait, they indeed demonstrated signifi-cant interactions if interactions were simultaneously analyzed for correlated multiple traits.
Due to lack of power of the widely used statistics for testing interaction between loci and its computational intensity, exploration of genome-wide gene-gene interaction has been limited. Few significant interaction results have been observed. Many geneticists question the universe presence of significant gene-gene interaction. Our analysis showed that although the number of significantly interacted genes for single phenotype was small, the number of significantly interacted genes for multiple phenotypes substantially increased. Our results suggested that joint interaction analysis of multiple phenotypes should be advocated in future genetic studies of complex traits.
The interaction analysis for multiple phenotypes has been limited to common variants in carefully controlled experimental crosses and has mainly focused on the pair-wise interaction analysis. Although pair-wise interaction analysis is suitable for common variants, it is difficult to use to test interaction between rare and rare variants, and rare and common variants. There is an increasing need to develop statistics that can be used to test interactions among the entire allelic spectrum of variants for joint interaction analysis of multiple phenotypes. The MFRG utilizes the merits of taking genotype as functions and decomposes position varying genotype function into orthogonal eigenfunctions of genomic position. Only a few eigenfunctions that capture major information on genetic variation across the gene, are used to model the genetic variation. This substantially reduces the dimension in genetic variation of the data. The MFRG can efficiently test the interaction between rare and rare, rare and common, and common and common variants.
In both real data analysis of two phenotypes and five phenotypes, the interacted genes formed interaction networks. Hub genes in the interaction networks were also observed. These hub genes usually play an important biological role in causing phenotype variation.
An essential issue for interaction analysis of a large number of phenotypes is how to reduce dimension while fully exploiting complementary information in multiple phenotypes. The standard multivariate regression models for joint interaction analysis of multiple phenotypes do not explore the correlation structures of multiple phenotypes and reduce the dimensions of the phenotypes, and hence have limited power to detect pleotropic interaction effects due to large degrees of freedom. Data reduction techniques such as principal component analysis should be explored in the future interaction analysis of multiple phenotypes.
Supporting Information
S1 Fig. Power curves under Threshold with two genes including rare variants only. (TIF)
S2 Fig. Power curves under Recessive OR Recessive with two genes including rare variants only.
(TIF)
S3 Fig. Power curves under Threshold with two genes including common variants only. (TIF)
S4 Fig. Power curves under Recessive OR Recessive with two genes including common vari-ants only.
(TIF)
S5 Fig. Power curves of MFRG with different sample size under Dominant AND Domi-nant.
(TIF)
S6 Fig. Power curves of MFRG with different sample size under Recessive OR Recessive. (TIF)
S7 Fig. Power curves of MFRG with different sample size under Threshold. (TIF)
S8 Fig. QQ plot of the five-trait FRG test for the ESP dataset. (TIF)
S1 Table. Average type 1 error rates of the statistic for testing interaction between two genes with no marginal effect consisting of only rare variants with 2 traits over 10 pairs of genes.
(DOCX)
S2 Table. Average type 1 error rates of the statistic for testing interaction between two genes with no marginal effect consisting of only rare variants with 10 traits over 10 pairs of genes.
(DOCX)
S3 Table. Average type 1 error rates of the statistic for testing interaction between two genes with marginal effect consisting of only rare variants with 2 traits over 10 pairs of genes.
(DOCX)
S4 Table. Average type 1 error rates of the statistic for testing interaction between two genes with marginal effect at one gene consisting of only rare variants with 10 traits over 10 pairs of genes.
(DOCX)
S5 Table. Average type 1 error rates of the statistic for testing interaction between two genes with marginal effects at two genes consisting of only rare variants with 2 traits over 10 pairs of genes.
(DOCX)
10 pairs of genes. (DOCX)
S7 Table. Average type 1 error rates of the statistic for testing interaction between two genes with marginal effects at two genes consisting of only common variants with 2 traits over 10 pairs of genes.
(DOCX)
S8 Table. Average type 1 error rates of the statistic for testing interaction between two genes with marginal effects at two genes consisting of only common variants with 10 traits over 10 pairs of genes.
(DOCX)
S9 Table. The interaction models: 0 and r stand for a quantitative trait mean given the genotypes.
(DOCX)
S10 Table. P-values of significantly interacted genes with HDL and LDL. (XLSX)
S11 Table. P-values of significantly interacted genes with HDL, LDL, SBP, DBP and TOTCHOL.
(XLSX)
S12 Table. P-values of 101 pairs of SNPs between genes CSMD1 and FOXO1 for testing interaction affecting five traits.
(XLSX)
S1 Text. Appendix: Estimation of interaction effects. (DOCX)
Acknowledgments
Authors thank two anonymous reviewers for the thorough reading of the manuscript and thoughtful suggestions that improved the manuscript.
Author Contributions
Conceived and designed the experiments: MX. Performed the experiments: FZ ML. Analyzed the data: FZ ML. Contributed reagents/materials/analysis tools: DX. Wrote the paper: MX.
References
1. Wei WH, Hemani G, Haley CS (2014) Detecting epistasis in human complex traits. Nat Rev Genet 15: 722–733. doi:10.1038/nrg3747PMID:25200660
2. Cordell HJ (2002) Epistasis: what it means, what it doesn't mean, and statistical methods to detect it in humans. Hum Mol Genet 11: 2463–2468. PMID:12351582
3. Cordell HJ (2009) Detecting gene-gene interactions that underlie human diseases. Nat Rev Genet 10: 392–404. doi:10.1038/nrg2579PMID:19434077
4. Hemani G, Theocharidis A, Wei W, Haley C (2011) EpiGPU: exhaustive pairwise epistasis scans paral-lelized on consumer level graphics cards. Bioinformatics 27: 1462–1465. doi:10.1093/bioinformatics/ btr172PMID:21471009
6. Schupbach T, Xenarios I, Bergmann S, Kapur K (2010) FastEpistasis: a high performance computing solution for quantitative trait epistasis. Bioinformatics 26: 1468–1469. doi:10.1093/bioinformatics/ btq147PMID:20375113
7. Yung LS, Yang C, Wan X, Yu W (2011) GBOOST: a GPU-based tool for detecting gene-gene interac-tions in genome-wide case control studies. Bioinformatics 27: 1309–1310. doi:10.1093/bioinformatics/ btr114PMID:21372087
8. Zhang F, Boerwinkle E, Xiong M (2014) Epistasis analysis for quantitative traits by functional regression model. Genome Res 24: 989–998. doi:10.1101/gr.161760.113PMID:24803592
9. Hu JK, Wang X, Wang P (2014) Testing gene-gene interactions in genome wide association studies. Genet Epidemiol 38: 123–134. doi:10.1002/gepi.21786PMID:24431225
10. Kam-Thong T, Czamara D, Tsuda K, Borgwardt K, Lewis CM, et al. (2011) EPIBLASTER-fast exhaus-tive two-locus epistasis detection strategy using graphical processing units. Eur J Hum Genet 19: 465– 471. doi:10.1038/ejhg.2010.196PMID:21150885
11. Li J, Zhang K, Yi N (2011) A Bayesian hierarchical model for detecting haplotype-haplotype and haplo-type-environment interactions in genetic association studies. Hum Hered 71: 148–160. doi:10.1159/ 000324841PMID:21778734
12. Ueki M, Cordell HJ (2012) Improved statistics for genome-wide interaction analysis. PLoS Genet 8: e1002625. doi:10.1371/journal.pgen.1002625PMID:22496670
13. Wu X, Dong H, Luo L, Zhu Y, Peng G, et al. (2010) A novel statistic for genome-wide interaction analy-sis. PLoS Genet 6: e1001131. doi:10.1371/journal.pgen.1001131PMID:20885795
14. Zhang Y (2012) A novel bayesian graphical model for genome-wide multi-SNP association mapping. Genet Epidemiol 36: 36–47. doi:10.1002/gepi.20661PMID:22127647
15. Zhao J, Jin L, Xiong M (2006) Test for interaction between two unlinked loci. Am J Hum Genet 79: 831– 845. PMID:17033960
16. Hu T, Chen Y, Kiralis JW, Collins RL, Wejse C, et al. (2013) An information-gain approach to detecting three-way epistatic interactions in genetic association studies. J Am Med Inform Assoc 20: 630–636. doi:10.1136/amiajnl-2012-001525PMID:23396514
17. Knights J, Yang J, Chanda P, Zhang A, Ramanathan M (2013) SYMPHONY, an information-theoretic method for gene-gene and gene-environment interaction analysis of disease syndromes. Heredity (Edinb) 110: 548–559.
18. Mahachie John JM, Van Lishout F, Van Steen K (2011) Model-Based Multifactor Dimensionality Reduction to detect epistasis for quantitative traits in the presence of error-free and noisy data. Eur J Hum Genet 19: 696–703. doi:10.1038/ejhg.2011.17PMID:21407267
19. Van Lishout F, Mahachie John JM, Gusareva ES, Urrea V, Cleynen I, et al. (2013) An efficient algorithm to perform multiple testing in epistasis screening. BMC Bioinformatics 14: 138. doi: 10.1186/1471-2105-14-138PMID:23617239
20. Zhu Z, Tong X, Zhu Z, Liang M, Cui W, et al. (2013) Development of GMDR-GPU for gene-gene interac-tion analysis and its applicainterac-tion to WTCCC GWAS data for type 2 diabetes. PLoS One 8: e61943. doi:
10.1371/journal.pone.0061943PMID:23626757
21. Stephens M (2013) A unified framework for association analysis with multiple related phenotypes. PLoS One 8: e65245. doi:10.1371/journal.pone.0065245PMID:23861737
22. Solovieff N, Cotsapas C, Lee PH, Purcell SM, Smoller JW (2013) Pleiotropy in complex traits: chal-lenges and strategies. Nat Rev Genet 14: 483–495. doi:10.1038/nrg3461PMID:23752797 23. Chen W, Chen D, Zhao M, Zou Y, Zeng Y, et al. (2015) Genepleio software for effective estimation of
gene pleiotropy from protein sequences. Biomed Res Int 2015: 269150. doi:10.1155/2015/269150
PMID:25629041
24. Hill WG, Zhang XS (2012) On the pleiotropic structure of the genotype-phenotype map and the evolva-bility of complex organisms. Genetics 190: 1131–1137. doi:10.1534/genetics.111.135681PMID:
22214609
25. Kendler KS, Neale MC, Kessler RC, Heath AC, Eaves LJ (1992) Major depression and generalized anxiety disorder. Same genes, (partly) different environments? Arch Gen Psychiatry 49: 716–722. PMID:1514877
26. Wagner GP, Zhang J (2011) The pleiotropic structure of the genotype-phenotype map: the evolvability of complex organisms. Nat Rev Genet 12: 204–213. doi:10.1038/nrg2949PMID:21331091
28. Schifano ED, Li L, Christiani DC, Lin X (2013) Genome-wide association analysis for multiple continu-ous secondary phenotypes. Am J Hum Genet 92: 744–759. doi:10.1016/j.ajhg.2013.04.004PMID:
23643383
29. Carter GW, Hays M, Sherman A, Galitski T (2012) Use of pleiotropy to model genetic interactions in a population. PLoS Genet 8: e1003010. doi:10.1371/journal.pgen.1003010PMID:23071457 30. Snitkin ES, Segre D (2011) Epistatic interaction maps relative to multiple metabolic phenotypes. PLoS
Genet 7: e1001294. doi:10.1371/journal.pgen.1001294PMID:21347328
31. Luo L, Zhu Y, Xiong M (2012) Quantitative trait locus analysis for next-generation sequencing with the functional linear models. J Med Genet 49: 513–524. doi:10.1136/jmedgenet-2012-100798PMID:
22889854
32. Ferraty F, Romain Y (2011) The Oxford Handbook of Functional Data Analysis: Oxford University Press.
33. Vintem AP, Price NT, Silverman RB, Ramsay RR (2005) Mutation of surface cysteine 374 to alanine in monoamine oxidase A alters substrate turnover and inactivation by cyclopropylamines. Bioorg Med Chem 13: 3487–3495. PMID:15848762
34. Tennessen JA, Bigham AW, O'Connor TD, Fu W, Kenny EE, et al. (2012) Evolution and functional impact of rare coding variation from deep sequencing of human exomes. Science 337: 64–69. doi:10. 1126/science.1219240PMID:22604720
35. Beasley TM, Erickson S, Allison DB (2009) Rank-based inverse normal transformations are increas-ingly used, but are they merited? Behav Genet 39: 580–595. doi:10.1007/s10519-009-9281-0PMID:
19526352
36. Song W, Wang H, Wu Q (2015) Atrial natriuretic peptide in cardiovascular biology and disease (NPPA). Gene 569: 1–6. doi:10.1016/j.gene.2015.06.029PMID:26074089
37. Yuan Z, Miyoshi T, Bao Y, Sheehan JP, Matsumoto AH, et al. (2009) Microarray analysis of gene expression in mouse aorta reveals role of the calcium signaling pathway in control of atherosclerosis susceptibility. Am J Physiol Heart Circ Physiol 296: H1336–1343. doi:10.1152/ajpheart.01095.2008
PMID:19304945
38. Hoque M, Rentero C, Conway JR, Murray RZ, Timpson P, et al. (2015) The cross-talk of LDL-choles-terol with cell motility: insights from the Niemann Pick Type C1 mutation and altered integrin trafficking. Cell Adh Migr 9: 384–391. doi:10.1080/19336918.2015.1019996PMID:26366834
39. Gajaria TK, Patel DK, Devkar RV, Ramachandran AV (2015) Flavonoid rich extract of Murraya Koenigii alleviates in-vitro LDL oxidation and oxidized LDL induced apoptosis in raw 264.7 Murine macrophage cells. J Food Sci Technol 52: 3367–3375. doi:10.1007/s13197-014-1399-2PMID:26028717 40. Fan X, Wang J, Hou J, Lin C, Bensoussan A, et al. (2015) Berberine alleviates ox-LDL induced
inflam-matory factors by up-regulation of autophagy via AMPK/mTOR signaling pathway. J Transl Med 13: 92. doi:10.1186/s12967-015-0450-zPMID:25884210
41. Konstandi M, Shah YM, Matsubara T, Gonzalez FJ (2013) Role of PPARalpha and HNF4alpha in stress-mediated alterations in lipid homeostasis. PLoS One 8: e70675. doi:10.1371/journal.pone. 0070675PMID:23967086
42. Tsai KL, Chang YL, Huang PH, Cheng YH, Liu DH, et al. (2016) Ginkgo biloba extract inhibits oxidized low-density lipoprotein (oxLDL)-induced matrix metalloproteinase activation by the modulation of the lectin-like oxLDL receptor 1-regulated signaling pathway in human umbilical vein endothelial cells. J Vasc Surg 63: 204–215 e201. doi:10.1016/j.jvs.2014.05.098PMID:25080882
43. Spillmann F, Miteva K, Pieske B, Tschope C, Van Linthout S (2015) High-density lipoproteins reduce endothelial-to-mesenchymal transition. Arterioscler Thromb Vasc Biol 35: 1774–1777. doi:10.1161/ ATVBAHA.115.305887PMID:26088574
44. Scott CC, Vossio S, Vacca F, Snijder B, Larios J, et al. (2015) Wnt directs the endosomal flux of LDL-derived cholesterol and lipid droplet homeostasis. EMBO Rep 16: 741–752. doi:10.15252/embr. 201540081PMID:25851648
45. Pirim D, Wang X, Niemsiri V, Radwan ZH, Bunker CH, et al. (2016) Resequencing of the CETP gene in American whites and African blacks: Association of rare and common variants with HDL-cholesterol levels. Metabolism 65: 36–47. doi:10.1016/j.metabol.2015.09.020PMID:26683795
46. Kapoor GS, Golden C, Atkins B, Mehta KD (2003) pp90RSK- and protein kinase C-dependent pathway regulates p42/44MAPK-induced LDL receptor transcription in HepG2 cells. J Lipid Res 44: 584–593. PMID:12562867
48. Guo T, Yin RX, Lin QZ, Wu J, Shen SW, et al. (2014) Polymorphism of rs873308 near the transmem-brane protein 57 gene is associated with serum lipid levels. Biosci Rep.
49. Talmud PJ, Drenos F, Shah S, Shah T, Palmen J, et al. (2009) Gene-centric association signals for lip-ids and apolipoproteins identified via the HumanCVD BeadChip. Am J Hum Genet 85: 628–642. doi:
10.1016/j.ajhg.2009.10.014PMID:19913121
50. Park SH, Kim S (2012) Pattern discovery of multivariate phenotypes by association rule mining and its scheme for genome-wide association studies. Int J Data Min Bioinform 6: 505–520. PMID:23155779 51. Chittani M, Zaninello R, Lanzani C, Frau F, Ortu MF, et al. (2015) TET2 and CSMD1 genes affect SBP
response to hydrochlorothiazide in never-treated essential hypertensives. J Hypertens 33: 1301– 1309. doi:10.1097/HJH.0000000000000541PMID:25695618
52. Bell JT, Tsai PC, Yang TP, Pidsley R, Nisbet J, et al. (2012) Epigenome-wide scans identify differen-tially methylated regions for age and age-related phenotypes in a healthy ageing population. PLoS Genet 8: e1002629. doi:10.1371/journal.pgen.1002629PMID:22532803
53. Seo T, Velez-Carrasco W, Qi K, Hall M, Worgall TS, et al. (2002) Selective uptake from LDL is stimu-lated by unsaturated fatty acids and modustimu-lated by cholesterol content in the plasma membrane: role of plasma membrane composition in regulating non-SR-BI-mediated selective lipid transfer. Biochemistry 41: 7885–7894. PMID:12069577
54. Yousefipour Z, Newaz M (2014) PPARalpha ligand clofibrate ameliorates blood pressure and vascular reactivity in spontaneously hypertensive rats. Acta Pharmacol Sin 35: 476–482. doi:10.1038/aps. 2013.193PMID:24562305
55. Mallamaci F, Testa A, Leonardis D, Tripepi R, Pisano A, et al. (2014) A polymorphism in the major gene regulating serum uric acid associates with clinic SBP and the white-coat effect in a family-based study. J Hypertens 32: 1621–1628; discussion 1628. doi:10.1097/HJH.0000000000000224PMID:
24805955
56. Qin L, Hu R, Zhu N, Yao HL, Lei XY, et al. (2014) The novel role and underlying mechanism of Wnt5a in regulating cellular cholesterol accumulation. Clin Exp Pharmacol Physiol 41: 671–678. doi:10.1111/ 1440-1681.12258PMID:24827906
57. Rise P, Colombo C, Galli C (1997) Effects of simvastatin on the metabolism of polyunsaturated fatty acids and on glycerolipid, cholesterol, and de novo lipid synthesis in THP-1 cells. J Lipid Res 38: 1299–1307. PMID:9254057
58. Jeon JH, Kim SK, Kim HJ, Chang J, Ahn CM, et al. (2010) Lipid raft modulation inhibits NSCLC cell migration through delocalization of the focal adhesion complex. Lung Cancer 69: 165–171. doi:10. 1016/j.lungcan.2009.10.014PMID:19945766
59. Ballard KD, Quann EE, Kupchak BR, Volk BM, Kawiecki DM, et al. (2013) Dietary carbohydrate restric-tion improves insulin sensitivity, blood pressure, microvascular funcrestric-tion, and cellular adhesion markers in individuals taking statins. Nutr Res 33: 905–912. doi:10.1016/j.nutres.2013.07.022PMID:
24176230
60. Todur SP, Ashavaid TF (2013) Association of CETP and LIPC Gene Polymorphisms with HDL and LDL Sub-fraction Levels in a Group of Indian Subjects: A Cross-Sectional Study. Indian J Clin Biochem 28: 116–123. doi:10.1007/s12291-012-0259-yPMID:24426196
61. Ray KK, Vallejo-Vaz AJ (2015) The evolving role of CETP inhibition: beyond HDL cholesterol. Lancet 386: 412–414. doi:10.1016/S0140-6736(15)60608-0PMID:26047976
62. Khetarpal SA, Edmondson AC, Raghavan A, Neeli H, Jin W, et al. (2011) Mining the LIPG allelic spec-trum reveals the contribution of rare and common regulatory variants to HDL cholesterol. PLoS Genet 7: e1002393. doi:10.1371/journal.pgen.1002393PMID:22174694
63. Morais CC, Alves MC, Augusto EM, Abdalla DS, Horst MA, et al. (2015) The MTHFR C677T Polymor-phism Is Related to Plasma Concentration of Oxidized Low-Density Lipoprotein in Adolescents with Cardiovascular Risk Factors. J Nutrigenet Nutrigenomics 8: 105–113. doi:10.1159/000439218PMID:
26421712
64. Xi B, Shen Y, Zhao X, Chandak GR, Cheng H, et al. (2014) Association of common variants in/near six genes (ATP2B1, CSK, MTHFR, CYP17A1, STK39 and FGF5) with blood pressure/hypertension risk in Chinese children. J Hum Hypertens 28: 32–36. doi:10.1038/jhh.2013.50PMID:23759979
65. Lima LO, Bruxel EM, Hutz MH, Van der Sand CR, Van der Sand LC, et al. (2013) Influence of PPARA, RXRA, NR1I2 and NR1I3 gene polymorphisms on the lipid-lowering efficacy and safety of statin ther-apy. Arq Bras Endocrinol Metabol 57: 513–519. PMID:24232815
66. Yazdanyar A, Jiang XC (2012) Liver phospholipid transfer protein (PLTP) expression with a PLTP-null background promotes very low-density lipoprotein production in mice. Hepatology 56: 576–584. doi:
67. Jiang XC, Jin W, Hussain MM (2012) The impact of phospholipid transfer protein (PLTP) on lipoprotein metabolism. Nutr Metab (Lond) 9: 75.
68. Tanaka J, Qiang L, Banks AS, Welch CL, Matsumoto M, et al. (2009) Foxo1 links hyperglycemia to LDL oxidation and endothelial nitric oxide synthase dysfunction in vascular endothelial cells. Diabetes 58: 2344–2354. doi:10.2337/db09-0167PMID:19584310
69. Savai R, Al-Tamari HM, Sedding D, Kojonazarov B, Muecke C, et al. (2014) Pro-proliferative and inflammatory signaling converge on FoxO1 transcription factor in pulmonary hypertension. Nat Med 20: 1289–1300. doi:10.1038/nm.3695PMID:25344740