ISSN 0104-6632 Printed in Brazil
www.abeq.org.br/bjche
Vol. 31, No. 02, pp. 313 - 323, April - June, 2014 dx.doi.org/10.1590/0104-6632.20140312s00002434
Brazilian Journal
of Chemical
Engineering
MAINTENANCE-ENERGY-DEPENDENT
DYNAMICS OF GROWTH AND
POLY(3-HYDROXYBUTYRATE) [P(3HB)]
PRODUCTION BY
Azohydromonas lata
MTCC 2311
USING SIMPLE AND RENEWABLE CARBON
SUBSTRATES
M. Zafar
1,3*, S. Kumar
2, S. Kumar
2, A. K. Dhiman
2and H.-S. Park
3*1Department of Biological Engineering, Shobhit University, Meerut-250 110, U.P., India.
Phone:+91-121-2575091, Fax:+91-121-2575724. E-mail: [email protected]
2
Department of Chemical Engineering, Indian Institute of Technology Roorkee, Roorkee-247 667, Uttarakhand, India.
3
Center for Clean Technology and Resource Recycling, University of Ulsan, Ulsan, Republic of Korea. Phone: +82-52-259-2258; Fax: +82-52-221-0152,
E-mail: [email protected]
(Submitted: December 6, 2012 ; Revised: July 20, 2013 ; Accepted: August 9, 2013)
Abstract - The dynamics of microbial growth and poly(3-hydroxybutyrate) [P(3HB)] production in growth/ non-growth phases of Azhohydromonas lata MTCC 2311 were studied using a maintenance-energy-dependent mathematical model. The values of calculated model kinetic parameters were: ms1 = 0.0005 h-1, k = 0.0965,
µmax = 0.25 h -1
for glucose; ms1 = 0.003 h -1
, k = 0.1229, µmax = 0.27 h -1
for fructose; and ms1 = 0.0076 h -1
, k = 0.0694, µmax = 0.25 h
-1
for sucrose. The experimental data of biomass growth, substrate consumption, and P(3HB) production on different carbon substrates were mathematically fitted using non-linear least square optimization technique and similar trends, but different levels were observed at varying initial carbon substrate concentration. Further, on the basis of substrate assimilation potential, cane molasses was used as an inexpensive and renewable carbon source for P(3HB) production. Besides, the physico-chemical, thermal, and material properties of synthesized P(3HB) were determined which reveal its suitability in various applications. Keywords: Poly(3-hydroxybutyrate); Microbial dynamics; Cane molasses; Maintenance energy; Azohydromonas lata.
INTRODUCTION
In response to the problems associated with the application of synthetic oil-based polymers, the sci-entific communities are searching for alternative materials and their sustainable process development. The main concern of polymer industries and decision makers is to minimize the dependency on non-degradable polymers under the present scenario of
PHAs have a broader diversity in terms of monomer units, i.e., about 180 types of different monomers exist in nature. Poly(3-hydroxybutyrate) (P3HB) is a type of bacterial PHA that possesses almost similar thermo-plasticity and low O2 permeability to that of petro-plastic. It is synthesized and accumulates intra-cellularly as carbon and energy granules up to 90% of the cellular dry weight and possesses unique ther-mal and material properties which make it suitable for various applications in processing industries, agriculture, and medical fields (Gouda et al., 2001; Chen, 2011).
Many bacterial species such as Alcaligenes sp., Pseudomonas sp., Aeromonas hydrophila, Rhodop-seudomonas, Methylobacterium, Saccharophagus degradans, Bacillus sp., and Azotobacter sp., have been used extensively in the last decade for the production of PHAs (Castilho et al., 2009; Gouda et al., 2001; Annuar et al., 2006; Chen et al., 1991; Chen, 2011). The industrial production of biopoly-mer takes place under an excess of carbon source and a limited amount of certain nutrients such as nitrogen (A. latus, P. oleovorans, Ralstonia eutropha), carbon (Spirillum sp., Hyphomicrobium sp.), iron, magnesium (Pseudomonas sp.), oxygen (Azotobacter vinelandii, Rhizobium ORS 571), phosphate ( Rhodo-bacter rubrum, Caulobacter crecentus), and potas-sium sulfate (Bacillus, Rhodospirillum sp.). The industrial production of PHAs is expensive due to the associated high cost of carbon sources, which can account for up to 29% of the overall production cost (Kim and Lenz, 2000). Therefore, it is essential to investigate the assimilation potential of bacterial strain towards simple carbon substrates such as glu-cose, fructose, sucrose, lactose, and xylose and sub-sequently renewable and inexpensive sources like cane molasses, cheese whey, and lignocellulosic materials.
It is essential to describe the dynamics of micro-bial growth and growth-associated production of PHAs in order to sustain the accumulation potential of microorganism. The suitable mathematical models have been used to describe the dynamic behavior of microorganisms using kinetic approaches based on growth parameters. Some of the researchers have incorporated ‘maintenance expenditure’ for painstak-ing explanations of microbial growth/product kinetics (Pirt, 1965, 1982; Bodegom, 2007; Nancib et al., 1993; Nielsen et al., 2005). The term physiological mainte-nance is used for endogenous metabolism which comprises the energy expenditure for osmo-regula-tion, cell-motility, active transport of bio-molecules, defense mechanisms, and proofreading/turnover of macromolecules (Bodegom, 2007; Nielsen et al.,
2005). The physiological maintenance does not include the energy expenditures of metabolic pathways, stor-age of polymers (PHAs), and extracellular losses (Bodegom,2007). The maintenance expenditure is not constant throughout the fermentation process and varies with the substrate dependent growth with re-spect to specific growth rate (µ) and yield coeffi-cient. Thus, in order to assess the economic feasibil-ity of the use of carbon substrates, it is essential to evaluate the energy expenditures in terms of growth, maintenance, and P(3HB) formation.
In this study, the dynamics of microbial growth and P(3HB) production by A. lata MTCC 2311 using different carbon sources, namely glucose, fructose, and sucrose is assessed. The kinetics of growth and P(3HB) production are evaluated by including the growth-dependent-maintenance energy expenditure. A thorough discussion has been provided for a better insight of maintenance energy expenditure during growth and P(3HB) production. The experimental data derived for these carbon sources were fitted by mathematical models developed to represent the biomass growth, substrate consumption, and P(3HB) production profiles. Besides, the potential of A. lata for P(3HB) production using cane molasses as an inexpensive and renewable carbon source is also examined with its physico-chemical characterization.
MATERIALS AND METHODS
Microorganism and Seed Culture Preparation
The lyophilized culture of Alcaligenes latus MTCC 2311 was procured from the Institute of Microbial Technology (IMTECH), Chandigarh, India, which is reclassified as Azohydromonas lata (Xie and Yokota, 2005). The culture was first revived in nutrient broth for 24 h followed by inoculum preparation in AL2 me-dium (pH 7.0) which contained (g/L): Sucrose, 20.0; (NH4)2SO4, 1.0; KH2PO4, 0.6; Na2HPO4.12H2O, 3.6; MgSO4.7H2O, 1.0; CaCl2.2H2O, 0.1; citric acid, 0.1; and trace element solution 3 mL/L (Wang and Lee 1997). The inoculum was prepared by using 50 ml of AL2 medium in 250 mL capacity conical flasks kept at 30 °C and 180 rpm for 24 h in an orbital shaking incubator. The culture was maintained at 4 °C on slants of AL2 agar for further applications.
P(3HB) Production on Different Carbon Sources
medium, which contained (g/L): carbon substrate (5 to 40), (NH4)2SO4 1.0, MgSO4.7H2O 1.0, citric acid 0.1, CaCl2.2H2O 0.1, Na2HPO4.12 H2O 3.6, KH2PO4 0.6, and Trace Element (TE) solution 3 mL/L, and pH 6.8. The different pure carbon substrates such as glucose, fructose, and sucrose were used. The P(3HB) production was carried out in AL2 medium with vary-ing C/N ratio at 30 ºC and agitation speed of 180 rpm for 72 h. The samples were collected at regular inter-vals for determination of biomass growth, P(3HB) concentration, and residual sugar concentration.
Analytical Procedures
The biomass concentration was estimated turbidi-metrically at 600 nm using a UV-VIS Spectro-photometer (Lambda 35, Perkin Elmer, MA, USA). In addition, the bacterial cell pellet was collected by centrifugation at 8000×g for 10 min of 5 mL culture samples drawn at regular interval. The centrifuged cell pellet was washed twice with distilled water and dried at 80 °C in a hot air oven to a constant weight. The quantification of P(3HB) was carried out by the propanolysis method with little modification using a gas chromatograph (Thermo, USA) (Riis and Mai 1988). The analysis of sugars was carried out on a high performance liquid chromatograph (HPLC) (Waters, USA), equipped with a sugar-pak column (6.5×250 mm length, Waters, USA) and a refractive index (RI) detector (model 24140, Waters). Deionized-water at 90 ºC was used as eluent with a flow rate of 0.5 ml/min. The cell-free supernatant was analyzed for residual (NH4)+ ion concentration by the phenol-hypochlorite method (Solozano 1969).
Physico-Chemical Characterization of Synthesized P(3HB)
Fourier transform infrared (FTIR) spectra of extracted P(3HB) were recorded on a Nicolet 6700 FT-IR spectrometer (Thermo Scientific, USA) between 4000 and 500 cm-1. The 13C Nuclear magnetic reso-nance (NMR) spectra of samples were recorded at 75.4 MHz on a model Av 500 MHz NMR spec-trometer (Bruker Inc., USA) using deuterated chloro-form (CDCl3) as solvent. The thermal characteristics of P(3HB) samples were measured with a Pyris Diamond Thermogravimetric Analyser (Perkin Elmer Inc, Wellesley, MA, USA). The analysis was carried out in an inert gas atmosphere of nitrogen at a 100 mL/min flow rate in the temperature range from 25 to 250 °C at a heating rate of 10 °C/min. The mo-lecular mass of the extracted P(3HB) sample was determined with a gel permeation chromatography
(GPC) system (Waters Inc., MA, USA) at 40 °C. Two columns in series (high resolution HSP gel HR 2.5 and HSP gel HR 3.0, 6.0×15 cm length, Waters) were used with a RI detector. A narrow dispersion polystyrene and tetrahydrofuran (THF) with a flow rate of 0.6 mL/min were used as the MW standard and mobile phase, respectively.
Maintenance-Energy-Dependent Kinetics and De-velopment of Mathematical Models
Several batch studies were conducted to estimate the kinetic parameters of biological processes with particular attention to the substrate utilization for cell maintenance (Minkevich et al., 2000; Nielson et al., 2005; Nancib et al., 1993; Djavan and Jones, 1980). But little attention has been focused on the mainte-nance energy related kinetics during PHAs produc-tion (Liu et al., 2005; Wang et al., 2007). The micro-organisms need energy for growth, intracellular/ extracellular product formation, and for maintenance functions such as transportation of cellular materials, osmotic regulation, defense against O2 stress, cell motility, and for proofreading, synthesis, and turn-over of cellular macromolecules, viz. enzyme, and RNA (Bodegom et al., 2007; Oliveira et al., 1992; Pirt, 1982). The kinetic approach to microbial dy-namics requires the incorporation of maintenance energy expenditure with biomass growth under vari-ous types of bioprocesses such as primary/secondary metabolite production, bioremediation, bioaccumula-tion and biosorpbioaccumula-tion (Bodegom et al., 2007).
During the fermentation process, substrates are utilized by microbial cells for biomass production, product formation, and for maintenance expenditure. The exponential growth of bacterial cell biomass is expressed as:
dX X
dt = μ (1)
in which µ is the specific growth rate (h-1) according to Monod:
max s
S
K S
⎛ ⎞ μ = μ ⎜ ⎟
+
⎝ ⎠ (2)
where μmaxis the maximum specific growth rate (h-1), Ks is the substrate saturation constant (g/L), and S is
the substrate concentration (g/L).
and Lee, 1997). It is assumed that substrate inhibi-tion of biomass growth is not observed. Thus, the microbial growth and growth-associated P(3HB) accumulation are associated with the types of sub-strate and their concentration.
During fermentative production of P(3HB), the initial microbial concentration (inoculum) and sub-strate are considered as reactants which, upon bio-catalytic reaction, lead to an increase in the biomass growth as well as in P(3HB) accumulation. Thus, the microbial growth dynamics are determined by both the microbial specific growth rate and the substrate consumption rate.
The rate of substrate consumption, analogous to the biomass growth rate as a function of biomass concentration is given by:
s
dS
q X
dt = − (3)
where qs is the specific substrate consumption rate and can be expressed in terms of the true growth yield and maintenance coefficients as:
/ 1 s s X S q m Y
= μ + (4)
where YX S/ is maximum growth yield coefficient (g/g)
and msis the maintenance energy coefficient (h-1). Upon substitution of Eq. (2) into Eq. (4)
max /
s s
X S s
S
q m
Y K S
⎛ ⎞ μ
= ⎜ ⎟+ +
⎝ ⎠ (5)
When the product formation (P(3HB)) is related to carbon source consumption:
(3 ) /
P HB P S s
q =Y q (6)
Upon substitution of Eq. (4) into Eq. (6)
/
(3 ) /
/ P S
P HB P S s
X S
Y
q Y m
Y
= μ + (7)
where YP S/ is the maximum P(3HB) yield coefficient (g/g).
In addition, the P(3HB) production by bacterial cells is described as:
(3 ) 1 P HB dP q X dt ⎡ ⎤ = ⎢ ⎥
⎣ ⎦ (8)
(3 ) 1 2
P HB
q = μ +K K (9)
where qP(3HB) is the product formation rate, and K1
and K2 represent the growth and non-growth associ-ated product constant, respectively.
The straight line for qP(3HB) verses μ gives the slope K1 and intercept K2 and reveals the type of P(3HB) production. If the straight line passes through the origin, K2 is zero and hence the fermentation is
growth-associated, otherwise it is of the mixed type, i.e., both growth and non-growth associated.
The free energy change during catabolic reaction is slightly coupled with the anabolic cellular biomass and biopolymer accumulation and the total energy flux is partitioned into biomass and the maintenance function (Wang et al., 2007).
The total maintenance energy expenditure is not constant throughout the bioprocess and can be di-vided into two components; one is a constant which is required throughout the cultivation process and the other component is growth dependent (Pirt, 1982). The second component of maintenance energy de-pends on the specific growth rate (µ) and decreases hyperbolically as a function of the specific growth rate. The maintenance is considered to be the con-sumption phenomenon, corresponding to energy wast-age, which is increased under unfavorable environ-mental conditions. In general, a low maintenance value (ms) is observed at high specific growth rate
that favors biomass growth and metabolite produc-tion (Pirt, 1982).
According to Pirt, 1982:
1 2
s s s
m =m +m (10)
where, ms is maintenance energy expenditure, ms1 is the constant and ms2 is the growth-dependent component of the maintenance coefficient.
1
max
1
s s
m =m +k⎛⎜ − μ ⎞⎟
μ
⎝ ⎠ (11)
where k is a positive quantity that depends on the substrate-microorganism system. The above relation-ship describes the cellular metabolic efficiency under specific environmental conditions. It is observed that the maintenance is high when the specific growth rate is low and vice versa.
Upon substituting Eq. (11) into Eq. (4) 1 / max 1 s s X S
q m k
Y
⎛ ⎞
μ μ
= + + ⎜ − ⎟ μ
⎝ ⎠ (12)
where k
(
1− μ μmax)
is growth dependent and ms1 is the constant component of maintenance energy.During the exponential growth of the microorgan-ism ms2 is required for the cell growth and cellular function in addition to ms1. The amount of ms2 decreases with the increase in growth rate and approaches zero at the maximum specific growth rate (µmax). Eq. (12) can be rewritten as:
(
1)
/ max
1
s s
X S
k
q k m
Y
⎛ ⎞
=⎜ − ⎟μ + + μ
⎝ ⎠ (13)
where YX S/ , μmax, k, and ms1 are constant.
s
q = μ +A B (14)
where / max 1 X S k A Y ⎛ ⎞ =⎜ − ⎟ μ
⎝ ⎠ and B=
(
k+ms1)
Eq. (14) is not exactly applicable in the case of cell dormancy resulting in a very slow specific growth rate (Pirt, 1982). In our study, Azohydromonas lata efficiently utilized the simple carbon substrate with-out any lag phase.
The percent of the total substrate (carbon source) consumption used for cell energy maintenance varies with the specific growth rate of microorganism and calculated as (Djavan and James, 1980):
% carbon as maintenance= (ms/qs) 100× (15) where ms (h
-1
) is total maintenance expenditure
1 2
(ms +ms ) and qsis the specific substrate con-sumption rate (g/g).
RESULTS AND DISCUSSION
Maintenance-Energy-Dependent Kinetics and Mathe-matical Modeling
The dynamics of biomass growth and P(3HB) production by A. lata MTCC 2311 were studied in defined AL2 medium supplemented with varying concentrations of glucose, fructose, and sucrose. About 65% of the initial concentration of these car-bon sources (30 g/L) were metabolically assimilated
and high values of biomass and P(3HB) concentra-tions of 8.35 and 3.60 g/L were observed with fruc-tose followed by sucrose (7.92 and 3.50 g/L) and glucose (7.55 and 3.40 g/L), respectively. It is note-worthy that the simple carbohydrates such as glu-cose, fructose and sucrose are mostly processed through the EMP pathway to yield pyruvate and acetate as the main products. Acetate is partially converted into P(3HB) through synthesis of acetyl CoA and further consumed during the sporulation process of bacteria. It is also documented that the glucose in the medium represses the expression of the phospotransbutylase (Ptb) gene that is needed for PHB production (Shamala et al., 2009). This may be a possible reason due to which fructose gave a little higher yield than glucose and sucrose in the medium. Table 1 shows the calculated growth and P(3HB) kinetic parameters, along with the maintenance ex-penditure during microbial metabolism on various carbon substrates. Almost similar kinetic constants were observed for all tested sugars with slightly higher values for fructose: µmax = 0.27 h
-1
; YX S/ = 0.45;
/ P S
Y = 0.20; qs = 0.60; qp = 0.12, and Yc (carbon
yield) = 0.24.
The maintenance expenditure is an important biological kinetic parameter, that is not constant throughout the bacterial metabolic processes. It may vary with the increase in substrate concentration and growth rate of the microorganism. The growth-rate-dependent maintenance energy expenditure is repre-sented by Eq. (11). In order to calculate both the constant and growth-dependent parts of the mainte-nance expenditure, the experimental data for biomass growth derived from varying sugar concentrations were fitted to Eq. (11) and can be represented as:
s(fructose) 0.0031 0.1229 1
0.27
m = + ⎛⎜ − μ ⎞⎟
⎝ ⎠ (16)
s(glucose) 0.0005 0.0965 1
0.25
m = + ⎛⎜ − μ ⎞⎟
⎝ ⎠ (17)
s(sucrose) 0.0076 0.0695 1
0.26
m = + ⎛⎜ − μ ⎞⎟
⎝ ⎠ (18)
pro-Table 1: Kinetic parameters derived for various carbon substrates, along with the maintenance coefficients.
Carbon source
Specific growth rate, µ (h-1)
Biomass yield (YX/S)a
P(3HB) yield (YP/S)b
qS qPc YCd Maintenance coefficient (h-1)
ms1 ms2 ms
Glucose 0.25 0.40 0.17 0.62 0.11 0.23 0.0005 0.0039 0.00436
Fructose 0.27 0.45 0.20 0.60 0.12 0.24 0.0031 0.0091 0.01218
Sucrose 0.26 0.42 0.17 0.61 0.10 0.23 0.0076 0.0053 0.01294
a
Yx/s= g biomass/g substrate; b
Yp/s=g P(3HB)/ g total sugar; c
Maximum P(3HB) content was reported at 40 h of cultivation period d
YC, Carbon yield= carbon moles in P(3HB)/ carbon moles in substrate
duce one gram of biomass by A. lata, about 12.94, 12.18, and 4.36 mg h-1 of sucrose, fructose, and glu-cose, respectively, are needed just to meet the de-mands of cell energy maintenance. The assimilation of sucrose and fructose takes place through a branch metabolic pathway of glycolysis to convert them into pyruvate, which subsequently results in 3HB mono-mers through the β-oxidation pathway. Some addi-tional maintenance energy is required during the ex-pression of specific genes which lead to the synthesis of specific proteins, i.e., enzymes that participate in these metabolic pathways.
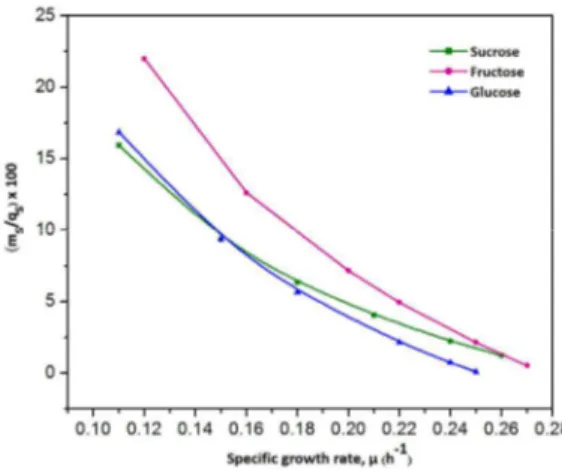
The maintenance energy was not constant through-out the fermentation process and changed with the specific growth rate of A. lata. Similarly, the percent of carbon used as maintenance energy decreased with the increase in specific growth rate (Fig. 1). It has been reported that the maintenance energy consumption corresponds to the energy wastage and increases under adverse environmental conditions (Nancib et al., 1993). At a low specific growth rate of 0.12 h-1, about 22% of fructose was used as maintenance energy. However, only 2.14% of fructose expenditure was observed as maintenance energy at the high specific growth rate of 0.25 h-1.
Figure 1: Effect of specific growth rate (µ) on the percent of carbon used as maintenance energy with varying concentrations of various sugars.
Similarly, about 16.85% and 15.93% of glucose and sucrose, respectively, were consumed as mainte-nance requirement at the low specific growth rate of 0.11 h-1. These expenditures were decreased to 0.73% and 2.22% of glucose and sucrose, respec-tively, at the high specific growth rate of 0.24 h-1. The high specific growth rate indicates a favorable environment for bacterial growth at which the main-tenance requirement is comparatively low.
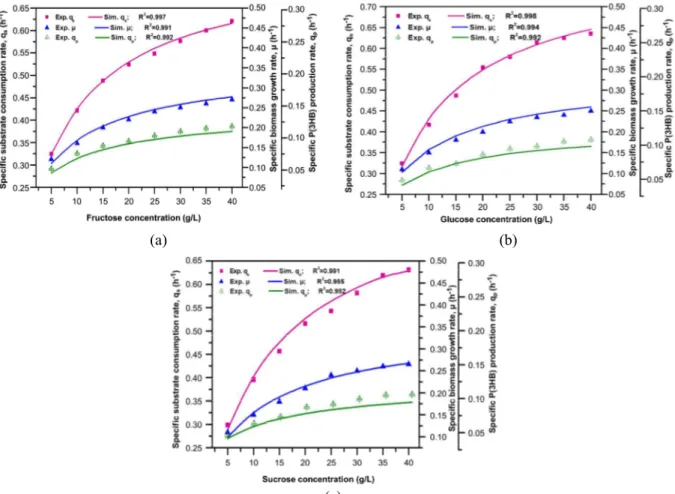
The varying concentration of carbon substrates such as glucose, fructose, and sucrose have signifi-cant effects on the observed specific microbial growth, specific substrate consumption, and P(3HB) production rates [Figs. 2(a)-(c)]. It can be seen that Eqs.(2), (5), and (8) have appropriately modeled the experimental data for biomass growth, substrate con-sumption, and P(3HB) formation, respectively. Fig. 2(a) shows the effect of fructose concentration on the specific growth rate, substrate consumption, and P(3HB) production rates, as well as satisfactory modeling of experimental data with determination of correlation coefficients (R2) of 0.98, 0.99, and 0.96, respectively. The maximum specific biomass growth rate of 0.27 h-1 was reported at the concentration of 30 g/L. Similarly, the maximum substrate consump-tion (qp) and P(3HB) production rates (qP(3HB)) of
0.60 and 0.12 h-1, respectively,were reported at the same concentration of fructose. Very similar trends were observed with glucose and sucrose in the me-dium, but to different extents (Fig. 2(b)-(c) and Table 1).
The calculated specific growth and specific P(3HB) production rates were fitted using Eq. (10) to predict the nature of P(3HB) synthesis. A straight line correlation was observed between µ and qP(3HB)
with a positive intercept on the y-axis (K2) and slope
(K1) for all simple carbon sources, viz., glucose,
(a) (b)
(c)
Figure 2: Effect of (a) fructose concentration in the medium, (b) glucose concentration in the medium, and (c) sucrose concentration in the medium on the specific substrate consumption rate (■), specific biomass growth rate (▲), and specific P(3HB) production rate ( ).
P(3HB) Production Using Inexpensive Cane Mo-lasses
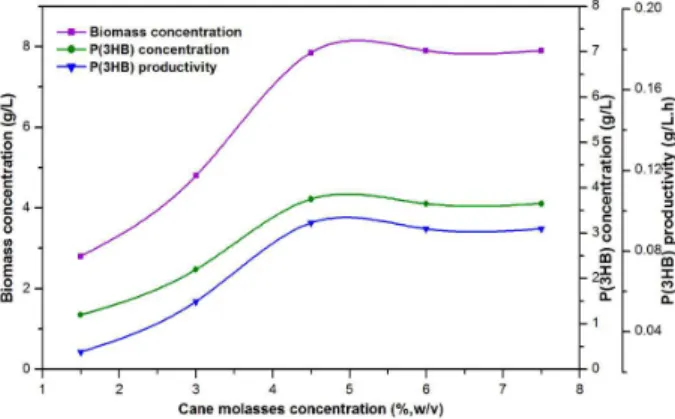
Sugarcane molasses is an inexpensive and renew-able carbon substrate derived from the massive sugar industry in India. The cane molasses obtained from a sugar industry (Uttam Sugar Mills Ltd., Roorkee, India) contains reducing sugars (46.8%) such as glu-cose (5.50%), fructose (9.54%), and sucrose (31.75%) in addition to some growth promoters, ions, minerals, and vitamins in abundance. The experiments were conducted at different concentra-tions (1.5 to 7.5%, w/v) of cane molasses to promote biomass growth and P(3HB) accumulation by A. lata. The course of dry cell weight, P(3HB) concentration, and the specific P(3HB) productivity is illustrated in Fig. 4. The optimum dry cell weight and P(3HB) of 7.85 and 3.75 g/L, respectively, were observed at 4.5% (w/v) of cane molasses and no significant further increase in biomass growth and P(3HB) was observed at high concentrations of cane molasses.
Figure 4: Effect of concentration of cane molasses on biomass concentration, P(3HB) concentration, and P(3HB) productivity.
The maximum specific P(3HB) formation rate of 0.094 g/L.h was found at 4.5% (w/v) of cane molasses. The maximum specific growth rate (µmax) of 0.29 h-1 and substrate (cane molasses) saturation constant (Ks) of 1.67% (w/v) were estimated by the
least square technique using the curve fitting toolbox of MATLAB 7.8.1 (The Mathworks Inc., MA, USA). The production of P(3HB) using cane molasses has been reported by some researchers (Beaulieuet al., 1995; Gouda et al., 2001). Beaulieu et al. (1995) reported a maximum accumulation of 26% (w/w) of dry weight by Alcaligenes eutropha
DSM 545 on different concentrations of cane molasses. Similarly, Gouda et al. (2001) reported a maximum P(3HB) concentration of 46.20% per mg cell dry weight with 2% molasses, while best growth was obtained for Bacillus megaterium with 3% molasses.
Physico-Chemical, Thermal and Material Properties of Produced P(3HB)
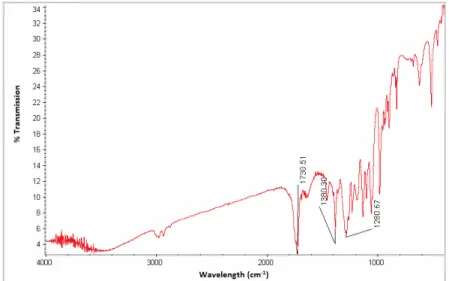
Figure 5: FTIR Spectra of P(3HB) isolated from Azohydromonas lata cells.
C=0
CH3
CH CH2
O
C=0
CH3
CH CHCH22
O O
Figure 6: 13C NMR Spectra of P(3HB) produced by Azohydromonas lata MTCC 2311.
CONCLUSION
The dynamics of microbial growth and P(3HB) production on simple carbon substrates has been investigated with the incorporation of maintenance-energy-dependent kinetics and mathematical models. The changes in maintenance energy expenditure has been successfully correlated with the varying spe-cific growth rate and yields of biomass and P(3HB) during growth/P(3HB) production processes. Be-sides, the assimilation potential of cane molasses as an inexpensive and renewable carbon source for biomass growth and P(3HB) production has also been examined. The physico-chemical, thermal, and material properties of synthesized P(3HB) have been found to be similar to those of standard P(3HB).
NOMENCLATURE
k Constant that depends on the substrate-microorganism system
h-1
K1 Growth-associated product constant
(-)
K2 Non-growth associated product constant
h-1 Ks Substrate saturation constant g/L
Mn Number average molecular weight
g/mol
s
m Maintenance energy coefficient h-1 ms1 Constant component of the
maintenance energy expenditure
h-1
ms2 Growth dependent component
of the maintenance energy expenditure
h-1
Mw Weight average molecular weight
g/mol
(3 )
P HB
q Specific P(3HB) formation rate h-1 s
q Specific substrate consumption rate
g.g-1 S Concentration of substrates,
glucose, fructose, and sucrose
g/L
Tm Melting Temperature °C
/ P S
Y P(3HB) yield coefficient, w.r.t. substrate consumption
g/g
Greek Letters
µ Specific growth rate h-1
max
μ Maximum specific growth rate h-1
Abbreviations
3HB 3-hydroxybutyrate
D Polydispersity index
DTA Differential Thermal Analysis DTG Differential Thermogravimetry
GPC Gel Permeation
Chromatography
HPLC High performance liquid chromatography
MTCC Microbial Type Culture Collection
P(3HB) Poly(3-hydroxybutyrate) PHA Polyhydroxyalkanoate PHAs Polyhydroxyalkanoates
SEM Scanning Electron Microscopy TGA Thermo-Gravimetric
Analysis
REFERENCES
Akaraonye, E., Keshavarz, T. and Roy, I., Produc-tion of polyhydroxyalkanoates: The future green materials of choice. Journal of Chemical Technol-ogy and BiotechnolTechnol-ogy, 85, p. 732-743 (2010). Annuar, M. S. M., Tan, I. K. P., Ibrahim, S. and
Ramachandran, K. B., Ammonium uptake and growth kinetics of Pseudomonas putida PGA1. Asia Pacific Journal of Molecular Biology and Biotechnology, 14(1), p. 1-10 (2006).
Beaulieu, M., Beaulieu, Y., Melinard, J., Pandian, S., Goulet, J., Influence of ammonium salts and cane molasses on growth of Alcaligenes eutrophus and production of polyhydroxybutyrate. Applied and Environmental Microbiology, 61, p. 165-169 (1995). Bodegom, P. V., Microbial maintenance: A critical
review on its quantification. Microbial Ecology, 53(4), p. 513-523 (2007).
Castilho, L. R., Mitchell, D. A. and Freire, D. M. G., Production of polyhydroxyalkanoates (PHAs) from waste materials and byproducts by submerged and solid state fermentation. Bioresource Tech-nology, 100, p. 5996-6009 (2009).
Chen, G-Q., Industrial Production of PHA. In: Chen, G-Q., (Ed.), Plastics from Bacteria: Natural Func-tions and ApplicaFunc-tions. Microbiology Mono-graphs, Vol., 14, Springer-Verlag, Germany, p. 121- 132 (2011).
Djavan, A. and James, A. M., Determination of the maintenance energy of Klebsiella aerogenes grow-ing in continuous culture. Biotechnology Letters, 2(7), p.303-308 (1980).
Gouda, M. K., Swellam, A. E., Omar, S. H., Produc-tion of PHB by a Bacillus megaterium strain using sugarcane molasses and corn steep liquor as sole carbon and nitrogen sources. Microbiological Research, 156, p. 201-207 (2001).
Kim, Y. B. and Lenz, R. W., Polyester from Micro-organism, In: Scheper, T., (Ed.) Advances in Biochemical Engineering/Biotechnology: Biopoly-ester. Springer-Verlag, Germany, p. 52-77 (2000). Liu, Y., Liu, Q-S., Tay, J-H., Initial
conditions-de-pendent growth kinetics in microbial batch culture. Process Biochemistry, 40, p. 155-160 (2005).
Minkevich, I. G., Andreyev, S. V. and Eroshin, V. K., The effect of two inhibiting substrates on growth kinetics and cell maintenance of the yeast Candida valida. Process Biochemistry, 36(3), p. 209-217 (2000).
Nancib, N., Modelling of batch fermentation of a recombinant Escherichia coli producing glyceraldehyde-3-phosphate dehydrogenase on a complex selective medium. The Chemical Engi-neering Journal, 52(2), p. B35-B48 (1993). Nielsen, D. R., Daugulis, A. J. and McLellan, P. J.,
Quantifying maintenance requirements from the steady-state operation of a two-phase partitioning bioscubber. Biotechnology and Bioengineering, 90, p. 248-258 (2005).
Oliveira, E. G., Morais, J. O. and Pereira, N., Deter-mination of the energy maintenance coefficient of Zymomonas mobilis. Biotechnology Letters, 14 (11), p. 1081-1084 (1992).
Oliveira, F. C., Dias, M. L., Castilho, L. R. and Freire, D. M. G., Characterization of poly(3-hydroxybu-tyrate) produced by Cupriavidus necator in solid-state fermentation. Bioresource Technology, 98, p. 633-638 (2007).
Pirt, S. J., The Maintenance energy of bacteria in growing cultures. Proceedings of the Royal Soci-ety of London. Series B, Biological Sciences, 163(991), p. 224-231 (1965).
Pirt, S. J., Maintenance energy: A general model for energy-limited and energy-sufficient growth. Ar-chives of Microbiology, 133, p. 300-302 (1982). Riis, V. and Mai, W., Gas chromatographic
deter-mination of poly-β-hydroxybutyric acid in micro-bial biomass after hydrochloric acid propanoly-sis. Journal of Chromatography, 445, p. 285-289 (1988).
Rozsa, C., Gonzalez, M., Galego, N., Ortiz, P., Martinez, J., Martinez, R. and Gomez, M. R., Biosynthesis and characterization of poly(β -hydroxybutyrate) produced by Bacillus circulans. Polymer Bulletin, 435, p. 429-435 (1996).
Shamala, T. R., Divyashree, M. S., Davis, R., Latha, K. K. S., Vijayendra, S. V. N. and Raj, B., Pro-duction and characterization of bacterial poly-hydroxyalkanoate copolymers and evaluation of their blends by Fourier transform infrared spec-troscopy and scanning electron microscopy. Indian Journal of Microbiology, 49, p. 251-258 (2009). Solozano, L., Determination of ammonia in natural
waters by the phenol hypochlorite method. Lim-nology and Oceanography, 14, p. 799-801 (1969). Sudesh, K., Abe, H. and Doi, Y., Synthesis, structure and properties of Polyhydroxyalkanoates: Bio-logical polyesters. Progress in Polymer Science, 25, p. 1503-1555 (2000).
Wang, F. and Lee, S. Y., Poly (3-Hydroxybutyrate) production with high productivity and high poly-mer content by a fed-batch culture of Alcaligenes latus under nitrogen limitation. Applied and Environmental Microbiology, 63, p. 3703-3706 (1997).
Wang, J., Fang, F. and Yu, H-Q., Substrate con-sumption and biomass growth of Ralstonia eutropha at various S0/X0 levels in batch cultures. Biore-source Technology, 98, p.2599-2604 (2007). Xie, C-H. and Yokota, A., Reclassification of