Flávio Dinis Gonçalves Rosa Jacinto
Master of ScienceInternet Measurement
Dissertação para obtenção do Grau de Mestre em
Engenharia Electrotécnica e de Computadores
Orientador: Luís Bernardo, Professor,
Universidade NOVA de Lisboa
Júri
Presidente: Luís Augusto Bica Gomes de Oliveira Arguentes: Pedro Miguel Figueiredo Amaral
Internet Measurement
Copyright © Flávio Dinis Gonçalves Rosa Jacinto, Faculdade de Ciências e Tecnologia, Universidade NOVA de Lisboa.
A Faculdade de Ciências e Tecnologia e a Universidade NOVA de Lisboa têm o direito, perpétuo e sem limites geográficos, de arquivar e publicar esta dissertação através de exemplares impressos reproduzidos em papel ou de forma digital, ou por qualquer outro meio conhecido ou que venha a ser inventado, e de a divulgar através de repositórios científicos e de admitir a sua cópia e distribuição com objetivos educacionais ou de inves-tigação, não comerciais, desde que seja dado crédito ao autor e editor.
Este documento foi gerado utilizando o processador (pdf)LATEX, com base no template “unlthesis” [1] desenvolvido no Dep. Informática da FCT-NOVA [2].
A c k n o w l e d g e m e n t s
A b s t r a c t
Nowadays, TCP channel estimation is a matter of great importance, being communi-cation network metrology the core of network performance analysis field, since it allows to interpret and understand the network behaviour through the gathered metrics. In the context of this dissertation, an open source software project, available on GitHub, was de-veloped. It uses a client-server architecture to estimate the Bulk Transfer Capacity (BTC) and provides portability due to Java and Android clients, being able to run on computers, tablets and mobile phones.
Two algorithms to measure the BTC were deployed. Their measuring capacity was analysed and optimized, supported on studies about the influence of the TCP windows. The packet train dispersion algorithm was also implemented and analysed, but it did not allow measuring significant BTC results. The performance of the tool was tested for wired and cellular wireless networks, considering all the major Portuguese network operators. The results were compared to the ones measured by the iPerf3 reference tool, considering a stop criteria based on Jain’s Fairness Index [1] in order to inject the less possible traffic
into the network.
The measurement results are in line with the methodology proposed by ETSI and Of-com to monitor the bandwidth, considering fixed time transmissions, and can contribute to reduce the transmission durations required to analyse each network.
R e s u m o
Actualmente, a estimação da capacidade de uma rede é uma questão de grande impor-tância, estando a metrologia de redes de comunicação no centro do campo da análise do desempenho de redes, uma vez que permite interpretar e compreender o comportamento da mesma através das métricas obtidas. No contexto desta dissertação, foi desenvolvido um projecto cujo código público está disponível publicamente no GitHub. Este usa uma arquitectura cliente-servidor para estimar oBulk Transfer Capacity (BTC), garantindo por-tabilidade devido aos clientes Java e Android, possibilitando a execução em computadores, tablets e telemóveis.
Foram implementados dois algoritmos para medir o BTC. A capacidade de medição da ferramenta foi analisada e optimizada através de estudos sobre a influência das janelas do TCP no débito. O algoritmopacket train dispersiontambém foi implementado e analisado, mas não permitiu medir resultados significativos de BTC. O desempenho da ferramenta foi testado em redes com e sem fios, incluindo as celulares, considerando todos os prin-cipais operadores de rede móvel Portugueses. Os resultados foram comparados com os medidos pela ferramenta iPerf3, que foi usada como referência, considerando um critério de paragem baseado noJain’s Fairness Indexde modo a injectar na rede o menor tráfego possível.
Os resultados das medições seguem a metodologia proposta pelo ETSI e pela Ofcom para monitorizar a largura de banda considerando as transmissões de tempo fixo, po-dendo contribuir para reduzir a duração das transmissões por cada rede analisada.
C o n t e n t s
List of Figures xv
List of Tables xvii
Acronyms xix
1 Introduction 1
1.1 Motivation . . . 1
1.2 Contributions . . . 2
1.3 Document Structure. . . 2
2 State of the art 3 2.1 Basic concepts . . . 3
2.1.1 Capacity . . . 3
2.1.2 Available Bandwidth . . . 4
2.1.3 Bulk Transfer Capacity . . . 4
2.1.4 One-way delay. . . 4
2.1.5 Round-trip time . . . 5
2.1.6 Packet loss . . . 5
2.1.7 Packet reordering . . . 6
2.1.8 Route . . . 9
2.1.9 Bandwidth . . . 9
2.2 Algorithms . . . 10
2.2.1 Active Measurements. . . 10
2.3 Platforms, Tools, Testbeds and Services . . . 17
2.3.1 Platforms. . . 18
2.3.2 Testbeds . . . 19
2.3.3 Tools . . . 21
2.3.4 Services. . . 22
2.4 Summary . . . 24
3.2 Server Side . . . 26
3.2.1 Operation overview . . . 26
3.2.2 Java deployment. . . 27
3.2.3 Measurement tests setup . . . 31
3.3 Client side . . . 32
3.3.1 Java deployment and operation . . . 32
3.3.2 Android deployment and operation. . . 34
3.3.3 Measurement tests setup . . . 40
4 Algorithms and Results 43 4.1 Introduction . . . 43
4.2 Algorithms description . . . 44
4.2.1 Method to reduce BTC measurement overhead . . . 45
4.3 Study of packet train dispersion algorithm as a function of packet size and sending time gap . . . 45
4.4 Study of BTC algorithms bandwidth as a function of TCP windows size . 48 4.5 Results . . . 50
4.5.1 Wi-Fi - ADSL network . . . 50
4.5.2 Wi-Fi comparison for ADSL network . . . 54
4.5.3 Wi-Fi - GPON network . . . 56
4.5.4 3G - Cellular network. . . 59
4.5.5 4G - Cellular network. . . 61
4.6 3G Portuguese ISP benchmark . . . 63
4.7 4G Portuguese ISP benchmark . . . 66
4.8 Accuracy analysis . . . 70
5 Conclusion and Future Work 71 5.1 Conclusion . . . 71
5.2 Future work . . . 73
L i s t o f F i g u r e s
2.1 Noticeable losses indicated by encircled numbers with∆= 99 [5] . . . 6
2.2 Sequences of 1 byte TCP data packets generated by the single connection test. All forward path packets are denoted with a dashed line and all reverse path packets a solid line [5] . . . 8
2.3 SYN test [5]. . . 9
2.4 Probe gap model [13] . . . 13
2.5 Available bandwidth estimation comparison between Pathload, IGI, and Spruce with 100 Mb/s path connecting UC Berkeley to MIT Laboratory for Computer Science (LCS) [13] . . . 14
2.6 Packet pair dispersion [18] . . . 16
2.7 Per-hop capacity using one-packet model [5]. . . 17
2.8 MITATE architecture and steps of a network traffic experiment [36] . . . 20
2.9 Campus map of University of Buffalo North indicating where the 3G to Wifi hand-offs occur [37] . . . 20
2.10 SmartProbe protocol [29] . . . 22
3.1 Implemented measurement protocol - sequence diagram . . . 26
3.2 Java user interface . . . 27
3.3 TCP Server UML class diagram . . . 28
3.4 Downlink bottleneck ofFilterOutputStreamclass in GPON scenario . . . 29
3.5 Uplink bottleneck ofFilterOutputStreamclass in 4G scenario . . . 30
3.6 TCP Client UML class diagram . . . 33
3.7 Android operating system architecture [53] . . . 35
3.8 Model-View-Controller [54] . . . 36
3.9 Android project diagram . . . 38
3.10 Internet measurement app logo . . . 38
3.11 Android Application first fragment tab . . . 39
3.12 Android Application second fragment tab . . . 39
3.13 Android Application third fragment tab . . . 39
3.14 Android Application fourth fragment tab . . . 39
4.3 Study of packet train dispersion as a function of sending time gap on the upload 47 4.4 Study of packet train dispersion as a function of sending time gap on the
download . . . 47
4.5 Study of Sample Second Thread algorithm . . . 49
4.6 Study of Sampling Read Time algorithm . . . 49
4.7 Sample Second Thread algorithm upload in ADSL network . . . 51
4.8 Sampling Read Time algorithm upload in ADSL network . . . 52
4.9 Sample Second Thread algorithm download in ADSL network . . . 53
4.10 Sampling Read Time algorithm download in ADSL network . . . 53
4.11 Algorithm comparison uplink . . . 54
4.12 Algorithm comparison downlink . . . 55
4.13 Transfered traffic uplink . . . 56
4.14 Transfered traffic downlink. . . . 56
4.15 Uplink in GPON network. . . 57
4.16 Downlink in GPON network . . . 58
4.17 Transfered traffic uplink . . . . 58
4.18 Transfered traffic downlink. . . 59
4.19 Upload in 3G network . . . 60
4.20 Download in 3G network . . . 60
4.21 Upload in 4G network . . . 61
4.22 Download in 4G network . . . 62
4.23 3G benchmark uplink mean - Android . . . 63
4.24 3G benchmark downlink mean - Android . . . 64
4.25 3G benchmark uplink mean - Iperf . . . 64
4.26 3G benchmark downlink mean - Iperf . . . 65
4.27 3G transfered traffic on the uplink . . . 65
4.28 3G transfered traffic on the downlink . . . 66
4.29 4G benchmark uplink mean - Android application . . . 67
4.30 4G benchmark downlink mean - Android application . . . 67
4.31 4G benchmark uplink mean - Iperf tool . . . 68
4.32 4G benchmark downlink mean - Iperf tool . . . 68
4.33 4G transfered traffic on the uplink . . . 69
L i s t o f Ta b l e s
A c r o n y m s
ACK Acknowledgement.
ADR Asymptotic Dispersion Range.
ADSL Asymmetric Digital Subscriber Line.
AOSP Android Opensource Smartphone Platform.
APK Android Application Package.
ART Android Runtime.
BART Bandwidth Available in Real-Time.
BTC Bulk Transfer Capacity.
DNS Domain Name Space.
DQR Disjoint Queuing Region.
ESnet Energy Sciences Network.
FTP File Transfer Protocol.
GPON Gigabit Passive Optical Network.
GPS Global Positioning System.
GUI Graphical User Interface.
HAL Hardware Abstraction Layer.
ID Identification.
IGI Initial Gap Increasing.
IP Internet Protocol.
IRB Institutional Review Board.
ISP Internet Service Provider.
JQR Joint Queuing Region.
JSON JavaScript Object Notation.
MIB Management Information Base.
MITATE Mobile Internet Testbed for Application Traffic Experimentation.
MRTG Multi Router Traffic Grapher.
MSU Montana State University.
MTU Maximum Transfer Unit.
MVC Model-View-Controller.
NAT Network Address Translation.
OS Operating System.
OWAMP One-Way Active Measurement Protocol.
PerfSONAR Performance Serive Oriented Network Monitoring Architecture.
PGM Probe Gap Model.
PMTU Path Maximum Transmission Unit.
PRM Probe Rate Model.
PTD Packet Train Dispersion.
QoS Quality of Service.
RNP Rede Nacional de Pesquisa.
RTT Round Trip Time.
SLA Service Level Agreement.
SLoPS Self-loading periodic streams.
SNMP Simple Network Management Protocol.
AC R O N Y M S
TTL Time to live.
UDP User Datagram Protocol.
UI User Interface.
UK United Kingdom.
UML Unified Modelling Language.
URL Uniform Resource Locator.
VoIP Voice over IP.
C
h
a
p
t
e
r
1
I n t r o d u c t i o n
1.1 Motivation
Internet measurement has been a relevant field in the comprehension and analysis of the network performance. Communication network metrology, which is defined as the science of network measurement, plays an important role in interpreting results through the metrics related with IP networks. These metrics can be obtained actively by injecting probe packets into the network, and passively by simply gathering the IP packets headers. In one way or another, measurement studies give to researchers, developers, regulators and the general public an overview of the bandwidth available and how much a TCP connection is able to use it. There are several techniques that perform communication network measurement in order to estimate the maximum achievable throughput of a network without causing congestion. Since the most problematic issue in TCP is to distinguish whether the packet was lost by congestion or due to the effects of the wireless
channels, estimation became very important because it provides a mechanism to improve the TCP performance, and the detection of the network capacity limits.
1.2 Contributions
The main goal of this dissertation is centered on the development of a Java measurement tool, that performs Bulk Transfer Capacity (BTC)estimation in line with the UK com-munication regulator (Ofcom) standard. Thus, BTC which is defined as the end-to-end throughput achievable using the TCP protocol, is measured by the developed tool using Java as an higher cross functionality programming language. According to this, a client-server architecture was built, and a new stop criteria was proposed, which reduces the traffic injected into the network, without affecting the measurements accuracy.
1.3 Document Structure
C
h
a
p
t
e
r
2
S t a t e o f t h e a rt
2.1 Basic concepts
Metrology is defined as the science of measurement, which includes all related theoretical and practical aspects. A new research area described as communication network metrol-ogy has been evolving and is being used to improve the congestion control scheme of TCP. Bandwidth related metrics such as capacity, available bandwidth and Bulk Transfer Capacity (BTC) are introduced in this section.
2.1.1 Capacity
Capacity is a measurement defined as the maximum amount of data that may be trans-ferred between two end points of a network. Hence, it is possible to distinguish between links at data link layer and at theInternet Protocol (IP)layer. In both cases the term rate comes up, since capacity is an upper bound for transfer rate for both mentioned layers.
Moreover, it is possible to express the layer 2 transmission rate delivered to the IP layer as a function of packet size. Prasadet al[3] define capacity as the maximum bit rate of a hop measured at the network layer, at which the hop can transferMaximum Transfer Unit (MTU)-sized packets. Furthermore in the text,Cidenotes the capacity of hopi. The minimum link capacity of a path is the metric that determines the end-to-end capacity of a path with H hops, which is expressed by,
C= min
2.1.2 Available Bandwidth
The capacity of a link is restricted by the underlying propagation medium. Hence, the available bandwidth additionally depends on the traffic load that crosses the link, which
usually varies with time.
Thus, the available bandwidth of a link is the spared capacity of that link during a certain period of time. Extending the previous definition in terms of average metrics, it is possible to defineui as the average utilization of hopi in a given time interval. This leads to the definition of available bandwidth, which can be expressed as the unutilized fraction of capacity in a given hopias
Ai= (1−ui)Ci. (2.2)
Similarly to the capacity case, the minimum available bandwidth of hopiin a given path determines the end-to-end available bandwidth.
2.1.3 Bulk Transfer Capacity
The bulk transfer capacity is the maximum throughput achievable by a single TCP con-nection. This metric can be calculated as the average number of bytes transmitted per time unit [4], using the TCP protocol. In contrast to available bandwidth, which assumes that average traffic load remains constant, the BTC depends on how the bandwidth is
shared with concurrent TCP flows.
2.1.4 One-way delay
The one-way delay is defined in [5] as the time a packet takes from source to the des-tination, which is often calculated as the half of Round Trip Time (RTT). However, as Paxson mentioned in [6], paths tend to be more asymmetric, which means gradually the links bandwidth measurement will be different in both directions. Actually, this is what
happens nowadays, since the upload speed is lower than download, and this contributes to preserve the devices battery.
IP Performance Metric (IPPM)is defined in RFC 2679 [7] as the one-way delay the first bit of a packet takes from the source at timeT, to the receiver, at timeT+dT, i.e.dT. The measurement process is executed by calculating the delay. Since the packet is stamped at timeT on the source, the destination just needs to read out the clock in order to obtain the delay. Obviously, this kind of technique implies synchronization in both end-systems, which may lead to measurement errors. Hence, the calibration has the im-portant role of determining systematic and random errors generated by the instruments, since generally, the measured value is the sum of true value, systematic error and random error. The value measured also depends of the protocol (User Datagram Protocol (UDP) or TCP), size, etc., which define different contents to the IP packet [7].
2 . 1 . BA S I C CO N C E P T S
(OWAMP)[8], allowing the measurement in the forward and reverse path according to IPPM recommendations.
2.1.4.1 One-way delay variation
Delay variation, often called jitter, is a key metric to ensure quality of service in many applications.
The IP packet delay variation or delay variation can be calculated from a selected pair of packets within a stream that is being transferred between two measurements points. Hence, the difference between the one-way delay of the selected pair of packets is also
called delay variation.
The measurement is done by computing the delay difference between two
consecu-tive packets, which does not need clock synchronization since errors will cancel each other when calculation occurs. Related with uncertainties in clocks, the resolution problem appears, because at end-systems the clock precision may be compromised. For example, in Linux operating systems older than version 2.2.0, the clock resolution is about 10ms [5].
2.1.5 Round-trip time
TheRTTis the delay that a data packet takes to travel from the source to the destination plus the delay required for anAcknowledgement (ACK)to travel back to the source.
The measurement of RTT is simpler than one-way delay because the calculation of transmission times is only done at the source. When the source sends the first bit of a packet, it stamps the current time in the packet. At the receiver side, when the packet is fully received, it sends an acknowledgement response to indicate the successfully delivery. Finally, the RTT is calculated at the source through the difference between the time stamp
and the arrival time of the ACK.
Ping is an example of non-cooperative tool that uses ICMP echo packets to measure the time taken from the source to the destination plus the time taken by the ICMP reply packets to come back.
2.1.6 Packet loss
TCP uses packet loss as a signal of congestion. The loss pattern or loss distribution is a key parameter based on statistical association of loss distance and loss period that is crucial in certain applications like audio or video. As defined in RFC 3357 [9] by IETF, the loss distance is the difference between the“sequence numbers of two successively lost
packets which may or may not be separated by successfully received packets.”A loss period metric measures the frequency and length of consecutive lost packets. According to this, loss distance could gather the spacing between loss periods.
average inter-loss periods can also be calculated. Another statistical process called one-way loss noticeable rate defines that a packet loss is noticeable when the distance between two consecutive lost packets is lower than a given∆, defined as loss constraint. Figure
2.1 illustrates an example of the referred technique, where a sequence of packets is sent, being the encircled packets classified as noticeable losses, since the loss constraint is lower than a defined value,∆= 99 in this case [5].
One-way packet loss measurement is deployed in OWAMP allowing the measure to occur in forward and reverse channels. It is through the time-out values that detection of non-received packets is performed. If the ACK corresponding to the sent data packet is not received in a defined period of time, the packet is considered lost. Moreover, a technique based on TCP acknowledgements, performed in two phases, may also be applied. The data-seeding phase is the first phase and it consists on sending at the source a series of TCP packets. The second phase, called hole-filling phase, has the role of discovering lost packets sent in the first phase. The source assumes that when the last acknowledgement corresponds to the last sent packet, no packet has been lost. Otherwise, the source will record and retransmit the lost packets until all of them are acknowledged. Since in most of the TCP implementations receivers wait approximately 100 to 500ms to respond, they do not respond with one ACK per packet. This raises the demand for forcing the destination to send those acknowledgements during the tests. One way to do that is sending packets out of order to trigger the fast-retransmission algorithm. This algorithm also known as duplicate ACKs method, do retransmissions if three repeated ACKs are received. Therefore, it is possible to calculate the loss rate at the source on the reverse path by knowing the sequence numbers of the sent packets and the sequence numbers of the acknowledges.
Figure 2.1: Noticeable losses indicated by encircled numbers with∆= 99 [5]
2.1.7 Packet reordering
2 . 1 . BA S I C CO N C E P T S
out of order packet delivery may lead to unnecessary retransmissions and/or unnecessary reduction of the congestion window, which lead to an inefficiency of the referred protocol.
Ordered delivery is crucial specially for real-time media applications. Multi-path routing, parallelism in networks devices, layer 2 retransmissions and multiple buffers
with different rate services are reasons that may change packet delivery order. Hence, an
effort has been made in order to enhance the retransmission scheme of TCP. Consequently,
OWAMP protocol allows the measurement to be performed along the forward and reverse path by sending and analyzing streams of packets. Therefore, a new set of techniques presented in [10] provides a reliable one-way reordering estimation in both directions between a probe host and most TCP-based servers on the Internet. Those tools implement techniques which perform tests by establishing one or more connections to a remote host in order to verify whether the packets are correctly delivered.
The single connection test uses the standard three-way handshake for establishing the connection. Once this connection is established, each sample is measured in two different phases: a preparation phase and a measurement phase. Since most of TCP
implementations use a delayed acknowledgment algorithm in the hopes of combining a data frame with an ACK on an outgoing packet, it forces the source to send a packet with an unexpected sequence number in order to receive an ACK for each sent packet as illustrated in figure 2.2. This feature allows the sender to infer if both packets and ACKs were reordered in flight. As shown in figure 2.2, the preparation phase occurs by sending an out of order packet (data 2) to the remote host. On the second phase the reordering measurement is performed by sending two sample packets. If the packets are delivered out of order the ACK 1 will be received followed by ACK 4, meaning that data packets were not reordered in flight since data 3 arrived first than data 1. Otherwise, if the ACK 4 arrives at the sender first, it will confirm the whole series meaning that packets were reordered in flight. The same principle can be applied to the reverse channel as figure 2.2 demonstrates, whereas data 3 was delivered after data 1, however, ACK 4 was received before ACK 3, meaning that the acknowledgements were also reordered in flight.
Although this approach may perform a reliable packet reordering measurement, it has some limitations due to the fact that it requires two data packets to evaluate whether the reordering occurred or not, since if one of the data packets or ACKs were lost, there is no possible evaluation. Another coincident problem related with the remaining sample packet is that when this packet has been discarded (e.g.situations with considerable loss rates) that may influence the measurements if the loss is correlated with reordering. The dual connection test was deployed in order to deal with the previous limitations. In this approach, two sample packets with sequence numbers greater than expected are sent to the remote host by two different connections, being one sent for each connection. The
be performed by comparing the difference between the IPIDs of the acknowledgments
and the order in which the sample data packets were sent. Since two connections are used, it is always possible to associate each data packet with source and destination port numbers. Notice that in the majority of systems, the Nagle’s algorithm [11] is enabled by default, causing a delay in the acknowledgments in order to improve the efficiency of
TCP/IP networks.
Altough this approach mostly eliminates this delayed algorithm problem by using two different connections, this can be problematic when the remote host uses a load
balancer. Besides that, this approach assumes that IPID uses an increasing function which may not always be true.
Since the load balancers always forward packets of a given TCP connection to the same host, a third method has been proposed to solve this issue. The SYN test method takes advantage of TCP three way handshake by sending a pair of SYNs with different
starting sequence numbers. As illustrated in figure 2.3, the sender will receive different
sequences of packets depending whether the reordering happened on the forward or on the reverse path. When the first SYN arrives it will trigger the SYN RECV state of the remote host, which will generate a SYN/ACK response. On the other hand, when the second SYN arrives, the sequence number is verified, and when is inside the window range a RST response should be generated. Otherwise the remote host will answer with a pure ACK to indicate that the SYN arrived out of order.
2 . 1 . BA S I C CO N C E P T S
Figure 2.3: SYN test [5]
2.1.8 Route
In a network, each node is identified by its IP address. A route is an ordered sequence of nodes that represent a path between two end points of a network. A methodology to discover the route has been deployed in traceroute, which is a non-cooperative tool. This tool takes advantage ofTime to live (TTL)field which is decremented by one unit for each router on the path. The trace of the route is performed by first sending User Datagram Protocol (UDP) packets from the source to the destination with TTL equal to one. When the first router of the path receives the packet, it sends an ICMP message to the source indicating that the packet was discarded. Those ICMP messages contain the router address in the headers, which allows the source to identify that router as the first hop of the path. The same principle is applied in the next iterations of the algorithm by just raising the TTL value, the source should be able to identify every hop on the path. When the destination sends an ICMP message the technique is completed.
However, there is no guarantee that probe packets coming from different hops will
follow the same route as previous probes. Even when the route does not change at the IP layer, successive IP routers can be connected through different layer 2 technologies.
Another problem is related with the fact that the sender only identifies the hops on the path through the received ICMP messages, which might be a problem since not all routers send them.
2.1.9 Bandwidth
In the first section of this state of the art, some basic concepts related with measure-ment metrics were introduced, such as capacity, available bandwidth and bulk-transfer capacity. In the following sections these bandwidth related metrics will be presented along with the techniques and tools used in the context of TCP/IP networks to measure them.
2.1.9.1 Available bandwidth measurement
As seen in the basic concepts section, the available bandwidth of a link is the free capacity of the link during a certain period of time. The techniques of available bandwidth mea-surement can be divided into three categories defined asPacket Train Dispersion (PTD) [2],Probe Gap Model (PGM)[12] andProbe Rate Model (PRM)[5]. Moreover, a program called Multi Router Traffic Grapher (MRTG) [13] will also be introduced, since it is a reference in this matter.
2.2 Algorithms
Network metrology has been widely studied on many research projects and laboratories. There are several features related with traffic which are important in Internet
measure-ment such as characterization, volume, nature, modelling and matrices. Network cartog-raphy and network mapping, which consists on the research of physical connectivity of networks, have been areas of interest as well, since networks have become more and more dynamic and complex.
Moreover,Internet Service Provider (ISP)negotiateQuality of Service (QoS)levels through a standardized service contract namedSLAon which metrology can be useful to verify whether the established requirements are met.
2.2.1 Active Measurements
Active measurements are a set of techniques for network estimation that consists on send-ing probe packets with particular properties (packet size, inter-departure time, bitrate, etc.) from the source to the destination. Deployed algorithms that perform this kind of measurement are presented in this section. Tools that implement the following algo-rithms may be classified by their intrusiveness according to Prasadet al.in [1] who claims that “an active measurement tool is intrusive when its average probing traffic during the mea-surement process is significant compared to the available bandwidth in the path.”In fact, the use of active measurement tools results in intrusiveness problems on the network traffic,
being an example of that the tools that force routers and hosts to generate ICMP packets. For this reason, and in association with security purposes, there has been the necessity of filtering incoming Internet Control Message Protocol (ICMP) traffic, which results in
2 . 2 . A LG O R I T H M S
Tools that perform active measurements can be classified into cooperative and non-cooperative. Cooperative or passive measurement tools consist on computing metrics such as latency, rate and inter-packet gap by analyzing probe packets at the receiver side, which requires separated pre-installed software on both source and destination. Other-wise, the non-cooperative tools obtain in a indirect way all statistical information on the probes.
There are timing considerations such as clock accuracy, clock stability and clock syn-chronization, which can be a constraint in the measurement of end-to-end systems, as will be seen in the following algorithms. Passive measurement concepts will be mentioned along the text, reason why they will be introduced now as the techniques that are carried out by observing network traffic flows through the analysis of captured packet headers.
2.2.1.1 Packet train dispersion
The packet train dispersion is a technique implemented by cprobe [2], which consists on sendingNICMP echo request packets of sizeLto a destination in order to get ICMP reply packets in response, whereN >2. The dispersion denoted by∆(N) is the amount
of time between the reception of the first packet and the reception of the last packet. The available bandwidth, which is the same as throughput, is obtained by dividing the number of bytes sent by the elapsed time between the first and the last bits received as denoted by the equation 2.3 [5]. A stream of packets is sent with the objective of raising the probability of competing traffic load or cross traffic between the train probe packets.
If the packets from the probe tool are the only that are queued at the bottleneck link, the destination is able to measure the bottleneck bandwidth based on the inter-arrival time of those packets. Since the primary role of this method is the measurement of the available bandwidth, if the sending rate of probe packets is lower than the bottleneck speed, the absence of cross traffic will be felt. In this scenario, a metric calledAsymptotic
Dispersion Range (ADR), which relates to the utilization of all links in the path, is equal to the end-to-end capacity. In all other cases (i.e. with concurrent load), the ADR is not related with the available bandwidth and if the length of packet train is increased the measured variance is reduced, but the estimates converge to an ADR value which is lower than the capacity [14]. Asymptotic Dispersion Range may be a useful metric for monitoring the quality of service that the path offers, being the approach deployed in
pathrate [14].
A=(N∆−1)L
2.2.1.2 Self-loading periodic streams (SLoPS)
SLoPS [15] is a technique that performs end-to-end available bandwidth measurements. This method consists on sending a periodic packet stream of equal sized packets at rate R from the source to the sink in order to monitor one way delay variations of the sent packets. IfRis greater than the available bandwidthA, the delay will increase because packets are being queued in the path. Otherwise, ifR < Ano congestion occurs and the delay will remain constant. Moreover, the packet streams are spaced at the sender by creating a silent period between each stream, which maintains the average probing traffic
rate below ten percent of the available bandwidth.
Due to its iterative nature, this algorithm may have a long convergence time in obtaining the available bandwidth value.
2.2.1.3 Probe rate model
The PRM model’s primary objective is the detection of the point on which the delay along the path increases, because at this point the sending rate of the probing packets is equal to available bandwidth. If the source sends probe traffic with a rate lower than
the available bandwidth, the rate will be the same along the path because no packets are queued. On the other hand, if the sending rate raises, this technique will be able to seek for the turning point where the sending rate matches the arrival rate. This turning point is the available bandwidth measurement.
The probe rate model is implemented by two cooperative tools: Pathload [16] and PathChirp [17]. The Pathload implements an algorithm based on SLoPS technique which was explained above. On the other hand, PathChirp concerns are reducing the probing traffic that is loaded on the network. It performs that by sending a chirp probing train
on which the probe packets are exponentially spaced. Imagine a train chirp ofnpackets. This train only needs 2n−2 packets using a packet pair technique to exploitn−1 packet spacings. Additionally a single chirp train is able to perform all the network probing at different rates.
2.2.1.4 Probe gap model
The probe gap model (PGM) is a method which was initially implemented in cooperative tools, namelyInitial Gap Increasing (IGI)[12] and Spruce [13]. The PGM uses a packet pair to evaluate the available bandwidth by analyzing the pair dispersion. As is illustrated in the figure 2.4, two successive packets are sent with a time gap∆
in. Those packets arrive at the destination with a time gap∆
out, which means that the other traffic that crosses the bottleneck is transmitted in∆
out−∆in. According to this, the cross traffic rate is given by
∆
out−∆in
∆
in
2 . 2 . A LG O R I T H M S
the link is given by
A= 1− ∆
out−∆in
∆ in C (2.4)
On the other hand, IGI has a different approach: it defines two regions with different
queueing periods. A queueing period is defined as the time gap on which the queue is not empty. Hence, between two consecutive queueing periods the queue is empty. Two different regions are defined:Disjoint Queuing Region (DQR)andJoint Queuing Region
(JQR). The Initial Gap Increasing technique operates under the JQR condition if the queue of the bottleneck does not become empty between the time of the first packet leaves the router and the second arrives, otherwise it operates under DQR. This is guaranteed if ∆in is smaller or equal to the transmission time of the probe packet. However, if ∆
in is too small, it could flood the bottleneck. The experimental results carried out in [12] demonstrate that IGI tool starts with a small∆
in that is increased until the optimal point, which occurs when the average output gap is equal to the initial gap. Thus, IGI determines the available bandwidth assuming that the cross trafficCT at the bottleneck
is given byCT = C
∆out−L
∆in , whereL is the size of the probe packets andC is the
end-to-end capacity. Note that this approach defines∆out= L+CT∆in
C . Furthermore, the authors demonstrate that packet-pair dispersion increases linearly with the cross-traffic rate if
the JQR condition is valid.
Figure 2.4: Probe gap model [13]
2.2.1.5 Multi Router Traffic Grapher (MRTG)
The MRTG is a tool that usesSimple Network Management Protocol (SNMP). SNMP is a protocol that performs the network management in an IP network by collecting and analyzing the information about managed devices such as routers, switches, servers, hubs, printers on which each device has an associated Management Information Base (MIB). MRTG reads the load of the routers by collecting the information present in the MIB of each router.
cross traffic rate increased to 40 Mb/s, being absent the rest of the time, where only the
monitoring traffic was present in the path. Spruce demonstrates the best performance
among approaches of figure 2.5.
Multi router traffic grapher simulates traffic bitrate by generating HTML pages with
images with a measurement granularity no less than five minutes. A newer version, called MRTG++, has improved its granularity to ten seconds using an Autonomous System (AS) tool know as Available Bandwidth Estimator (ABEst), which provides information about link capacity and utilization. Since ABEst uses prediction to infer the available bandwidth, it can reduce the signalling and router load. Otherwise, an inherent limitation relates to the fact that it requires routers to modify the probing packets with data originated from the MIB.
2 . 2 . A LG O R I T H M S
2.2.1.6 End-to-end capacity
End-to-end capacity concept has been seen in the first section of this state of the art as being the minimum value of the capacities among all hops that composes the path. Despite that, it is possible to measure the end-to-end capacity directly by applying the packet pair dispersion technique, which is presented in this section.
Packet pair dispersion
The packet pair technique consists on sending two consecutive packets large enough to queue them at the bottleneck link. This method assumes that the bottleneck router uses FIFO queueing and also assumes that the pair of packets are sent with no other cross traffic between them. This pair arrives at the linki with a∆
in time distance beingLthe size of both packets. As shown in figure 2.6, the packet pair after crossing the bottleneck has a time dispersion equal to∆
out=max
∆
in,CLi
, whereCiis the capacity of the linki. When the packet pair arrives at the destination, the dispersion is given by the maximum dispersion (∆R) between the two probe packets among all the hops crossed by the pair in
the path. Hence,∆
Ris expressed by
∆
R= max i=1,...,H L Ci (2.5)
Note that the probe packets are stamped upon reception. According to this, the end-to-end capacity can be measured using
C=∆L
R
. (2.6)
This methodology is deployed in bprobe [2], SProbe [18], pathrate and Nettimer [19]. The measurement in bprobe assumes that the dispersion felt in the forward channel is the same as in the reverse channel. In other words, this method allows the source to calculate the end-to-end capacity since it is assumed that the packet pair dispersion does not change when packets come from the sink to the source as well as it assumes that paths and links are both symmetric. On the other hand, SProbe is also a non-cooperative tool which is capable of estimating the end-to-end capacity on both directions (downstream and upstream) by measuring the time dispersion between a pair of generated packets. Finally, the Nettimer is a cooperative tool which performs passive measurements through the analysis of traffic traces.
The quality of the measurements may be affected by the presence of cross traffic. The
packet pair technique assumes the absence of cross traffic between probe packets, which
Figure 2.6: Packet pair dispersion [18]
2.2.1.7 Per-hop capacity
This section presents two approaches to measure the capacity of each hop along the path: the one-packet model and the multi-packet model.
One-packet model/Variable packet size (VPS)
The one-packet model [20], also known as Variable Packet Size (VPS) model, consists on sending probe packets to the destination in order to measure the RTT from the source to each hop that composes the path. Through this method it is possible to express the packet delay as a function of the packet size since serialization delay is proportional to the size of the sent packet. The serialization delay, often called transmission delay, is the time required to push all the data to be transmitted from the network card to the transmission medium. It can be expressed by the ratio between the size of the packet and the transmission rate of the link. According to this, the capacity of a link can be determined by calculating the packet size change ratio needed to change the serialization delay. Hence, as illustrated in figure 2.7, the delay to reach nodelcan be measured by calculating the time intervaltl−t0, which is given by the sum of the transmission delays plus the propagation delays of all the links along the path. The expression is given by
Tl =tl−t0=
l−1
X
i=0
s
bi
+di !
, (2.7)
where s
bi represents the serialization delay anddi represents the propagation delay.
Fi-nally, the capacity of each link is denoted by
bl−1=
1
kl−kl−1, (2.8)
2 . 3 . P L AT F O R M S , T O O L S , T E S T B E D S A N D S E RV I C E S
kl =
l−1
X i=0 1 bi ! . (2.9)
Thekl’s values are determined using linear regressions together with the measure-ment delays of different packets sizes from the source (node 0) to the nodel.
Pathchar [20], Bing [21] and clink [22] are examples of non-cooperative tools that implement the VPS technique.
Figure 2.7: Per-hop capacity using one-packet model [5]
Multi-packet model
The multi-packet model [23], or tailgating model, is focused on intra-flow queueing delays. The technique is deployed in Nettimer and consists on sending sequences of two packets, being the first sent with a particular TTL. These two packets have different sizes:
the packetk−1 is the largest non-fragmented packet andkis the smallest possible one. The methodology assumes that the larger packet (tailgated) has a larger transmission delay. The packets are identified ask−1 andk. Thek−1 packet will be dropped at a specific hop according to the assigned TTL value. On the other hand, the smaller packet (tailgater) will continue without queueing because the first packet has been dropped.
The Nettimer has developed a new feature to cope with ICMP limitations. It uses TCP FIN/RST mechanism to force the receiver to sent back a RST segment in response to a sent tailgater FIN segment.
2.3 Platforms, Tools, Testbeds and Services
covering the end-to-end mobile network performance measurements, diagnosis and ap-plication prototyping is presented in tools and testbeds as well as in services. Finally, after giving a comprehensive overview of the current efforts, some future work will be
presented with the objective of showing the research directions of mobile network metrol-ogy.
2.3.1 Platforms
Internet measurement platforms have emerged in the past few years, which have been an important forthcoming to both, Internet Service Providers (ISPs) and users, since they provide an evaluation of the practiced Quality of Service (QoS). They also let consumers confirm whether the Service-Level Agreement (SLA) is being met. Despite the fact that a regular consumer can diagnose their home network using ISP benchmark, it also en-ables the possibility of the ISP to identify, isolate and fix problems related to the access network. Moreover, the measurements information is also important to network regula-tors whereas they can compare broadband providers offerings and allow the broadband
industry to implement new policies.
The platforms provide operational support by enabling network operators (ISPs) to diagnose and troubleshoot network infrastructure issues. Despite that, Internet access is provided by fixed-line and mobile access where several other measurements are made. Some relevant platforms are examined in this section. Netradar [26] is an example of a mobile access platform which started in 2012 and is operated by Aalto University. It uses a client-server based architecture where clients perform the measurements at the closest server. Servers are implemented in a cloud and globally distributed. Additionally, Netradar performs both active and passive measurements. Active measurements include metrics such as latency and TCP goodput, measured performing upload and download speed tests. Other informations like handovers, signal strength and locations are also measured during the process. Moreover, the research based on this platform studies the correlation between signal strength and network parameters. In [26] Sebastian Sonntag et al.have shown that the bandwidth is clearly affected by radio technology and signal
strength, being reduced by a third due to the congestion at the base station or even more due to poor provisioning.
2 . 3 . P L AT F O R M S , T O O L S , T E S T B E D S A N D S E RV I C E S
microtasks, which are a set of instructions resulting from aExtensible Markup Language (XML)file submitted by the central server. This central server can also push the micro-tasks into the mobile devices.
Operational support seeks the resolution of end-to-end performance problems. In order to solve multi-domain network issues, a collaborative initiative developed by En-ergy Sciences Network (ESnet), GÉANT, Internet2, and Brazil’s National Education and Rede Nacional de Pesquisa (RNP)has deployed thePerformance Serive Oriented Network Monitoring Architecture (PerfSONAR). It aims the identification and isolation of prob-lems that affect network paths that sustain scientific data exchange. PerfSONAR [31]
measures various metrics such as network utilization, available bandwidth, end-to-end latency, packet loss, connection stability and forwarding path.
Other Platforms such as SamKnows [32], BISmark [33], Dasu [34], RIPE Atlas [35] and RIPE TTM [8] also accomplish Internet measurement by gathering other metrics re-lated withDomain Name Space (DNS),Voice over IP (VoIP),File Transfer Protocol (FTP), Path Maximum Transmission Unit (PMTU),Global Positioning System (GPS), sattelite conditions, etc.
2.3.2 Testbeds
Nowadays Internet access is predominantly made by cellphones. Network testbeds are an usefull resource in order to evaluate the performance of mobile applications. Since real-time user interactions like multiplayer games, video chat or augmented reality have been widely deployed in the past few years, a low latency network service is desired to deliver user requests between mobile devices and cloud datacenters. There are previous studies which have shown that a significant variation in end-to-end mobile network per-formance affects the application request delay.
Additionally, end-to-end systems that emulate communication protocols to create performance profiles based on factors like signal strength, geographic location or net-work provider, need to be aware of user privacy policies, because they might be abusing of contributed user resources. It is possible to classify these approaches as uncurated and curated network testbeds. Uncurated testbeds perform users experiments without the necessity of Institutional Review Board (IRB) approval process. An example of an uncurated testbed isMobile Internet Testbed for Application Traffic Experimentation (MI-TATE)which has started in April of 2013 atMontana State University (MSU). MITATE [36] is innovative since it allows application prototyping traffic experiments between
mobile hosts and back end server infrastructure. It performs active measurements and proposes solutions to security and mobile resource sharing problems by separating traffic
experiment by uploading a XML configuration file to the database which can be queried for experiments in step 2. In step 3 the data defined by the experiment is transferred from the device to the measurement server when a criteria like geographic location or network type is met. In step 4, traffic metrics and network metrics together with metadata are
reported to the database. Finally, in the last step, the user has the option of accessing Web interface in order to visualize, or download the experiment data collected by multiple devices.
On the other half, curated testbeds with an IRB approval to their experiments may collect privacy information such as user’s traffic or location history. PhoneLab [37] was
started in 2013 at University of Buffalo North and is an example of a programable
net-work testbed. It is unintrusive and it focuses three main aspects, namely overall energy breakdown, opportunistic charging and 3G to Wifi transactions, being the latter illus-trated in figure 2.9. Moreover, it runs GoogleAndroid Opensource Smartphone Platform (AOSP)with the testbed integrated into theOperating System (OS), enabling the device to collect operational data (e.g phone status and battery level) as well as custom application log data, being both uploaded to PhoneLab servers during device charging. However, this option leverage no scalability since it depends on the data plan subsidy provided to the users as well as it depends on the phone’s hardware, which may become slow to support the testbed. There are other University projects that deployed network testbeds, not presented in this section [25].
Figure 2.8: MITATE architecture and steps of a network traffic experiment [36]
Figure 2.9: Campus map of University of Buffalo North indicating where the 3G to Wifi
2 . 3 . P L AT F O R M S , T O O L S , T E S T B E D S A N D S E RV I C E S
2.3.3 Tools
There are several methods and metrics to measure network performance. Measurement tools have been developed by industry, research and regulators. These tools may vary in how they gather network metrics and in how they select the measurement devices. Con-sequently, the major difference between a testbed and a tool is that a testbed is limited
to a certain set of experiments. Otherwise, a tool is able to perform wide-scale network monitoring during a long period, which may be useful to the mentioned use fields. A brief introduction to some tools is made in this section, providing an overview of the existing utilities. It covers iPerf, ping, OWAMP, traceroute, SProbe and Pathload.
IPerf [38] is a cross-platform command line tool which performs active measure-ments. It can gather multiple metrics related with timing, buffers and protocols in both
IPv4 and IPv6. For each test it reports the bandwidth, loss, and other parameters depend-ing on the protocol that is bedepend-ing used. For example, in TCP it is able to report Maximum Segment Size(MSS)/MTU size and observed read sizes, being jitter an example of UDP metric.
Ping is a command line tool that measures RTT by calculating the difference between
the time an ICMP echo packet is sent from the source and the time the ICMP reply packet arrives at the same source.
OWAMP is an active measurement tool which measures one way delay by inserting UDP test streams with negotiated features (packet size, number of packets, timestamps) into an IP network. It is formed by two different protocols, Control and
OWAMP-test, where OWAMP-test takes cares of transmitting probe packets between two measure-ment points. On the other hand, the OWAMP-Control is responsible for measuremeasure-ment sessions and for fetching their results. Note that OWAMP is a standard tool that gathers IPPM metrics in an interoperable way.
Traceroute, which is a tool previously described, compiles the list of hops travelled by an UDP packet including how long each hop takes from the source to the destination. It completes the list by taking advantage of TTL field which is defined to stop at a specific hop in order to generate an ICMP message, which contains the hop address. Thus, this technique is fully performed when an ICMP response from the sink reaches the source.
SProbe is a tool that takes advantage of the TCP behavior. In TCP, a SYN packet is answered with a RST packet when the SYN packet is sent to an unactive port. Hence, it is possible to determine the time dispersion of a channel in both directions by computing the difference in time at which the data packets were received. These data packets were
As illustrated in figure 2.10, after the initial handshake between the Estimator (E) and the Prober (P), thekvalue, representing the minimum length of packet train that will be sent by the Prober in each RTS message, is calculated. The estimator computes the relative delay sumSiand dispersionDias soon as it receives correctly a packet train. Otherwise, the train is invalidated at the timeout expiration. The network is assumed as congested whether three failures are experienced, resulting in this case in an experiment restart with half of the train length.
Pathload is a non-intrusive tool that uses UDP periodic streams for probing the network together with a TCP control channel for exchanging messages with the stream features between the two end points. Pathload available bandwidth measurements are comparable with the ones presented by MRTG test.
There are other utilities, such as Pathchirp, IGI and Spruce, which were mentioned in the algorithms section. Besides, there are other tools like Nettimer that implement Internet measurement but are not described in this state of the art.
Figure 2.10: SmartProbe protocol [29]
2.3.4 Services
There are also services that perform network monitoring as well as network discovery and diagnosis. This section introduces three services: OpenSignal, Vodafone NetPerform and Netalyzr. They offer insight to developers, researchers, regulators and network operators.
2 . 3 . P L AT F O R M S , T O O L S , T E S T B E D S A N D S E RV I C E S
OpenSignal [39] is a mobile application released in 2013 that supports active and passive measurement. Passively, it runs periodically measurements sending posteriorly the data to the OpenSignal servers. Actively, it also records multiple metrics. In order to estimate the download throughput, eight concurrent HTTP GET of 108 Mb files for each request are sent to a CloudFront’s CDN replica. The tests run during a certain pe-riod, after which the application is able to calculate the average download speed. The same principle is applied in the upstream direction, where multiple HTTP POST re-quests are sent to the Amazon AWS server with the objective of uploading small images. Equally, the HTTP HEAD method allows latency measurement by sending those requests to www.google.com. Furthermore, OpenSignal is able to gather network-related informa-tion to the Wifi as well as data associated with cellular networks, such as cell tower ID, location area code or even system ID if the device is connected to a cellular network. The major drawback of this deployment is that it is not capable of detecting the presence of traffic prioritzation or shaping. Moreover, hundreds of megabytes are needed to perform
throughput measurements, which can be complicated to users with low data plans. Vodafone NetPerform [40], which is a paid service in many countries, was started in 2014 with the purpose of understanding the amount of data used by the applications in-stalled on customer’s smartphones. Thus, it allows Vodafone to troubleshoot connectivity and bandwidth issues demanded by those applications. When it comes to functionality, at every hour a TCP connection is established with the Vodafone server in order to measure metrics such as latency variation or uplink/downlink rate. These metrics together with information collected from the cellular network, which includes signal strength, device location or the quality of 2G/3G/4G coverage, enable Vodafone to diagnose and resolve device related network issues. For example, by allocating high capacity bandwidth for services that have that kind of necessity. Similarly to OpenSignal, Vodafone NetPerform is not able to verify whether ISP is performing traffic shapping.
Finally, Netalyzr [41] service is a diagnostic tool that characterizes several issues re-lated with connectivity, performance and security. Netalyzr is able to record diverse data, includingNetwork Address Translation (NAT)detection, port renumbering, packet frag-mentation, path MTU, Wi-Fi/cellular configuration, network topology and other metrics related with DNS andTransport Layer Security (TLS). Netalyzr detects the presence of NAT by comparing public and private IP adresses, identifying how addresses and ports are renumbered. It is also able to detect HTTP and DNS proxies by sending requests to the back-end servers. In the former, the proxy is detected by examining the HTTP responses sent by the server for signs of modifications. The latter applies the same principle, since response parameters such as transaction ID or public IP address are verified. In both cases, a modification found means that a proxy exists.
To conclude, the future effort remains on the development of new tools that meet the
2.4 Summary
The state of the art related withInternet measurement is summarized in the following table, which contains the described algorithms and concepts with their relevant features as well as the tools and metrics related with those algorithms and concepts.
Algorithms/Concepts Features Metrics Tools
One-way delay[7] •Implies synchronization in both end-systems •Calibration determines instruments errors
One-way delay variation
(jit-ter), One-way delay OWAM[8], iPerf[38], ping Packet loss[9]
•Loss distance can gather the spacing between loss periods •Measurement in forward and re-verse channels
Loss distance, Loss period,
no-ticeable loss rate OWAMP
Packet reordering[10]
•Source infer if both packets and ACKs were reordered in flight through single and dual con-nection tests •SYN test - uses three way hand-shake to verify the reordering
One-way reordering in both
directions OWAMP, QoSMet
Route •UDP packets to trace the route Ordered IP addresses hops traceroute[42] Packet train
disper-sion[2]
•In the absence of cross traffic ADR is equal to end-to-end capacity •ADR metric[14] is useful to monitor the QoS of the path
Asymptotic Dispersion Range (ADR), end-to-end capacity, end-to-end available band-width
cprobe[2], pathrate[14] Self-loading periodic
streams (SLoPS)[15]
•Monitor one-way delay variations •Silent pe-riod between streams maintains probing traffic less than 10% of the available bandwidth
End-to-end available band-width
Pathload[16] Probe rate model[5]
•Search for turning points to detect available bandwidth •Chirp train only needs 2n−2 pack-ets using a packet-pair technique to exploitn−1 packet spacings
End-to-end available
band-width Pathload,
Pathchirp[17] Probe gap model[12]
•If the sending gap between packets (∆in) is
smaller or equal to the transmission time it is operating under Joint queueing region (JQR) condition •∆inis optimal when the average
out-put gap is equal to the initial gap
End-to-end available band-width
IGI[12], Spruce[13] Multi Router
Traf-fic Grapher (MRTG) test[13]
•Implements Simple Network Management Pro-tocol (SNMP) •Reduces signalling and router load by predicting autonomously the available bandwidth through Available Bandwidth Esti-mator (ABEst)
End-to-end available band-width
MTRG[13] Packet pair
disper-sion[2]
•Maximum dispersion (∆R) between two probe
packets among all the hops crossed along path gives the dispersion of that pair
End-to-end capacity bprobe[2], SProbe[18], pathrate, Nettimer[19] Variable packet size
(VPS)/One-packet model[20]
•It is possible to express the packet delay as a function of the packet size since serialization de-lay is proportional to the size of the sent packet
Per-hop capacity Pathchar[20], Bing[21], clink[22] Multi-packet model[23]
•The tailgated packet (k−1) is dropped at a spe-cific hop due to its TTL while the tailgater (k) will continue without queueing since the tail-gated have been dropped
C
h
a
p
t
e
r
3
C l i e n t- S e r v e r A r c h i t e c t u r e
3.1 Introduction
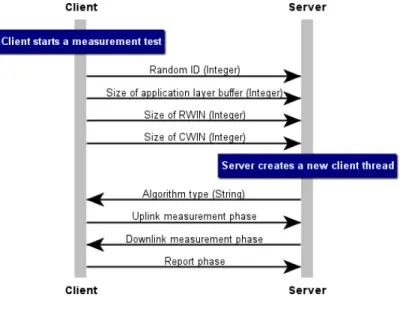
The client-server model has been widely used to support services in the context of dis-tributed systems, since it is possible to build a network architecture in which a client is physically separated from a server. The client is an instance that determines when the session starts and ends, by sending requests to a server which is awaiting for new requests in order to process them and send out responses.
The architecture proposed in this dissertation follows the client-server design. The server side was developed in Java, being the client side deployed both in Android and in Java, to be able to perform measurements in any TCP/IP network including cellular networks, such as 3G and 4G. The project is publicly available in the GitHub site, in theUniform Resource Locator (URL)https://github.com/glazeni/. According to this,
three BTC estimation algorithms were deployed in order to perform the measurements tests, which are executed during 32 seconds on both directions. Note that this measure-ment time is related to the regulations imposed byUnited Kingdom (UK)regulator Ofcom, on which the 3G/4G performance is evaluated by fixed time transferences of 30 seconds (transferring part of a 2 GB file) to test the downlink, and of 15 seconds (transferring part of a 100 MB file) to test the upload speed [43]. Hence, 2 extra seconds were used on each test with the objective of having at least 32 bandwidth measurement values, allowing to validate if it is possible to design an approach compatible with Ofcom’s. Moreover, as a support to the results validation, after the deployed BTC algorithms run, the command line iPerf3 tool [44] is launched directly from the code, with the purpose of having the least possible variation of the network conditions.
illustrated in figure 3.1. Three different algorithms were implemented. The first was
the packet train dispersion [2] adapted to the TCP scenario. The second and third were two different approaches of bulk transfer capacity estimation, named as Sample Second
Thread and the Sampling Read Time. These algorithms are described in detail in the fourth chapter.
This chapter explains the client and server applications implementation. It also presents the configuration setup used to perform the measurements.
Figure 3.1: Implemented measurement protocol - sequence diagram
3.2 Server Side
3.2.1 Operation overview
The server has a ServerSocket binded to port number 20000, listening for connection requests. At the moment that the connection is accepted, the server reads the client Identification (ID) in order to verify whether the client is registered or not. If it is a new client, a random integer ID is assigned and the server receives the measurement parameters defined by the client, such as the size of buffer upon send and reception, the
TCP congestion and receiver windows which will configure socket buffers, along with a
binary option, that specify if the Nagle’s algorithm is turned on or off. Hence, the client
3 . 2 . S E RV E R S I D E
been achieved, launching a new thread if it is not. Attending to the server specifications, which will be presented on section 3.2.3, a maximum of 30 simultaneous users was defined in order to avoid the system overload.
When the client thread is initiated, the server sends the measurement algorithm type to the client in order to perform the test. The general procedure is the same in the three presented algorithms: the three use three different TCP connections to perform the
upload, the download as well as the report phase on which the client sends the results to the server, which means that in practice, three different sockets are used by each end
point.
After the test is completed, the client sends a report to the server containing the results from the downlink measurement along with the bandwidth results obtained by iPerf tool.
3.2.2 Java deployment
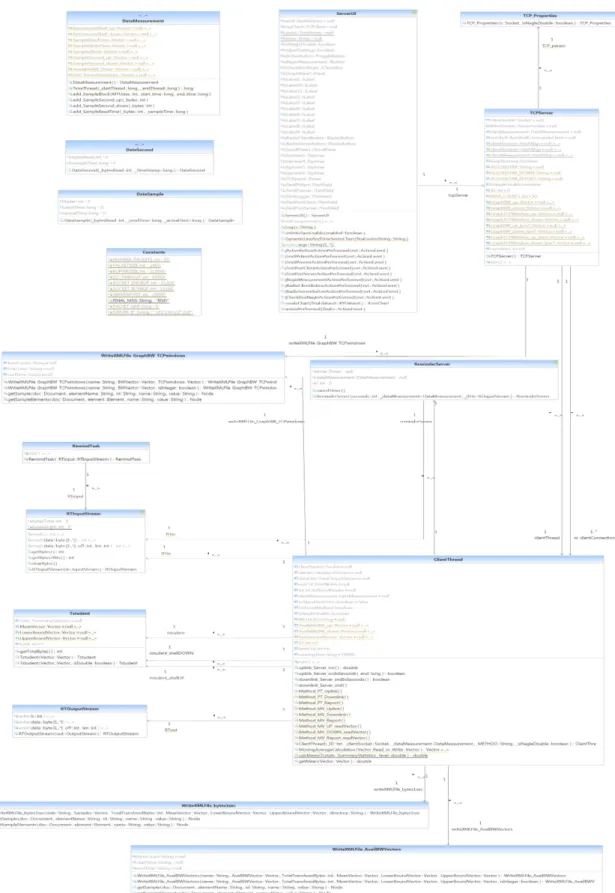
In this section theUnified Modelling Language (UML) class diagram corresponding to the server architecture, which is illustrated by figure3.3, is presented and explained in order to provide an entire comprehension of the developed work. Note that, the UML class diagrams presented along this chapter were generated under the UML Lab software [45]. Additionally, theGraphical User Interface (GUI)is illustrated by the figure3.2.
3 . 2 . S E RV E R S I D E
The main method of this project is located on theServerUIclass, which represents the serverUser Interface (UI), where the newTCPServerinstances are created through the click of the active button on the corresponding interface, as illustrated in figure3.2. The TCPServerclass has a socket configured with the parameters specified byTCP_Properties listening on port 20000 to let clients connect. When the ClientThreadis initiated, the server sends the algorithm type to the client, which will start the test. At this point, one of the three available methods will be selected, starting the uplink measurement part. Only the uplink measurement is started because it uses a different TCP connection than
the downlink, being still used a third connection in order to report the results back to the server.
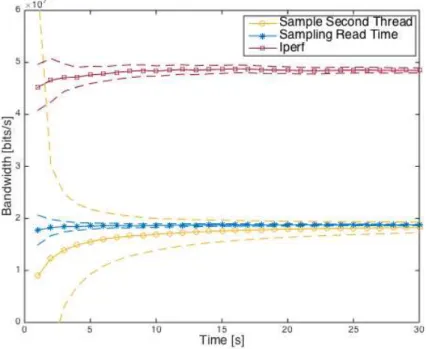
TheRTInputStreamand theRTOutputStreamare respectively the classes responsible for reading and writing bytes on the socket, being the reading class a subclass of FilterIn-putStream, while the writing class is a subclass ofPrintStream. It is important to notice that several tests were performed in order to choose the Java I/O classes. It was found that the FilterOutputStream is a bottleneck that does not allow reaching throughput values above 20 Mbps as is illustrated in figure 3.4, obtained on the downlink direction in a Gigabit Passive Optical Network (GPON)network. The throughput measured using the two algorithms was much lower than the one measured using Iperf.
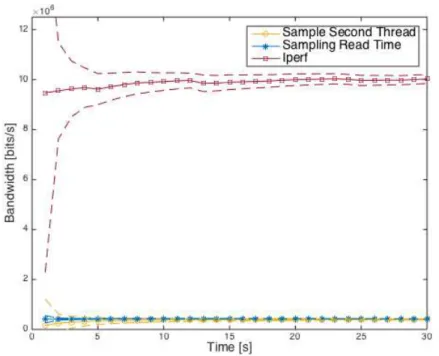
Figure 3.5: Uplink bottleneck ofFilterOutputStreamclass in 4G scenario
Moreover, in the Android environment, due to the inherent hardware limitations of the mobile phone, the throughput restraint was even more noticeable, with a measured band-width of 500 Kbps on the uplink direction, while with thePrintStreamclass, the Android application was able to measure up to 11 Mbps, as is shown in chapter 4.
TheDataMeasurementclass is where the samples are maintained. Between algorithm phases, new instances ofClientThreadare created, which require a separate class to keep measurement vectors independently for each client. After the uplink measurement is completed, the socket binded to this phase of the test is closed. At this moment, the client starts a new TCP connection to the server. When the server receives the incom-ing connection, it verifies if the client is already registered on the server, and starts a second TCP connection to perform the downlink test. When downlink measurement is accomplished, a third socket is binded to the same client ID. In this report phase, besides the downlink results, the client also sends the iPerf results obtained for both directions. When the server has all the results, the Student’s t-distribution confidence interval for mean values with unknown standard deviation is calculated using the Apache Commons Math API, [46], being then exported to aXMLfile, which contains the measurement test results along with the mean, lower bound and upper bound values calculated byt-student class. Note that, each measurement direction will generate two independent .xml files corresponding to the results acquired by the Java application and by the iPerf tool. The exporting procedure is handled by theWriteXMLFile_bytes1secfor both bulk transfer ca-pacity estimation algorithms, namely Sample Second Thread and Sampling Read Time.

![Figure 2.5: Available bandwidth estimation comparison between Pathload, IGI, and Spruce with 100 Mb/s path connecting UC Berkeley to MIT Laboratory for Computer Science (LCS) [13]](https://thumb-eu.123doks.com/thumbv2/123dok_br/16572144.738059/36.892.190.693.440.1076/available-bandwidth-estimation-comparison-pathload-connecting-berkeley-laboratory.webp)
![Figure 2.7: Per-hop capacity using one-packet model [5]](https://thumb-eu.123doks.com/thumbv2/123dok_br/16572144.738059/39.892.193.700.355.548/figure-per-hop-capacity-using-one-packet-model.webp)
![Figure 2.9: Campus map of University of Bu ff alo North indicating where the 3G to Wifi hand-o ff s occur [37]](https://thumb-eu.123doks.com/thumbv2/123dok_br/16572144.738059/42.892.187.707.915.1095/figure-campus-university-north-indicating-wifi-hand-occur.webp)
![Figure 2.10: SmartProbe protocol [29]](https://thumb-eu.123doks.com/thumbv2/123dok_br/16572144.738059/44.892.277.618.519.872/figure-smartprobe-protocol.webp)