http://dx.doi.org/10.21707/gs.v10.n04a28
A
minoAcidprofileAndpercentcompositionofmeAls AndfeedsusedinshrimpfArming
João Paulo de Sousa Prado1; José Marcelino Oliveira Cavalheiro1; João Andrade da Silva1; Thiago Brandão Cavalheiro1 & Fernanda Vanessa Gomes da Silva1
1Universidade Federal da Paraíba/UFPB- Campus I-s/n – Cidade Universitária- 58051-110, João Pessoa-PB - Brasil.
E-mail: [email protected]. Autor para correspondência.
Recebido em 13 de outubro de 2016. Aceito em 29 de novembro de 2016. Publicado em 19 de dezembro de 2016.
Resumo – Os crustáceos não necessitam de uma quantidade específica de proteína, mas exigem uma suplementação equilibrada
de aminoácidos essenciais. O objetivo deste trabalho foi avaliar a composição centesimal e o perfil de aminoácidos em farinhas e rações utilizadas na carcinicultura. As amostras utilizadas para o experimento foram rações comerciais com teores protéicos de 35% e 40% e farinhas de peixe e soja utilizadas nas formulações das rações. A composição química das amostras de ração e de suas respectivas farinhas de peixe e de soja foi determinada, conforme métodos da AOAC e as análises para obtenção do perfil de aminoácidos foram realizadas utilizando-se um sistema de HPLC, em modo de gradiente de eluição. Os percentuais obtidos de umidade, cinzas, proteína, lipídios e fibras referentes das duas amostras de farinha de peixes (FPA e FPB) foram de 4,4; 14,3; 61,8; 12,8; 0,1% e 5,9; 17,1; 53,9; 6,9; 0,30%, respectivamente. Os percentuais obtidos de umidade, cinzas, proteína bruta, lipídios e fibras referentes das duas amostras de farinha de soja (FSA e FSB) foram de 5,5; 13,2; 46,7; 4,0; 5,2% e 5,8; 11,9; 49,0; 5,8; 4,5%, respectivamente. Comparando-se os resultados de perfil de aminoácidos das rações utilizadas na presente pesquisa com os determinados pelo escore químico, nota-se que as rações A e B não se mostraram satisfatórias quanto ao teor de aminoácidos essenciais, com exceção apenas da lisina que mostrou EQ superior ao padrão. As farinhas de peixe e soja utilizadas na formulação da ração comercial (RA) apresentaram perfil de aminoácidos de qualidade superior aos encontrados nas farinhas utilizadas para obtenção da ração comercial (RB).
pAlAvrAs-chAve: Litopenaeusvannamei, Farinhadepeixe, Farinhadesoja
AbstrAct – Crustaceans don’t require a specific amount of protein but require a balanced supplementation of essential amino
acids. The aim of this study was to evaluate the composition and profile of amino acids in feed and fish meal used in shrimp farming. The samples used for the experiment were commercial feed with protein levels of 35 and 40% and fish meal and soya meal used in feed formulations. The chemical composition of the feed samples and their respective fish meal and soya meal were determined according to the AOAC methods and analyzes for obtaining amino acid profile was performed using an elution gradient in HPLC system. The percentages obtained of moisture, ash, protein, fat and fiber related the two samples of fish meal (FPA and FPB) were 4.4, 14.3, 61.8, 12.8, 0.1% and 5 , 9, 17.1, 53.9, 6.9; 0.30%, respectively. The percentages obtained of moisture, ash, protein, fat and fiber related the two samples of soy flour (FSA and FSB) were 5.5, 13.2, 46.7, 4.0, and 5.2% 5.8, 11.9, 49.0, 5.8; 4.5%, respectively. Comparing the results of amino acid profile of the feed used in this study with those determined by chemical score, it can be noted that diets A and B were not satisfactory in the content of essential amino acids, except lysine, which showed chemical score (EQ) higher than the standard. The fish meal and soya meal used in the formulation of commercial feed (RA) had amino acid profile superior to those found in meals used for obtaining commercial feed (RB).
Key Words: Litopenaeusvannamei, FishmeaL, soyFLour
perfildeAminoácidosecomposiçãocentesimAldefArinhAserAçõesutilizAdAsnAcArciniculturA
Resumen – Los crustáceos no requiere una cantidad específica de proteínas, pero que requieren una suplementación equilibrada
de aminoácidos esenciales. El objetivo de este estudio fue evaluar la composición química y el perfil de aminoácidos en la harina y piensos utilizados en el cultivo de camarón. Las muestras utilizadas para el experimento fueron dietas comerciales con los niveles de proteína de 35% y 40% y la harina de pescado y de soja utilizado en las formulaciones de la alimentación. La composición química de las muestras de piensos y sus respectivos alimentos de pescado y de soja se determinó como AOAC y analiza para obtener el perfil de aminoácidos se realizó utilizando un sistema de HPLC, el modo de gradiente de elución. Los porcentajes obtenidos de humedad, cenizas, proteína, grasa y fibra en relación con las dos muestras de harina de pescado (FPA y FPB) fueron 4,4; 14,3; 61,8; 12,8; 0,1% a 5,9; 17,1; 53,9; 6,9; 0,30%, respectivamente. Los porcentajes obtenidos perfildeAminoácidosylAporcentAjedecomposicióndelAAlimentAcíonyelpiensosusAdosenlAcríAdecAmArones
de humedad, cenizas, proteína bruta, grasa y fibra referentes de dos muestras de harina de soja (FSA y FSB) fueron 5,5; 13,2; 46,7; 4,0; 5.2% y 5.8; 11,9; 49,0; 5,8; 4,5%, respectivamente. Comparando los resultados para alimentar el perfil de aminoácidos utilizados en este estudio con los determinados por la puntuación química, tenga en cuenta que las raciones de A y B no fueron satisfactorios como el contenido de aminoácidos esenciales, con la única excepción de la lisina que mostró EQ excede el estándar. pescado y soja harinas utilizadas en la formulación de alimento comercial (RA) mostraron el perfil superior de aminoácidos encontrado en la harina utilizada para obtener el alimento comercial (RB).
pAlAbrAs clAve: Litopenaeusvannamei, harinadepescado, harinadesoja.
i
ntroductionThe food is the most significant fraction of the operating costs of companies in the farming of aquatic organisms in general (Tacon, 1990) and feeding management is the critical factor in determining the feasibility of a shrimp farm (Akiyama and Polanco, 1997).
Crustaceans do not require a specific amount of protein but require a balanced supplementation of essential amino acids. An effective dietary of protein source must meet the requirements for essential and non-essential amino acids (Guillaume, 1997). Essential amino acids of the crustaceans are well known in studies of adults of various species; all these studies agree that arginine, histidine, isoleucine, leucine, lysine, methionine, phenylalanine, threonine, tryptophan and valine are essential amino acids in the diet for crustacean (Holme et al. 2009). However, tyrosine and cysteine should be considered semi-essential amino acids since their presence reduces the dietary requirement of phenylalanine and methionine, respectively (Guillaume, 1997). The profile of amino acids present in proteins is decisive to determine its quality and its value as a component of the diet.
In crustaceans, the amino acids present osmoregulators function. Furthermore, they are largely responsible for the flavor of the shrimp. Glycine is mainly responsible for the sweet taste and arginine, leucine, glutamic acid and proline also have great participation, contributing to its distinctive flavor (McCoid et al. 1984).
Quantitative needs of essential amino acids for larvae and juveniles of Litopenaeusvannamei need to be further studied and formulations with excess protein in the diet are common. Therefore, these diets can be unbalanced in its amino acid composition.
Although research has been conducted, there is little information about the amino acid profile of the composition of meals and feed for shrimp, so the objective of this study was to evaluate the composition and profile of amino acids in feed and meals used in shrimp farming.
m
AteriAlAndmethodsThe study was performed at the Laboratory of Fishery Product Development and Flavor Laboratory of the Department of Food Engineering, Campus I, Universidade Federal da Paraíba (UFPB), João Pessoa, Paraíba.
The samples used for this experiment were commercial feed with protein contents of 35 and 40% and fish meal and soya meal used in the formulation of feed with the following characteristics: Extruded feed and later transformed into the form of pellets with 1.0 to 1.8 mm in diameter with 40% protein (feed 40A); extruded feed and subsequently converted into the form of pellets with a diameter of 2.38 mm, with 35% protein (feed 35A); extruded feed and
subsequently converted into the form of pellets of 1 to 1.7 mm in diameter, with 40% protein (feed 40B) and extruded feed subsequently converted into the form of pellets with 2.0 to 2.5 mm in diameter, with 35% protein (feed 35 B); fish meal used in feed formulation A (FPA), fish meal used in feed formulation B (FPB); soya meal used in the formulation of the feed A (FSA); soya meal used in the formulation of the feed B (FSB).
For the analysis of chemical composition, samples of feed and the respective fish meal and soya meal were submitted, according to AOAC (2000) methodology.
Analyses for obtaining amino acid profile were performed using the methodology used by White et al. 1986. It was used an elution gradient in HPLC (Varian model 1690 with drag detector diode, C18-Waters 3.9 x150mm, 5μm) system for determination of amino acids. The mobile phases employed consisted of mobile phase A: sodium acetate buffer (0.014 M) and mobile phase B: Acetonitrile: Water 60/40. The sample injection (20μL) was performed manually and the detection was at 245nm. The chromatographic separation was performed with an elution gradient at a temperature of 35 ºC. For identification of the chromatographic peaks, the comparison of the retention times obtained with standards of amino acids (Sigma-AAS-18) under the same chromatographic conditions and the absorption spectra obtained in drag diode detector (DAD) was used. The quantification was performed by external standard.
After the amino acid composition of the protein sources (g amino acid / 100g of protein) was determined the quality of the total protein was evaluated by calculating the chemical score (EQ ) and the content of essential amino acids (IAAE). Both methods compare the protein amino acid tested with those of egg protein (NRC, 1983) which is recognized as complete and of high biological value for fish (Hepher, 1988). Thus, for the chemical score calculation, it is assumed that the egg protein is the highest biological value for promoting growth and this will be limited by the essential amino acid in the diet, the rate of which in relation to egg protein is lower:
The ratio of essential amino acids (IAAE) is a calculation given by the geometric mean ratio of all essential amino acids obtained previously by chemical score (Hepher, 1988).
Where:
a, b, c ... j are the percentages of AAE in the protein evaluated; ap, bp, cp ... jp are the percentages of AAE in the standard protein.
The results of the analysis, in triplicate, were statistically analyzed by analysis of variance (ANOVA) and Tukey’s test applied between the means at 5% probability using the SPSS version 14.0 (SPSS Inc, 2001) according with Marocco, 2007.
r
esultsAnddiscussionThe chemical composition and amino acid profile of fish meal can be seen in table 1. The percentages obtained of moisture, ash, protein, fat and fiber related the two samples of fish meal (FPA and FPB) were 4.4, 14.3, 61.8, 12.8, 0.1% and 5 , 9, 17.1, 53.9, 6.9; 0.30%, respectively.
Table 1 - Percent composition and amino acid profile of fish meal used
in the preparation of commercial pet food.
Nutrients (%) Fish Meal A (FPA) Fish Meal B (FPB)
Moisture 4,43b±0,38 5,85a±0,16 Ash 14,26b±0,62 17,08a±1,09 Proteins 61,79a±0,58 53,90b±0,49 Lipids 12,77a±0,49 6,90b±0,30 Fiber 0,10b±0,00 0,30a±0,00 Phosphorus 1,27b±0,07 1,58a±0,07 Calcium 2,83a±0,25 2,77a±0,15 Amino acids (mg/100g) Fishmeal A (FPA) EQ (chemical score) of fish meal A Fishmeal B (FPB) EQ (chemical score) of fish meal B Isoleucine 4,21a±0,22 77 1,64b±0,12 30 Leucine 6,69a±0,07 74 2,49b±0,31 27 Arginine 4,56a±0,29 70 0,10b±0,00 2 Valine 5,24a±0,11 78 1,98b±0,17 30 Methionine 1,39a±0,04 41 0,55b±0,00 16 Lysine 8,83a±0,14 128 4,07b±0,36 59 Phenylalanine 4,79a±0,15 83 1,55b±0,10 27 Histidine 1,84a±0,14 71 0,97b±0,05 37 Threonine 8,45a±0,16 163 3,73b±0,31 72 AsparticAcid 2,90a±0,19 0,61b±0,04 GlutamicAcid 5,27a±0,16 1,63b±0,03 Proline 0,29a±0,02 0,13b±0,00
Serine 0,44a±0,03 0,27b±0,00
Glycine 5,82a±0,09 2,17b±0,14
Tyrosine 2,20a±0,14 0,83b±0,06
Alanine 0,30a±0,02 0,11b±0,00
IAAE 81,20 23,89
Different letters in the same row indicate significant differences by Tukey test (α = 95%). IAAE-essential amino acid index, EQ-chemical score.
The values of the chemical composition of fish meal had significant variation when compared to those described in International tables (Blas et al. 2003; NRC, 1998) with most of the results are inferior. These results can be attributed mainly to the different processing methods and raw materials used in other countries. Viestes et al. 2000 observed variation between meals when they assessed the chemical composition of various meat and bones meals.
The moisture values found in fish meal (FPA and FPB) were 4.43 and 5.85%, respectively. Anderson et al. (1997) evaluated the moisture of fish meal (made from inferior quality fish and leftover sardines - Clupeaharengus - fish grown in Canada) and observed a range from 5.1 to 6%, values close to those found in this study.
One of the factors limiting the use of fish meal obtained from fish leftovers of industrialization is its high ash content (Millamena, 2002; Boscolo et al. 2004) which, when included at high levels in feed, will help to raise the phosphorus, the main environment eutrophication agent (Hardy, 1996; Sugiura et al. 2000). In samples of fish meal (FPA and FPB) it was observed values of 14.26 and 17.08% ash respectively, close to the levels observed by Hardy, 1996, Rostagno et al. 2000 and Boscolo et al. 2008 in fish meal produced from fish leftovers. Values higher than those found in this experiment were observed by Boscolo et al. (2004) that evaluated meal of tilapia leftovers and found values of 30.13% ash. Sugiura et al. (2000) that evaluated fish meal produced with skin and bones and obtained 38.50% of ash. Moreover, flours of better quality exhibit ash levels less than 15% of minerals (Maina et al. 2002; Sales and Britz, 2003.
Samples of fish meal (FPA and FPB) showed values of protein of 61.79 and 53.90% respectively, these values characterize them as protein foods, but this protein content is less than those observed for fish meal evaluated by Hardy, 1996 and Olvera-Novoa et al. 1997 who observed values of protein of 68.16, 71.00 and 64.31% , respectively. In studies realized by Hardy (1996) and Sugiura et al. (2000) with fish meal, the protein levels were 48.13, 57.50 and 46.90% respectively, values which are smaller than those found in this study. Analyzing the values found in the literature of Boscolo et al. 2008 he classified flours from filleting leftovers into at least two classes, high quality meal with protein levels above 60%, which is probably produced from whole fish and second class meals, where are used in its manufacture leftovers from fish processing and with values of protein around 50%. Thus, the fish meal used for the production of feed A (FPA) may be considered superior with regard to the fish meal used for the production of feed B (FPB).
The fat content of fish meal (FPA and FPB) evaluated in this experiment were 12.77 and 6.90%, respectively. Boscolo et al. 2004 evaluated the fat into residue tilapia meal and found values
of 21.77%. This difference between the fat content of the tilapia meal with most commercial fish meal is mainly due to their physical constitution, which is understood by a large portion of viscera is the primary site of fat deposition of tilapia. In most commercial fish meal, described by other authors, the fat percentage is close to 10%.
The fish meal (FPA and FPB) evaluated in this study showed low phosphorus values of 1.27 and 1.58% respectively. The intensification of fish farming also raises concern about the waste generated in this activity. The phosphor is considered as the principal environment eutrophication agent (Hardy, 1996; Sugiura et al. 2000). Anderson et al. 1997 observed a change of 2.3 to 2.5% of phosphorus in the pilchard fish meal, results that can be related to the presence of phosphorus in the hard tissues of the fish.
The fish meal (FPA and FPB) evaluated in this study showed calcium content of 2.83 and 2.77%, respectively. Fish meal produced from sardine leftovers produced by Anderson et al. 1997 shows calcium content ranging between 3 and 4.1%, values that may be indicators of high ash content (12.4 to 13.6%). According to Hildebrand, 1995, the fish have three types of hard tissues: enamel, dentin and bone, which are composed of elongated crystals of hydroxyapatite [3 (Ca3PO4) 2.Ca (OH) 2], which may explain this high percentage of calcium found in fish flour.
The amino acid composition of proteins of fish meal (FPA and FPB) and the Chemical Score (EQ ) and the Index of Essential Amino Acids (IAAE), for evaluating the quality of protein, are shown in Table 1. The fish meal (FPA and FPB) had amino acidic levels below those presented by high quality meal, mainly from Chile, Peru and Denmark, especially with respect to essential amino acids. The samples evaluated showed approximately 60% of the quantity of lysine in that meals. With regard to the non-essential amino acids, we can see that the levels of proline and alanine are similar to those reported by Lee et al. 2002; Sales and Britz, 2003.
The analysis of the chemical score (EQ ) allowed to determine the order of limiting amino acids in both fish meal analyzed. This calculation was based on comparison with the amino acid profile of egg protein, as recommended by Halver, 1988 and Hepher, 1988, in view of high protein requirement of shrimps.
The chemical composition and amino acid profile of soya meal can be seen in Table 3. The percentages obtained of moisture, ash, protein, fat and fiber related the two samples of soya meal (FSA and FSB) were 5.5, 13.2, 46.7, 4.0, and 5.2% 5.8, 11.9, 49.0, 5.8; 4.5%, respectively.
Table 2 - Percent composition and amino acid profile of soya meal used
in the preparation of commercial foods analyzed.
Nutrients (%) SoyaMeal A
(FSA) SoyaMeal B (FSB)
Moisture 5,48a±0,22 5,76a±0,11
Ash 13,19a±1,25 11,90a±0,84
Lipids 4,01b±0,05 5,82a±0,10 Fiber 5,16a±0,28 4,46b±0,04 Phosphorus 1,31a±0,10 1,43a±0,13 Calcium 3,70a±0,30 2,97b±0,25 Amino acids (mg/100g) Soyameal A (FSA) EQ (chemical score) of soya meal A Soyameal B (FSB) EQ (chemical score) of soya meal B Isoleucine 3,72a±0,11 68 2,30b±0,23 42 Leucine 4,84a±0,13 53 3,36b±0,11 37 Arginine 0,33a±0,02 5 0,18b±0,01 3 Valine 3,24a±0,24 48 2,41b±0,22 36 Methionine 0,80a±0,06 24 0,39b±0,01 11 Lysine 7,45a±0,14 108 4,48b±0,17 65 Phenylalanine 3,60a±0,15 62 2,18b±0,21 38 Histidine 1,73a±0,15 67 1,19b±0,07 46 Threonine 6,24a±0,11 120 4,78b±0,15 92 AsparticAcid 1,94b±0,14 3,16a±0,14 GlutamicAcid 4,01b±0,09 4,39a±0,04 Proline 0,26a±0,02 0,10b±0,00 Serine 0,36b±0,03 0,43a±0,01 Glycine 3,63a±0,23 1,77b±0,11 Tyrosine 1,40a±0,07 0,83b±0,02 Alanine 0,58a±0,02 0,16b±0,00 IAAE 46,97 29,72
Different letters in the same row indicate significant differences by Tukey test (α = 95%). IAAE-essential amino acid index, EQ-chemical score.
Fernandes, Carneiro and Sakomura (2000) found results for soya meal of 47.3% protein, 2.4% lipid, 6.3% ash and 12.8% moisture. The differences between the values obtained for the moisture of soya meal samples in this study (FSA and FSB) and those found by Fernandes, Ram and
Sakomura (2000) are due to the fact that soya meal evaluated in this study were extruded . That did not occur in samples of comparative research. Other authors also observed a difference in moisture content in extruded flours (GERBER; JUNIOR; RIBEIRO, 2006; FARIA et al., 2001).
In soybean meals (FSA and FSB) were observed ash values of 13.19 and 11.90%, respectively. Zambom et al. (2001); Mendes et al. (2004); Fernandes et al. (2000) found lower values for ashes in research with soya meal.
The amounts of minerals in this research are about four times higher than those found in other studies (GERBER; JUNIOR; RIBEIRO, 2006; ZAMBOM et al., 2001; MENDES et al., 2004; FARIA et al., 2001; FERNANDES, RAM; SAKOMURA, 2000). It’s important to remember the fact that soy meals of this study have been extruded, so mineral levels are considerably higher. The soya meals (FSA and FSB) evaluated showed protein contents of 46.67 and 48.99%, respectively, these values characterize them as protein foods, but these levels are lower than those observed in soya meal evaluated by Zambom, et al. (2001) who observed the value of 51.41% protein.
Mendes et al. (2004) evaluating soy flour observed average grades of 43.09% protein, a value lower than those found in this study.
The protein levels of the samples regarding soya meal are according to the stipulated minimum, which while performing the mixture for making the feed supply there must be a content of about 40%. Studies conducted for the manufacturing of soya meal observed that levels vary from 40 to 60% (MENDES et al., 2004; ZAMBOM et al., 2001).
The lipid content of soya meals (FSA and FSB) evaluated in this experiment were 4.01 and 5.82%, respectively, values higher than those were observed by Fernandes et al. (2000); Mendes et al. (2004); Gerber et al. (2006) in soya meals. In most commercial soya meal described by other authors, the fat percentage is between 1.5 and 2.5%.
In this study we observed fibers values of 5.16 and 4.46% in soya meals (FSA and FSB), respectively. These values are similar to those observed in some studies (GERBER; JUNIOR; Ribeiro, 2006), and in some cases slightly higher (FARIA et al. 2001; ZAMBOM et al. 2001; MENDES et al. 2004).
The amino acid composition of proteins from soya meals (FSA and FSB), the Chemical Score (EQ ) and the Index of Essential Amino Acids (IAAE), for evaluating the quality of protein, are shown in Table 2. The soya meal used to the formulation of the feed A (FSA) showed levels higher than the total amino acidic presented by Cruz-Suarez et al. 2009. However, the soya meal used to the formulation of the feed B (FSB) showed lower values obtained by the same author.
The soya meals evaluated (FSA and FSB) showed arginine as a limiting amino acid and methionine as the second limiting amino acid. Regarding essential AA, we can see that the arginine content was quite low compared with the statement of technical and biological chemistry of Brazilian foods used in feed for pigs and poultry. For all other essential amino acids presents in soya meal (FSA) the values were higher while for soya meal (FSB) most values was lower when compared to the same study. This behavior is similar to that found in other studies (Cruz-Suarez, et al. 2009).
Opposed to that expected, it appears from Table 2 that the soya meal A showed better results than soya meal B with these methods (EQ and IAAE) used to evaluate the quality of the protein. The protein of soya flour A and B showed as first essential amino acids arginine (EQ
= 5:03) and the second methionine (EQ = 24 and 11). All values of EQ of soya meal A were superior to soya meal B, demonstrating what was said previously about the enormous variability in the nutritional composition of soya meal (Tacon, 1993). The IAAE was low for soya meal A as for the soya meal B (46.97 and 29.72), showing the variation of disability and quality of soybean meal as the present evaluation methods, besides it do not satisfy the international quality standard (FAO / WHO, 1985).
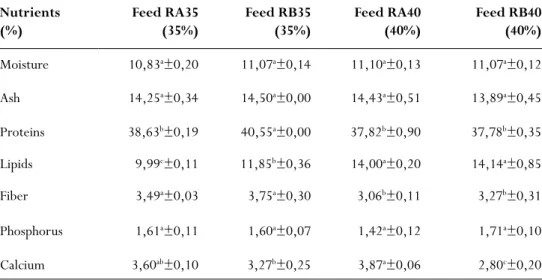
The chemical composition of commercial feed with different protein levels can be observed in table 3.
The concentration of ash in the four feed evaluated had elevated values, becoming this a limiting factor to the use of these products in feed for shrimp (Millamena, 2002; BOSCOLO et al. 2004) resulting in high levels of P, which is the main environmental eutrophication agent (Hardy, 1996; Sugiura et al. 2000).
Table 3 - Percent composition of commercial feeds analyzed. Nutrients
(%) Feed RA35(35%) Feed RB35(35%) Feed RA40(40%) Feed RB40(40%)
Moisture 10,83a±0,20 11,07a±0,14 11,10a±0,13 11,07a±0,12 Ash 14,25a±0,34 14,50a±0,00 14,43a±0,51 13,89a±0,45 Proteins 38,63b±0,19 40,55a±0,00 37,82b±0,90 37,78b±0,35 Lipids 9,99c±0,11 11,85b±0,36 14,00a±0,20 14,14a±0,85 Fiber 3,49a±0,03 3,75a±0,30 3,06b±0,11 3,27b±0,31 Phosphorus 1,61a±0,11 1,60a±0,07 1,42a±0,12 1,71a±0,10 Calcium 3,60ab±0,10 3,27b±0,25 3,87a±0,06 2,80c±0,20
Different letters in the same row indicate significant differences by Tukey test (α = 95%).
The feeds with 35% protein (RA35 and RB35) showed values higher than those found as a parameter set by the manufacturer (35%). The opposite happens with feeds with 40% protein (RB40 and RA40) that had values lower than those set by the manufacturers. Other studies showed no significant variation between the values used as parameters and actual values, in the case of crude protein (NGUYEN, et al., 2012; SUAREZ CRUZ et al., 2009; CORDOBA-MURUETA; GARCIA-CARRENÕ, 2002).
The lipid content of the diets evaluated in this experiment was high when compared to other studies, however are within the quality parameters used by manufacturers of feed for shrimp (NGUYEN, et al., 2012; SUAREZ CRUZ et al., 2009; CORDOBA-MURUETA; GARCIA-CARRENÕ, 2002).
The amino acid composition of proteins in diets with 35 and 40% protein (RA35, RB35, RB40 and RA40), the Chemical Score (EQ ) and the Index of Essential Amino Acids (IAAE), for evaluating the quality of protein, are shown in tables 4 and 5.
Table 4 - Amino acid profile of the commercial feed with 35% protein.
Amino acids (mg/100g) Feed RA35(35%) EQ (chemical score) of feed RA35 Feed RB35(35%) EQ (chemical score) of feed RB35 Isoleucine 1,34a±0,13 24 1,32a±0,13 24 Leucine 4,22a±0,33 46 3,12b±0,08 34 Arginine 4,75a±0,15 73 4,77a±0,11 73 Valine 2,56a±0,14 38 2,51a±0,02 37 Methionine 0,94b±0,03 28 1,05a±0,06 31 Lysine 7,28b±0,08 106 7,53a±0,09 109 Phenylalanine 2,62a±0,06 45 2,55a±0,06 44 Histidine 1,74a±0,04 67 1,60b±0,09 62 Threonine 2,28a±0,15 44 2,26a±0,19 44 AsparticAcid 3,89b±0,32 4,64a±0,05 GlutamicAcid 7,50a±0,43 7,50a±0,25 Proline 0,11a±0,00 0,10a±0,00 Serine 2,68a±0,18 2,55a±0,08 Glycine 3,18a±0,07 3,13a±0,09 Tyrosine 0,66b±0,01 0,74a±0,03 Alanine 0,16a±0,01 0,10b±0,01 IAAE 47,45 45,86
Different letters in the same row indicate significant differences by Tukey test (α = 95%). IAAE-essential amino acid index, EQ-chemical score.
Table 5 - Amino acid profile of the commercial feed with 40% protein. Amino acids (mg/100g) Feed RA40 (40%) EQ(chemical score) of feed RA40 Feed RB40(40%) EQ (chemical score) of feed RB40 Isoleucine 2,51a±0,19 46 2,29a±0,08 42 Leucine 3,58b±0,34 39 4,43a±0,23 49 Arginine 4,83b±0,08 74 5,63a±0,34 87 Valine 2,49b±0,10 37 2,81a±0,08 42 Methionine 0,80b±0,07 24 0,97a±0,06 29 Lysine 6,43b±0,40 93 9,42a±0,29 137 Phenylalanine 2,34b±0,19 40 3,55a±0,17 61 Histidine 1,49b±0,00 57 2,31a±0,17 89 Threonine 2,13b±0,12 41 2,66a±0,04 51 AsparticAcid 2,99b±0,14 5,13a±0,05 GlutamicAcid 7,20b±0,02 9,75a±0,02 Proline 0,12b±0,01 0,18a±0,01 Serine 2,52b±0,14 3,34a±0,31 Glycine 3,05b±0,25 4,74a±0,23 Tyrosine 0,66b±0,04 1,02a±0,03 Alanine 0,20a±0,01 0,20a±0,02 IAAE 46,57 58,46
Different letters in the same row indicate significant differences by Tukey test (α = 95%). IAAE-essential amino acid index, EQ-chemical score.
All diets analyzed had levels below those totals amino acidic presented by Cruz-Suarez et al. 2009. Even in studies with lower levels of total amino acids, only feed RB40 showed higher values. Feed containing protein content of 35% of both manufacturers showed isoleucine as the limiting amino acid and methionine as a second limiting amino acid.
By analyzing the EQ it was possible to determine the order of limiting amino acids in both commercial flours evaluated. This calculation was based on comparison with the amino acid profile of the protein of the egg, as recommended by Halver, 1988) and Hepher, 1988, given the high protein requirement for shrimp.
Comparing the results of amino acid profile of the feed used in the analyzes with those determined by chemical score, it was noted that diets A and B were not satisfactory in the content of essential amino acids, with the exception of lysine which showed higher EQ the standard.
The IAAE was satisfactory for all feeds, showing the variation in the quality of feeds as those present in evaluation methods. Thus, it’s necessary to establish an international standard of quality for products used in shrimp feed (FAO / WHO, 1985).
c
onclusionsThe fish meal and soya meal used in the formulation of commercial feed (RA) had amino acid profile superior to those found in meals used for obtaining commercial feed (RB).
By chemical score, it was concluded that the commercial feeds RA and RB were not satisfactory in the content of essential amino acids, except lysine.
r
eferencesAkiyama D and Polanco B. Semi - intensive shrimp farm management. En B. Polanco (Ed.). Technical manual. American Soybean Association, 1995. 30 p.
Anderson JS, Higgs DA, Beames RM and Rowshandeli M. Fishmeal quality assessment for Atlan-tic salmon (Salmosalar L.) reared in sea water. AquacultureNutrition, n. 3, p. 25–38, 1997. Blas C, Mateos GG and Rebolar PG. Tablas de composición y valor nutritivo de ali-mentos para la fabricación de piensoscompuestos. 2.ed. Madri: FundaciónEspañola para elDesarrollo de laNutrición Animal – FEDNA,2003. 253p.
Boscolo WR, Hayashi C, Feiden A, Neurer F and Signor AA. Composição química e digestibili-dade aparente da energia e nutrientes da farinha de resíduos da indústria de filetagem de tilápias, para a tilápia do Nilo (Oreochromisniloticus). Ciência Rural, Santa Maria, v.38, n.9, p.2579 – 2586, dez. 2008.
Boscolo WR. Hayashi C, Meurer F, Feiden A and Bombardelli RA. Digestibilidade aparente da energia e proteína das farinhas de resíduo da filetagem da tilápia do Nilo (Oreochromisniloticus), da corvina (Plagioscionsquamosissimus) e farinha integral do camarão canela(Macrobrachiu-mamazonicum) para a tilápia do Nilo. Revista Brasileira de Zootecnia, Viçosa, v.33, n.1, p.8-13, jan./fev.2004.
Córdova-Murueta JH and García-Carreño FL. Nutritive value of squid and hydrolyzed protein supplement in shrimp feed.Aquaculture, Amsterdam, n.210, p.371–384, 2002.
Cruz-Suárez LE, Tapia-Salazar M, Villarreal-Cavazos D, Beltran-Rocha J, Nieto-López MG, Lemme, A and Ricque-Marie D. Apparent dry matter, energy, protein and amino acid digestibil-ity of four soybean ingredients in white shrimp Litopenaeusvannamei juveniles. Aquaculture, Amsterdam n.292, p.87–94, 2009.
expert consultation technical report.Geneva: FAO/WHO andthe United NationsUniversity (se-ries, 724), 1985.
Faria ACEA, Hayashi C, Galdioli EM and Soares CM. Farinha de peixe em rações para alevinos de tilápia do Nilo, Oreochromisniloticus(L.), linhagem tailandesa. Acta Scientiarum, Maringá, v. 23, n. 4, p. 903-908, 2001.
Fernandes JBK, Carneiro DJ and Sakomura NK. Fontes e Níveis de Proteína Bruta em Dietas para Alevinos de Pacu (Piaractusmesopotamicus). RevistaBrasileiraZootecnia, Viçosa,n.29, v.3, p.646-653, 2000
Gerber LFP, Júnior AMP and Ribeiro AML. Efeito da composição do farelo de soja sobre o de-sempenho e o metabolismo de frangos de corte. Revista Brasileira Zootecnia, Viçosa, v.35, n.4, p.1359-1365, 2006.
Guillaume J. Protein and amino acids.In: Crustacean Nutrition. D’Abramo LR, Conklin DE and Akiyama DM. _Eds.., Advances in World Aquaculture vol. 6 World Aquaculture Society, Baton Rouge, LA, p. 26–50, 1997.
Hardy RW. Alternate protein sources for salmon and trout diets. Animal Feed Science
Tech-nology, Amsterdam, v.59, p.71-80, 1996.
Hepher B. Requeriment for protein. In: Nutrition of pond fishes. Cambrige: University Press, p. 175 – 216, 1988.
Hildebrand M. Análise da estrutura dos vertebrados. São Paulo: Atheneu, 1995. 700p. Lee SM. Apparent digestibility coefficients of various feed ingredients for juvenile and grower rockfish (Sebastesschlegeli). Aquaculture, Amsterdam, v.207, p.79 – 95, 2002.
Maina JG. Digestibility and feeding value of some feed ingredients fed to tilapia Oreochromisni-loticus(L.). Aquaculture Research, Oxford, v.33, p.853-862, 2002.
McCoid V, Miget R and Finne G. Effect of environmental salinity on the free amino acid compo-sition and concentration in penaeid shrimp.Journal of Food Science, Chicago, n.49, p.327– 330, 1984.
Mendes WS, Silva IJ, Fonte DO, Rodrigue NM, Marinho PC, Silva FO, Arouca CLC and Silva FCO. Composição química e valor nutritivo da soja crua e submetida a diferentes processamentos térmicos para suínos em crescimento.Arquivo Brasileiro de Medicina Veterinária e Zoo-tecnia, Belo Horizonte,v.56, n.2, p.207-213, 2004.
Millamena OM. Replacement of fish meal by animal byproduct meals in a practical diet for grow-out culture of grouper Epinepheluscoiodes. Aquaculture, Amsterdam, v.204, p.75-84, 2002. NATIONAL RESEARCH COUNCIL - NRC.Nutrient requirements of swine. 3.ed. Wash-ington, D.C.: National Academy ofSciences, 1998. 189p.
NATIONAL RESEARCH COUNCIL - NRC.Requirements of warm water fishes and shelfishes. Washington, D.C.: National Academy Press, 1983.
the survival and growth of shrimp Penaeusvannamei.Aquaculture, Amsterdam, v. 324-325, p. 127-134, 2012.
Olvera-Novoa MA. Cowpea (Vignaunguiculata) protein concentrate as replacement for fish meal in diets for tilapia (Oreochromisniloticus) fry. Aquaculture, Amsterdam, v.158, p.107-116, 1997. Rostagno HS. Tabelas brasileiras para aves e suínos. Viçosa: ed.UFV, 2000. 141p.
Sales J and Britz PJ. Apparent and true availability of amino acids from common feed ingredients for South African abalone (HaliotismidaeL.). Aquaculture Nutrition, v.9, p.55-64, 2003. Sugiura SH. Utilization of fish and animal by-product meals in low-pollution feeds for rainbow trout Oncorhynchusmykiss(Walbaum).Aquaculture Research, Oxford, v.31, p.585-593, 2000. Tacon AGJ. Feed Ingredients for warm water fish: meal and other processed feed-stuffs. Rome: FAO, 1993. 64p.
Tacon AGJ. The nutrition and feeding of farmed fish and shrimp – A training manual. The essentialnutrients. Brasilia:FAO, 1990. 117p.
Zambom MA, Santos GT, Modesto, EC, Alcalde CR, Gonçalves GD, Silva DC, Silva KT and Faus-tino JO. Valor nutricional da casca do grão de soja, farelo de soja, milho moído e farelo de trigo para bovinos. ActaScientiarum, Maringá, v. 23, n. 4, p. 937-943, 2001
White JA, Hart R and Fry JC. An evaluation of the Waters Pico-Tag system for the amino-acid analysis of food materials.Journal of Automatic Chemistry of Clinical Laboratory Auto-mation, v. 8, n.4, p. 170-177, 1986.