The wetted area uniformity of the rainfall generated by different sprinkler
nozzles
Identificação da uniformidade de chuva simulada por diferentes sistemas
aspersores
DOI:10.34117/bjdv6n6-636
Recebimento dos originais: 29/05/2020 Aceitação para publicação: 29/06/2020
César Gabriel dos Santos
Doutor em Engenharia Agrícola pela Universidade Federal de Santa Maria Instituição: Universidade Federal de Santa Maria – UFSM
Endereço: Centro Tecnológico, Departamento de Engenharia Mecânica. Av. Roraíma, nº 1000, Prédio 07, Sala 312, CEP 97105-900 - Camobi, Santa Maria – SM, Brasil
E-mail: [email protected]
Leonardo Nabaes Romano
Doutor em Engenharia Mecânica pela Universidade Federal de Santa Catarina Instituição: Universidade Federal de Santa Maria – UFSM
Endereço: Centro Tecnológico, Departamento de Engenharia Mecânica. Av. Roraíma, nº 1000, Prédio 07, Sala 312, CEP 97105-900 - Camobi, Santa Maria – SM, Brasil
E-mail: [email protected]
Antonio Carlos Valdiero
Doutor em Engenharia Mecânica pela Universidade Federal de Santa Catarina Instituição: Universidade Federal de Santa Catarina – UFSC
Endereço: Centro Tecnológico, Departamento de Engenharia Mecânica. Campus Universitario-EMC-CTC. Bairro Trindade, Caixa-postal: 476.
CEP 88040-900 - Florianópolis, SC – Brasil. Telefone: (48) 3721-4019 E-mail: [email protected]
Bruna Karine dos Santos
Doutoranda no Programa de Pós-Graduação em Engenharia Agrícola na Universidade Federal de Santa Maria
Instituição: Universidade Federal de Santa Maria – UFSM
Endereço: Programa de Pós-graduação em Engenharia Agrícola (PPGEA), Centro de Ciências Rurais (CCR), Universidade Federal de Santa Maria (UFSM), Santa Maria, RS, Brasil.
E-mail: [email protected]
Gilmar Fernando Vogel
Doutor em Engenharia Agrícola pela Universidade Federal de Santa Maria Instituição: Universidade Federal de Santa Maria – UFSM
Endereço: Colégio Técnico Industrial de Santa Maria (CTISM), Santa Maria, Av. Roraima, 1000, CEP 97105-900, Santa Maria, RS, Brasil.
ABSTRACT
Since the 1930s several conceptions of rainfall simulators were developed to perform runoff experiments, soil water infiltration, water erosion, persistence of phytosanitary products, etc. The uniformity of the rainfall generated is a parameter used to validate a rainfall simulator conception design. On this subject, this work aimed at identifying the wetted area uniformity of the rainfall generated by different sprinkler nozzles. The study was divided in two stages: experimental data collection; and, calculation of wetted area uniformity. In the first stage it was used an experimental bench to generate rainfall. The experiment was carried out under completely randomized, factorial 3 x 3 x 3 experimental design, with 27 treatments and six replications (162 experimental units). The treatments were a combination of three sprinkler nozzles (P1, P2 and P3), three sprinkler heights from the ground (1.1 m, 2.1 m and 3.1 m), and three water pressures (50 kPa, 100 kPa and 150 kPa). A mesh of 289 plastic collectors was used for stored the water volume of the rainfall generated from the experimental units. In the second stage, it was calculated the water distribution uniformity using the Christiansen Uniformity Coefficient (CUC) for the areas of 2.56 m², 1.44 m², 0.64 m² and 0.16 m². As a result, the higher the water pressure and sprinkler nozzle height and smaller the land plot, the greater the tendency to get CUC values classified as good or excellent. The sprinkler nozzle P1 showed the best results, so the conclusion is the wetted area uniformity is an important parameter to consider in the selection of sprinkler nozzles in the rainfall simulators design.
Keywords: sprinkler nozzles; water distribution uniformity; nozzle selection.
RESUMO
Desde a década de 1930 foram desenvolvidas diversas concepções de simuladores de chuva para realizar ensaios de escoamento superficial, infiltração de água no solo, erosão hídrica, persistência de produtos fitossanitários, etc. A uniformidade da chuva simulada gerada é um parâmetro utilizado para validar uma concepção de simulador de chuva. Sobre este tema, este trabalho teve por objetivo identificar a uniformidade da chuva simulada por diferentes bicos aspersores. O estudo foi dividido em duas etapas: uma para coleta de dados de desempenho dos bicos e outra para teste da uniformidade da área molhada. Na primeira etapa utilizou-se uma bancada experimental para gerar a chuva. O experimento foi conduzido sob delineamento inteiramente casualizado com esquema fatorial 3 x 3 x 3, com 27 tratamentos em seis repetições (162 unidades experimentais). Os tratamentos foram uma combinação de três tipos de bicos aspersores (P1, P2 e P3), três alturas de instalação dos aspersores (1,1 m, 2,1 m e 3,1m) e três pressões de serviço (50 kPa, 100 kPa e 150 kPa). Uma malha de 289 coletores plásticos foi utilizada para armazenar o volume de água das chuvas simuladas geradas das 162 unidades experimentais. Na segunda etapa, foi calculada a uniformidade da área molhada utilizando o Coeficiente de Uniformidade de Christiansen (CUC) para as áreas de 2,56 m², 1,44 m², 0,64 m² e 0,16 m². Como resultado, verificou-se que quanto maior a pressão da água e a altura do aspersor, e menor a área da parcela, maior foi a tendência de obter índices de uniformidade da área molhada classificados como bom ou excelente. Neste trabalho o bico aspersor P1 apresentou os melhores resultados, portanto, concluiu-se que a uniformidade da área molhada é um importante parâmetro a ser considerado na seleção de bicos aspersores no projeto de simuladores de chuva.
Palavras-chave: bicos de aspersor; uniformidade de distribuição de água; seleção de bicos.
1 INTRODUCTION
Rainfall is a climatic parameter that play an important role in the occurrence of soil erosion (OLIVEIRA et al., 2009; CARVALHO et al., 2012). It is the result of water condensation in the atmosphere, that precipitates in drops towards the ground when they overcome vertical air streams (INMET, 2018). Hence, it is important to get specialized information about rainfall effects
(DURÃES; COELHO FILHO; OLIVEIRA, 2016). However, due to limitations, or scarce information collected from natural rainfall, technical systems called Rain Simulators have been used to reproduce rainfall in a controlled way (MONTEBELLER et al., 2001).
In the rain simulators design, the automation of the simulated rainfall generation process through electronic systems allows controlling the pressure, flow, temperature, time and intensity of precipitation, generating rainfall with the same characteristics for several times (SANTOS et al., 2016). An important parameter to be considered in the Rain Simulators design is the selection of sprinklers based on their water distribution uniformity, that affects the simulated rainfall generated (SANTOS, 2017).
The concepts of water distribution uniformity applied to irrigation systems has an increasing importance along the last years, due to the need for conserving water resources, and to the high energy costs. So, it is important to guarantee the correct choice and the suitable use of the droplet forming mechanism, and also, an adequate water management (SANDRI and CORTEZ, 2009). In irrigation, uniformity is related to the capacity of the equipment to provide a uniform water distribution throughout the irrigated area (JÚNIOR SILVA et al., 2017). Thus, the uniformity of simulated rainfall reflects the ability of a Rain Simulator to provide the same water intake rate, in form of raindrops, over an experimental area.
Uniformity can be estimated with several coefficients (SANTOS, 2017). Among them, the Christiansen Uniformity Coefficient (Christiansen, 1942), known as CUC. It is an important parameter to determine the uniformity of a wetted area. In the literature, CUC was used by many authors to estimate the uniformity coefficient of the wet surface in their respective experiments (Lopes et al., 2011); Borssoi et al., 2012; Faria et al., 2012; Faria et al., 2013; Frigo et al., 2013; The Baldi et al., 2013; Zocoler et al., 2013; Bastos et al., 2014; Melo Filho, 2015; Martins et al., 2015; Palaretti et al., 2016; Prado, 2016; Silva et al., 2016; Tamagi et al., 2016; Andrade et al., 2017; Santos et al., 2017; Silva et al., 2017; and Ventura et al., 2017). In the development of Rain Simulators, CUC was used to estimate the uniformity of the simulated rain generated by the respective models of sprinklers used (Pall et al., 1983; Alves Sobrinho; Ferreira; Pruski, 2002; Souza Júnior and Siqueira, 2011; Souza Júnior; Mendes; Siqueira, 2017).
In this context, this work aimed to identify the water distribution uniformity of a rainfall simulator, under different sprinkler heights and operating pressures for three commercial nozzles, in order to select the best combination of these factors for the use in rainfall simulation.
2 MATERIAL AND METHODS
The experiment was carried out in a laboratory, in an environment prepared for the simulating rainfall, in order to produce a uniform, flat surface, with no influence of external weather conditions (wind, natural rainfall, and sun).
The experiment was developed under a completely randomized experimental design, using a factorial scheme 3 x 3 x 3, with six replications (27 treatments, 162 experimental units). Factor "A" was composed of three sprinkler nozzles; the "G" factor was three sprinkler heights above the ground (1.1 m, 2.1 m and 3.1 m); and the "D" factor was three operating pressures (50, 100 and 150 kPa).
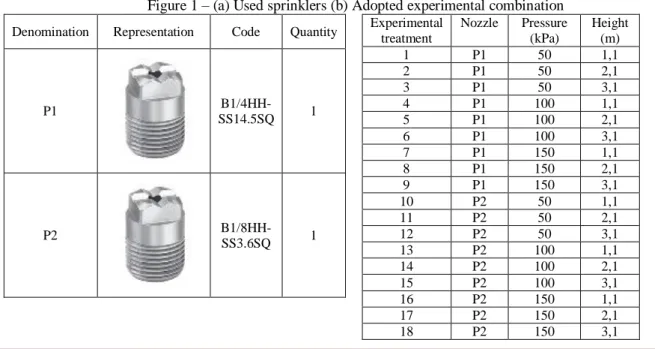
Figure 1a illustrates the sprinkler nozzle models used, with their respective commercial codes and the denomination adopted in this work (P1, P2 and P3). P1 and P2 sprinkler nozzle have the same geometric design, however, with nozzle diameters of 3.9 mm and 1.6 mm, respectively. The conception of P1 and P2 distinguishes from the conception of P3, which has a nozzle diameter of 0.68 mm.
Figure 1b shows the 27 experimental treatments. The sprinkler height (in meters) corresponding to the distance from the sprinkler to the soil surface. The operating pressure (in kPa) corresponds to the measured water pressure at 50 mm from the sprinkler by a code sensor MPX4250GP (range between 0 and 250 kPa). The pressure was regulated by opening and closing a globe valve.
For each of the 162 experimental units, simulated rainfall was generated with a duration of 7 minutes. The volume of water stored in the collectors (in milliliters) was measured with a volumetric graduated beaker (capacity for 300 ml). The respective values were recorded in a spreadsheet and converted to water discharge (L h-1).
Figure 1 – (a) Used sprinklers (b) Adopted experimental combination
Denomination Representation Code Quantity
P1 B1/4HH-SS14.5SQ 1 P2 B1/8HH-SS3.6SQ 1 Experimental treatment Nozzle Pressure (kPa) Height (m) 1 P1 50 1,1 2 P1 50 2,1 3 P1 50 3,1 4 P1 100 1,1 5 P1 100 2,1 6 P1 100 3,1 7 P1 150 1,1 8 P1 150 2,1 9 P1 150 3,1 10 P2 50 1,1 11 P2 50 2,1 12 P2 50 3,1 13 P2 100 1,1 14 P2 100 2,1 15 P2 100 3,1 16 P2 150 1,1 17 P2 150 2,1 18 P2 150 3,1
P3 B1/4T- SS+TG-SS6 1 19 P3 50 1,1 20 P3 50 2,1 21 P3 50 3,1 22 P3 100 1,1 23 P3 100 2,1 24 P3 100 3,1 25 P3 150 1,1 26 P3 150 2,1 27 P3 150 3,1 (a) (b)
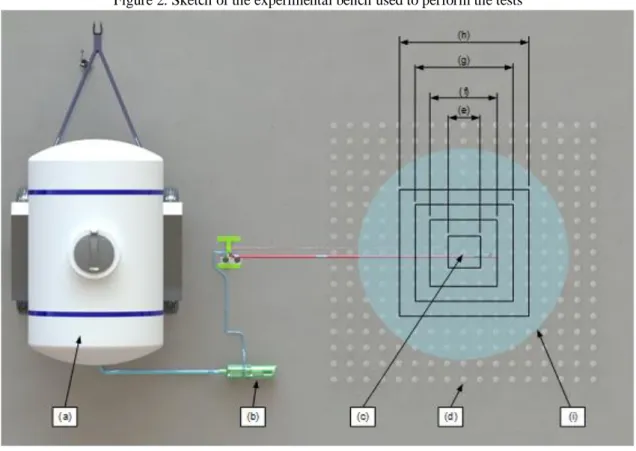
Figure 2 shows the used experimental scheme, as it follows: (a) reservoir with volume of 2000 L; (b) 2.2 kW hydraulic pump powered by a 220 Vca power source and a volumetric flow rate of 5.5 m3 h-1; (c) sprinkler mounting position; (d) plastic collectors (289 units) with capacity to store 0,2 L; (e) area A1 - 0.16 m²; (f) area A2 - 0.64 m²; (g) area A3 - 1.44 m²; (h) area A4 - 2.56 m²; (i) maximum wetted area and the "x" and "y" dimensions corresponding to the distance between the collectors (d), which were equally spaced 0.2 m apart. The volume of water stored by the collectors beyond the maximum area of analysis (h) was discarded.
Figure 2. Sketch of the experimental bench used to perform the tests
We organized the measurements come from the 162 experimental units, to calculate the water distribution uniformity of the areas A1, A2, A3 and A4, applying the equation of Christiansen Uniformity Coefficient (equation 1).
CUC = 100 . [1 − ∑ |Xi− X̅| n
i−1
n . X̅ ] (1)
At where:
CUC = Christiansen’s Coefficient of Uniformity (%); n = Number of analyzed drippers;
Xi = Flow collected in each dripper (L h-1); X
̅= Mean of the flows collected in all drippers (L h-1).
The data were submitted to analysis of the assumptions of normality of residues and homogeneity of variance, by the Shapiro-Wilk and Bartlett tests, respectively. Subsequently, the analysis of variance was performed, followed by the Tukey test, for means comparison. The analyses were performed in STATISTICA software.
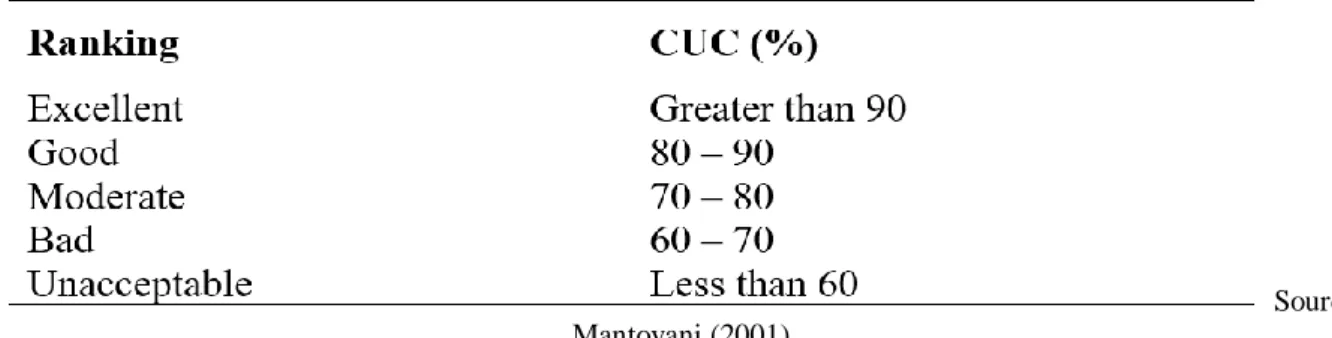
In addition, the mean value of the six replicates was calculated. Thus, the areas A1, A2, A3 and A4 were classified for the 27 experimental combinations, according to the indexes proposed by Mantovani (2001), as presented in Table 1.
Table 1. Uniformity index used to classify the simulated rainfall generated
Source: Mantovani (2001)
3 RESULTS AND DISCUSSIONS
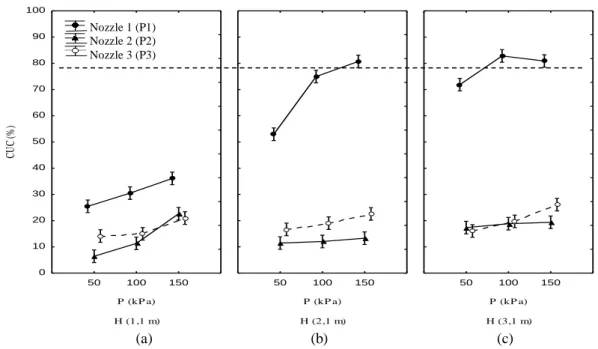
Based on the data analysis, we verified a triple interaction between the study factors (p <0.05), for all the areas used in this study. Considering the area A4, the best results were obtained using the P1 nozzle sprinkler at working heights of 2.1 m and 3.1 m. For the height of 1.1 m, all the nozzle evaluated had CUC less than 40% (Figure 3a).
Figure 3 – CUC values for area A4 (2.56 m²), at heights of 1.1 m (a); 2.1 m (b) and 3.1 m (c)
(a) (b) (c)
Note: The dashed line present in 80% corresponds to the minimum good / excellent classification according to Table 1.
In the A3 area (1.44 m²) and using the height of 1.1 m, only the highest pressure (150 kPa) combined with the use of P1 nozzle sprinkler gave satisfactory results, classified as moderate in the scale proposed by Mantovani (2001). However, when the working heights were increased, and for the same pressures, this resulted in better distribution uniformity of the wetted area. In such a way that the P1 in the pressure 50 kPa, in the height 1,1m presented CUC equal to 30%; in the height 2,1m, it raised to 70%, and at the height of 3,1m the CUC was higher than 80%. This characteristic is observed also at P2 and P3 at pressures (Figure 4).
Figure 4 – CUC values for area A3(1.44 m²), at heights of 1.1 m (a); 2.1 m (b) and 3.1 m (c)
(a) (b) (c)
Note: The dashed line present in 80% corresponds to the minimum good / excellent classification according to Table 1. H (1,1 m) 50 100 150 P (kP a) 0 10 20 30 40 50 60 70 80 90 100 CU C (% ) H (2,1 m) 50 100 150 P (kP a) H (3,1 m) 50 100 150 P (kP a) Ponta (P1) Ponta (P2) Ponta (P3) H (1,1 m) 50 100 150 P (kP a) 0 10 20 30 40 50 60 70 80 90 100 CU C (% ) H (2,1 m) 50 100 150 P (kP a) H (3,1 m) 50 100 150 P (kP a) Ponta (P1) Ponta (P2) Ponta (P3) Nozzle 1 (P1) Nozzle 2 (P2) Nozzle 3 (P3) Nozzle 1 (P1) Nozzle 2 (P2) Nozzle 3 (P3)
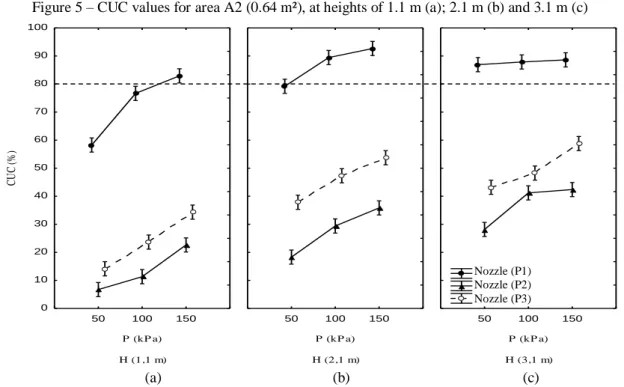
For the area A2 (0.64 m²), similar behavior was obtained for area A3 (1.44 m²), at the working height of 2.1 m and using the pressures of 100 and 150 kPa, a good classification index was obtained. In addition, with nozzle P1 at the highest height (3.1 m), all the operation pressures gave good results (Figure 5c). For nozzles P2 and P3, all combinations resulted in low, bad CUC values.
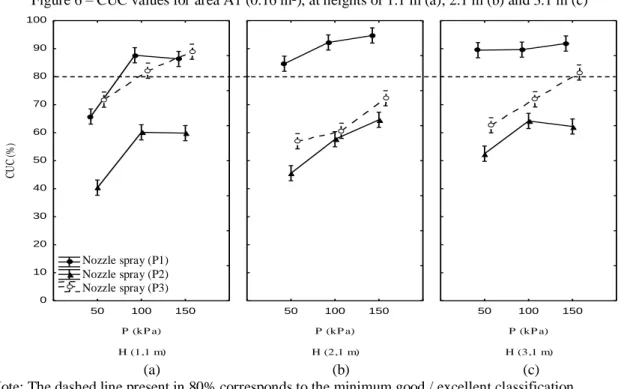
In the analysis of area, A1 gave the best results of CUC, according to Mantovani (2001), where all combinations used the nozzle sprinkler P1. In addition, when the nozzle sprinkler P2 was used at the lowest working height (1.1 m), we obtained CUC values classified between “reasonable” and “good”. No one combination for P3 nozzle sprinkler gave satisfactory results (Figure 6).
Figure 5 – CUC values for area A2 (0.64 m²), at heights of 1.1 m (a); 2.1 m (b) and 3.1 m (c)
(a) (b) (c)
Note: The dashed line present in 80% corresponds to the minimum good / excellent classification according to Table 1. H (1,1 m) 50 100 150 P (kP a) 0 10 20 30 40 50 60 70 80 90 100 CU C (% ) H (2,1 m) 50 100 150 P (kP a) H (3,1 m) 50 100 150 P (kP a) Ponta (P1) Ponta (P2) Ponta (P3) Nozzle (P1) Nozzle (P2) Nozzle (P3)
Figure 6 – CUC values for area A1 (0.16 m²), at heights of 1.1 m (a); 2.1 m (b) and 3.1 m (c)
(a) (b) (c)
Note: The dashed line present in 80% corresponds to the minimum good / excellent classification according to Table 1.
The sprinkler nozzles models used in this work differ from the models used in the literature works. Thus, different simulated rainfall was generated, making impossible a direct comparison. Despite, it can be inferred on the indicatives obtained from the works of Alves Sobrinho et al. (2002) and Souza Júnior; Mendes; Siqueira (2017) and of this work as described below.
The conception of Rain Simulator developed by Alves Sobrinho et al. (2002) uses two VeeJet 80.100 nozzle sprinkler with a pressure of 32.7 kPa, and VeeJet 80.150 with a pressure of 35.6 kPa, positioned at 2.3 meters in height, mounted in parallel and spaced at 0.4 m. The simulated rainfall resulted in CUC values of 82 to 87%, for an experimental plot of 0.70 m². The values in the present work show that, in the area A2 (0.64 m²), and using only one nozzle sprinkler (P1), we observed 6 combinations that resulted in CUC values above 80%: pressure 150 kPa and height 1.1m (Figure 5a); pressure 100 kPa and height 2.1m (Figure 5b); pressure 150 kPa and height 2.1m (Figure 5b); pressure 50 kPa and height 3.1m (Figure 5c); pressure 100 kPa and height 3.1m (Figure 5c); and pressure 150 kPa and height 3.1m (Figure 5c).
On the other hand, the Rain Simulator developed by Souza Júnior; Mendes; Siqueira (2017), that used two Fulljet ½ SS HH 40 nozzle sprinkler spaced at 1.06 m, at a height of 3 m in relation to the experimental plot. The authors used pressures of 50, 80, 110, 140 and 170 kPa, in experimental plots of 3.0 m², 1.5 m² and 1.0 m². Thus, CUC values obtained for the 3.0 m² area were less than 75% for all the pressures used. In the area of 1.5 m², CUC values were under 80% for the pressures of 50, 80 and 110 kPa; and for the pressures of 140 and 170 kPa, CUC values were higher than 80%. In the
H (1,1 m) 50 100 150 P (kP a) 0 10 20 30 40 50 60 70 80 90 100 CU C (% ) H (2,1 m) 50 100 150 P (kP a) H (3,1 m) 50 100 150 P (kP a) Ponta (P1) Ponta (P2) Ponta (P3) Nozzle spray (P1) Nozzle spray (P2) Nozzle spray (P3)
area of 1.0 m², CUC values were under 75% for the pressure of 50 kPa, and above 80% for the other pressures (80, 110, 140 and 170 kPa).
Comparing these results with the values obtained in the present work, in the area A4 (2.56 m²) and using only one nozzle sprinkler (P1), there were 3 combinations of results with CUC values above 80%: pressure 150 kPa and height 2.1 m (Figure 3b); pressure 100 kPa and height 3.1 m (Figure 3c); and pressure 150 kPa and height 3.1 m (Figure 3c). In the area A3 (1.44 m²), and using only one nozzle sprinkler (P1), we found 5 combinations of results with CUC values above 80%: pressure 100 kPa at height of 2.1 m (Figure 4b); pressure 150 kPa at height 2.1 m (Figure 4b); pressure 50 kPa at height 3.1 m (Figure 4c); pressure 100 kPa and height 3.1 m (Figure 4c); and pressure 150 kPa at height 3.1 m (Figure 4c). In the area A2 (0.64 m²), we verified that using only one sprinkler nozzle sprinkler (P1), it was observed 7 combinations of results with CUC values above 80%: pressure 150 kPa at 1,1 m height (Figure 5a); pressures 50, 100 and 150 kPa at height 2.1 m (Figure 5b); and pressures 50, 100 and 150 kPa at height 3.1 m (Figure 5c).
4 CONCLUSIONS
The water distribution uniformity is an important parameter to be considered in the selection of nozzle sprinklers for Rainfall Simulators, since it corresponds to the number of drops that reach a certain plot. In this way, the uniformity index assists in the Rainfall Simulators design, serving as a parameter to determine the technical specification of wetted area of the Rain Simulator.
How high are water pressure and drop height, and how small is plot area, so higher the trend to get uniformity indexes of wetted area classified as good or excellent. In this work, the nozzle sprinkler P1 showed better results than P2 and P3.
ACKNOWLEDGMENT
The first author thanks the Coordination of Improvement of Higher Education Personnel (CAPES) for the doctorate scholarship. Also, to CNPq by the research productivity grant of the second author (CNPq fellow - Brazil, process number 312083 / 2015-7).
BIBLIOGRAPHIC REFERENCES
ALVES SOBRINHO, T.; FERREIRA, P. A.; PRUSKI, F. F. Desenvolvimento de um infiltrômetro de aspersão portátil. Revista Brasileira de Engenharia Agrícola e Ambiental. v. 6. n. 2. p. 337-344, 2002.
ANDRADE, M. G. de; BOAS, M. A. V.; SIQUEIRA, J. A. C.; SATO, M.; DIETER, J.; HERMES, E.; MERCANTE, E. Uniformity microsprinkler irrigation system using statistical quality control.
Ciência Rural, Santa Maria, v. 47, n. 4, 2017. DOI:
http://dx.doi.org/10.1590/0103-8478cr20160546.
BASTOS, A. V. S.; OLIVEIRA, R. C. de.; CUNHA, F. N.; SILVA, N. F. da.; BASTOS, F. J. de C.; TEIXEIRA, M. B. Uniformidade de distribuição de um sistema de irrigação por autopropelido.
IRRIGA, Botucatu, Edição Especial 01, p. 94-103, 2014. DOI:
http://dx.doi.org/10.15809/irriga.2014v1n1p94
BORSSOI, A. L.; BOAS, M. A. V.; REISDORFER, M.; HERNANDEZ, R. H.; FOLLADOR, F. A. C. Water application uniformity and fertigation in a dripping irrigation set. Engenharia Agrícola, Jaboticabal, v. 32, n. 4, p. 718-726, Ago. 2012. DOI:
http://dx.doi.org/10.1590/S0100-69162012000400011.
CARVALHO, D. F.; MONTEBELLER, C. A.; FRANCO, E. M.; CEDDIA, M. B.; LANA, A. M. Q. Perdas de solo e água em um Argissolo Vermelho Amarelo, submetido a diferentes intensidades de chuva simulada. Revista Brasileira de Engenharia Agrícola e Ambiental, v. 6, n. 3, p. 385-389, 2012.
CHRISTIANSEN, J. E. Irrigation by sprinkling. Berkeley: University of California, 1942. 124p. Bulletin 670.
DURÃES, M. F.; FILHO, J. A. P. C.; OLIVEIRA, V. A de. Water erosion vulnerability and sediment delivery rate in upper Iguaçu river basin – Paraná. RBRH, Porto Alegre, v. 21, n. 4, p. 728-741, Dez. 2016. DOI: http://dx.doi.org/10.1590/2318-0331.011616029.
FARIA, L. C.; BESKOW, S. COLOMBO, A.; OLIVEIRA, H. F. E. de. Modelagem dos efeitos do vento na uniformidade da irrigação por aspersão: aspersores de tamanho médio. Revista Brasileira
de Engenharia Agrícola e Ambiental, Campina Grande, v. 16, n. 2, p. 133-141, Fev. 2012. DOI:
http://dx.doi.org/10.1590/S1415-43662012000200002.
FARIA, L. C.; PRADO, G. COLOMBO, A. OLIVEIRA, H. F. E.; BESKOW, S. Simulação da distribuição de água em diferentes condições de vento e espaçamentos entre aspersores. Revista
Brasileira de Engenharia Agrícola e Ambiental, Campina Grande, v. 17, n. 9, p. 918-925, Set.
2013. DOI: http://dx.doi.org/10.1590/S1415-43662013000900002.
FRIGO, J. P.; BOAS, M. A. V.; FRIGO, E. P.; HERMES, E.; TESSARO, E. Irrigação diurna e noturna em um sistema de aspersão convencional em Palotina-PR. IRRIGA, Botucatu, v.18, n. 2, p. 318-327, abril-junho, 2013. DOI: http://dx.doi.org/10.15809/irriga.2013v18n2p318
INSTITUTO NACIONAL DE METEOROLOGIA – INMET. Glossário. 2018. Disponível em: <http://www.inmet.gov.br/portal/index.php?r=home/page&page=glossario> Acessado em: 05 de Abril de 2018.
JUNIOR SILVA, H. M. da; GOMES, A. W. A.; COSTA, C. T. S.; SAAD, J. C. C. Relação entre uniformidade da produtividade e indicadores de uniformidade da irrigação em sistema de irrigação por microaspersão em citros. IRRIGA, Botucatu, v.22, n. 3, p. 430-442, Julho-Setembro, 2017. DOI: http://dx.doi.org/10.15809/irriga.2017v22n3p430-442
LOPES, F. B.; SOUZA, F. de; ANDRADE, E. M. de; MEIRELESE, A. C. M.; CAITANO, R. F. Determinação do padrão do manejo da irrigação praticada no perímetro irrigado baixo Acaraú, Ceará, via análise multivariada. IRRIGA, Botucatu, v.16, n. 3, p. 301-316, julho-setembro, 2011. DOI: http://dx.doi.org/10.15809/irriga.2011v16n3p301
MANTOVANI, E. C. AVALIA: Programa de Avaliação da Irrigação por Aspersão e Localizada. Viçosa, MG: UFV, 2001.
MARTINS, P. E. S.; SILVA, E. R.; SANTANA, V. G.; ARAÚJO NETO, J. A.; ZANINI, J. R. Uniformidade de distribuição de água do microaspersor MC-20. Revista de Ciências Agrárias, Lisboa, v. 38, n. 1, p. 65-70, Mar. 2015.
MELO FILHO, M. S. de. Uniformidade da irrigação por aspersão na cultura da
cana-de-açúcar em dois estágios de desenvolvimento. 2015. 50 f. Dissertação (Mestrado em Engenharia
Agrícola) – Universidade Federal Rural de Pernambuco, Pernambuco, Recife.
MONTEBELLER, C. A.; CARVALHO, D. F.; SOBRINHO, T. A.; NUVES, A. C. S.; RUBIO, E. Avaliação hidráulica de um simulador de chuvas pendular. Revista Brasileira de Engenharia
Agrícola e Ambiental. Campina Grande, v. 5, n. 1, p. 1-5, Abr. 2001. DOI:
http://dx.doi.org/10.1590/S1415-43662001000100001.
OLIVEIRA, F. P. de; SILVA, M. L. N.; CURI, N.; SILVA, M. A. da.; MELLO, C. R. de. Potencial erosivo da chuva no vale do rio doce, região centro leste do estado de Minas Gerais: primeira aproximação. Ciência e Agrotecnologia, Lavras, v. 33, n. 6, p. 1569-1577, Dez. 2009. DOI: http://dx.doi.org/10.1590/S1413-70542009000600016.
PALARETTI, L. F.; ZANINI, J. R.; VECCHIATO, D. A.; DALRI, A. B.; FARIA, R. T. de. Análise dos coeficientes de uniformidade de aplicação de Microaspersores. IRRIGA, Botucatu, Edição Especial, Irrigação, p. 89-98, 2016. DOI: http://dx.doi.org/10.15809/irriga.2016v1n01p89-98
PALL, R.; DICKINSON, W. T.; REALS, D.; MCGIRR, R. Development and calibration of a rainfall simulator. Canadian Agricultural Engineering. vol. 25. n. 2. f. 181-187, 1983.
PRADO, G. do. Water distribution from medium-size sprinkler in solid set sprinkler systems. Revista Brasileira de Engenharia Agrícola e Ambiental. Campina Grande, v. 20, n. 3, p. 195-201, Mar. 2016. DOI: http://dx.doi.org/10.1590/1807-1929/agriambi.v20n3p195-201.
SANDRI, D.; CORTEZ, D. de A. Parâmetros de desempenho de dezesseis equipamentos de irrigação por pivô central. Ciência e Agrotecnologia, Lavras, v. 33, n. 1, p. 271-278, Fev. 2009. DOI: http://dx.doi.org/10.1590/S1413-70542009000100037.
SANTOS, C. G. dos; ROMANO, L. N.; BONALDO, S. A.; AUGUSTIN, A. R. Automated System for the processo f artificial rain generation. IRRIGA, Botucatu, v. 21, n.4. p.750-763, outubro-dezembro, 2016. DOI: http://dx.doi.org/10.15809/irriga.2016v21n4p750-763
SANTOS, C. G. dos. Sistematização de conhecimento para qualificação de pontas aspersoras
para simuladores de chuva. 2017. 173p. Tese (Doutorado em Engenharia Agrícola) – Programa
de Pós-Graduação em Engenharia Agrícola Universidade Federal de Santa Maria, Santa Maria, Rio Grande do Sul.
SANTOS, R. D. da S.; BISPO, R. de C.; VENTURA, K. M.; SOUZA, M. H. C. de; SALES, M. A. de L. Avaliação de kit de irrigação por otejamento utilizando água residuária. IRRIGA, Botucatu, IRRIGA & INOVAGRI, p. 110-117, 2017. DOI: http://dx.doi.org/10.15809/irriga.2017v1n1p110-117
SILVA, P. F. da; MATOS, R. M. de.; LIMA, S. C. de; NETO, J. D.; LIMA, V. L. A. de. Obstruction and uniformity in drip irrigation systems by applying treated wastewater. Revista
Ceres, Viçosa, v. 64, n. 4, p. 344-350, Aug. 2017. DOI:
http://dx.doi.org/10.1590/0034-737x201764040002
SILVA, P. F. da; NETO, J. D.; LIMA, V. L. A. de; SANTOS, D. B. dos; RIBEIRO, P. H. P. Evaluation of self compensating emitters irrigating with saline water: part ii: process capability index. Engenharia Agrícola, Jaboticabal, v. 36, n. 6, p. 1086-1095, Dez. 2016. DOI:
http://dx.doi.org/10.1590/1809-4430-eng.agric.v36n6p1086-1095/2016
SOUZA JÚNIOR, S. F. de; MENDES, T. A.; SIQUEIRA, E. Q. Development and calibration of rainfall simulator of hydrological studies. RBRH, Porto Alegre, v. 22, e59, 2017. DOI:
SOUZA JÚNIOR, S. F. de; SIQUEIRA, E, Q. Development and Calibration of a Rainfall Simulator for Urban Hydrology Research. 12th International Conference on Urban Drainage. Porto Alegre-Brazil, 11-16 September. 2011.
TAMAGI, J. T.; URIBE-OPAZO, M. A.; JOHANN, J. A.; BOAS, M. A. V. Uniformidade de distribuição de água de irrigação por aspersores compensantes e não compensantes em diferentes alturas. IRRIGA, Botucatu, v.21, n. 4, p. 631-647, outubro-dezembro, 2016. DOI:
http://dx.doi.org/10.15809/irriga.2016v21n4p631-647
THEBALDI, M. S.; ROCHA, M. S. da.; SANDRI, D.; FALISBERTO, A. B.; NETO AVELITO, S. Diferentes tipos de água e seu efeito na uniformidade de gotejadores na cultura de tomate.
IRRIGA, Botucatu, v.18, n. 2, p. 212-222, abril-junho, 2013. DOI:
http://dx.doi.org/10.15809/irriga.2013v18n2p212
VALIPOUR, M. Optimization of neural networks for precipitation analysis in a humid region to detect drought and wet year alarms. Meteorological Applications. Malden, Vol. 23. Issue 1. 91–100. 2016. DOI: 10.1002/met.1533
VENTURA, K. M.; BISPO, R. de C.; SANTOS, R. D. da S.; SOUZA, M. H. C. de.; ROMÁN, R. M. S. Análise da uniformidade de aplicação em diferentes sistemas de cultivo com irrigação localizada. IRRIGA. Botucatu, Edição Especial IRRIGA & INOVAGRI, p. 57-63, 2017. DOI: http://dx.doi.org/10.15809/irriga.2017v1n1p57-63
ZOCOLER, J. L.; ORSI, M. E. R.; LIMA, R. C.; RODRIGUES, R. A. F. Variação entre a lâmina de irrigação aplicada e armazenada no solo sob condições de irrigação com baixa uniformidade de distribuição de água. IRRIGA, Botucatu, v.18, n. 1, p. 171-183, janeiro-março, 2013. DOI: http://dx.doi.org/10.15809/irriga.2013v18n1p171