ISSN Online: 2162-2086 ISSN Print: 2162-2078
DOI: 10.4236/tel.2019.97170 Oct. 28, 2019 2711 Theoretical Economics Letters
Explaining Differences in the
Flow-Performance Sensitivity of Retail and
Institutional Mutual Funds—International
Evidence
Antonio F. Miguel
1*, Dan Su
21ISCTE-Instituto Universitário de Lisboa (ISCTE-IUL), Business Research Unit (BRU–IUL), Lisboa, Portugal 2ISCTE-Instituto Universitário de Lisboa (ISCTE-IUL), Lisboa, Portugal
Abstract
We use data from 13 countries to study differences in the flow-performance sensitivity between institutional and retail investors. Our results show marked differences between non-US and the US in how institutional and retail inves-tors react to past performance. Compared to retail invesinves-tors, institutional in-vestors sell more poor performers and buy less top performers outside the US, while there is no difference in how institutional and retail investors react to past performance in the US. When we split our sample into countries with more and less sophisticated investors, our results also show significant dif-ferences in the flow-performance sensitivity of institutional and retail inves-tors. Overall, our findings are consistent with institutional investors being more sophisticated than retail investors but only in countries where investors are on average less sophisticated.
Keywords
Mutual Funds, Flow-Performance Sensitivity, Institutional Investor, Retail Investor, Investor Sophistication
1. Introduction
The US mutual fund literature finds a non-linear relation between flows and past performance, as investors tend to buy intensively top performers and do not sell
poor performers with the same intensity [1] [2] [3] [4]. The more investors buy
winners and the less they sell poor performers the more convex is the flow-perf-
ormance relationship. Fund characteristics, including performance volatility [3]
How to cite this paper: Miguel, A.F. and Su, D. (2019) Explaining Differences in the Flow-Performance Sensitivity of Retail and Institutional Mutual Funds—International Evidence. Theoretical Economics Letters, 9, 2711-2731.
https://doi.org/10.4236/tel.2019.97170
Received: September 15, 2019 Accepted: October 25, 2019 Published: October 28, 2019 Copyright © 2019 by author(s) and Scientific Research Publishing Inc. This work is licensed under the Creative Commons Attribution International License (CC BY 4.0).
http://creativecommons.org/licenses/by/4.0/ Open Access
DOI: 10.4236/tel.2019.97170 2712 Theoretical Economics Letters
[5], size [6], and affiliation with large families or families with star funds [3] [7]
[8] [9], age [3][10] [11] and fees [2] [3] [12], advertising [10], and marketing
expenses [11], are responsible for both the level of fund flows into a fund and the
sensitivity of flows to fund past performance. Sirri and Tufano [3] show that
search costs are an important determinant of fund flows. Huang, Wei, and Yang
[5] explain flows reaction to past performance with participation costs, Nanda,
Wang, and Zheng [13], with the fund’s number of share classes, Ivković and
Weisbenner [14] find that tax incentives also explain the flow performance
sen-sitivity, while Kim [15] shows that market volatility and dispersion of fund
manager ability determine the flow-performance relationship. Outside the US, however, there are marked differences in how mutual fund investors react to
past performance. Ferreira, Keswani, Miguel, and Ramos [16] compare the
flow-performance sensitivity across countries around the world and find that convexity is higher in countries where investors are less sophisticated and face
higher costs of participating in the mutual fund industry1.
The convexity of the flow-performance relationship encourages fund
manag-ers to gamble in order to increase the likelihood of becoming top performmanag-ers [2],
and determines how active fund managers are [11] [16] [17]. Finally, investor
response to past performance also determines mutual fund persistence, as flow
determines fund size and future performance [18].
The literature also tries to explain differences between the flow-performance
sensitivity of retail funds and institutional funds. James and Karceski [19]
com-pare institutional funds to retail funds in the US and find that, although both present a convex flow-performance relationship, flows into institutional funds are less sensitive to fund performance than flows into retail funds. Mazur,
Salga-nik-Shoshan, and Zagonov [20] also find a convex flow-performance
relation-ship but mostly for the upper region of the performance scale, while for the low-performance region the relationship is concave. Their results show that the convexity is more pronounced for retail funds, while the concavity is determined
by institutional funds. Del Guercio and Tkac [4] find differences in the
flow-performance sensitivity of the retail mutual fund and fiduciary pension fund segments of the money management industry. They argue that these dif-ferences are explained by difdif-ferences in the clientele they serve. Contrarily to mutual fund investors, pension clients tend to punish poorly performing funds and do not follow recent past winners. This therefore leaves pension managers little incentive to engage in the risk-shifting strategies identified in the mutual
fund literature. Keswani and Stolin [21] examine the flow-performance
rela-tionship separately for flows of retail and institutional investors in the UK and find that the convexity of the flow-performance relationship is more
pro-nounced for retail investors2.
We use data from 13 countries to study differences in the flow-performance 1Different papers compare mutual fund characteristics across countries. This includes differences in fund size [22], fund fees [23], and fund performance [16].
2The literature also shows differences in the performance between institutional and retail funds [24] [25] [26].
DOI: 10.4236/tel.2019.97170 2713 Theoretical Economics Letters sensitivity between institutional and retail investors. We argue that, in countries where the population is more financially literate and where the financial markets are more sophisticated—like the US—retail investors are expected to be on av-erage more sophisticated and therefore it is less likely that we find differences on how retail and institutional investors react to past performance. However, in countries with a less financially literate population and where the financial markets are less sophisticated, retail investors are expected to be less sophisticated. We therefore expect to find differences in the flow-performance sensitivity of retail and institutional investors in these countries. If this is the case, in countries where investors are less sophisticated, we expect retail investors to react less than institutional investors to poor performance, and to be more sensitive to top per-formance. This is because the literature has shown that less sophisticated inves-tors withdraw less from bottom performance funds and tend to flock dispropor-tionately more to recent winners, increasing the convexity of the flow-performance
sensitivity [16].
We start by comparing the US—which is the country with the oldest, largest
and the most developed mutual fund industry in the world [16] [22]—with the
remaining 12 countries in our sample. The results show that the response of flows to past performance is statistically different for institutional investors and retail funds but only outside the US. In non-US countries, institutional investors sell significantly more poor performers and also buy significantly more top per-formers when compared to retail investors. This is consistent with our hypothe-sis stating that, in countries where investors are on average less sophisticated, institutional investors are expected to behave in a more sophisticated way. We then use country-level characteristics to proxy for the level of sophistication in the country and, after classifying the countries in our sample into above-median and below-median for each one of the proxies concerned, we run separate re-gressions for these groups. Our results show that, for that funds at the bottom of the performance scale, institutional investors react more than retail investors to
past performance, i.e., they sell more funds that perform poorly, but only in
countries where investors are less sophisticated. When it comes to top perfor-mance, our results show again that the differences in how institutional investors and retail investors react to past performance are only significantly in less so-phisticated countries. In these countries, institutional investors buy significantly fewer winners than retail investors. Our results are therefore consistent with in-stitutional investors being more sophisticated than retail investors but only in countries where retail investors are on average less sophisticated. Our results are not only statistically significant but also economically meaningful as, in coun-tries where investors are less sophisticated, the flow-performance sensitivity of institutional investors to bottom performers represents more than twice the sen-sitivity of retail investors, and the decrease in the flow-performance sensen-sitivity to top performers by reaches 48%.
Overall our results confirm our hypothesis: 1) in countries where investors are more sophisticated, we find no differences between the flow-performance
sensi-DOI: 10.4236/tel.2019.97170 2714 Theoretical Economics Letters tivity of retail funds and institutional funds; 2) in countries where investors are less sophisticated, we find significant differences on how retail investors and in-stitutional investors react to past performance, and the response of retail inves-tors to past performance increase the convexity of the flow-performance rela-tionship.
Our study makes different contributions to the literature. We contribute to the literature that explains differences in the flow-performance sensitivity of re-tail and institutional funds. There are a large number of studies explaining the flow-performance sensitivity, but only a few explain differences in the behavior of retail investors and institutional investors. Our study also contributes to increase the around the world literature on mutual funds. To the best of our knowledge, we are the first to use cross-country data to study differences in the flow-performance relationship between retail and institutional funds. By using mutual funds from countries where retail investors have different levels of so-phistication, we are able to explain differences in the flow-performance rela-tionship between retail and institutional funds using country-level
characteris-tics3. Finally, our study is important for investors and regulators. The literature
has shown that the flow-performance sensitivity explains both fund fees and fund performance, we might expect to find greater differences in the level of fees and performance between retail funds and institutional funds in countries where retail investors are less sophisticated.
The remainder of this paper is structured as follows. The next section presents our sample and data construction, Section 3 outlines the methodology. Section 4 reports our empirical results. Section 5 explains differences in the flow-performance relationship across countries. Section 6 presents robustness tests, and Section 7 concludes.
2. Sample and Variables Construction
2.1. Sample Description
Our sample is drawn from the Lipper Hindsight survivor-bias free database, which collects the data from fund management companies directly. The sample consists of all open-end and actively managed equity funds during the period 1998 to 2015, and excludes off-shore funds, close-end funds, funds of funds and index funds. As the multiple share classes may lead us to count funds twice, we restrict the sample to primary fund, defined as the share class with the highest
total net assets in Lipper, following Ferreira, Keswani, Miguel, and Ramos [16]4.
Investment Company Institution [27] and EFAMA [28] provide aggregate
sta-tistics of mutual funds for different countries, which we use to check the cover-age of the Lipper Hindsight database. At the end of 2015, ICI and EFAMA rec-3We recognize that augmenting the number of countries in our sample would probably increase even more the differences between retail and institutional across countries. However, in order to draw meaningful conclusions from our analysis, we impose a set of restrictions on our dataset, which leads to a final sample of 13 countries (see Section 2 for further details).
4This is because Lipper Hindsight lists multiple share classes as separate funds even though these funds have the same holdings, the same manager, and the same return before expense and loads.
DOI: 10.4236/tel.2019.97170 2715 Theoretical Economics Letters orded 34,060 equity funds, including all share classes, representing a total net assets (TNA) of $14.6 trillion. This means that the initial coverage of Lipper da-tabase accounts for 95% of the number of equity funds and 86% of TNA of eq-uity funds around the world.
In order to draw some meaningful conclusions from our analysis of different countries, we impose some restrictions on the sample. First, funds in our sample are restricted to at least 24 continuous monthly observations, which ensure that the observations are sufficient to evaluate the risk-adjusted performance. Second, to avoid contingency of data, all the countries included in our sample should present at least 10 funds per quarter for both institutional and retail funds. We, therefore, have a final sample of 22,131 active open-end equity funds in 13
countries around the world from 1998 to 2015. Table 1 (Panel A) presents the
number of funds and TNA across countries at the end of 2015. Panel B presents the data for institutional funds and retail funds.
Panel A shows that, at the end of 2015, there are 12,297 funds in our sample, of which 2031 are institutional funds. The US presents both the highest number of funds and TNA in our sample, representing 26% and 76%, respectively. Ar-gentina is the country with the lowest number of funds and the lowest TNA. In Panel B, we can see that the US is also the country with the highest number of institutional funds, representing 36% of the total number of institutional funds in our sample.
Table 1. Number of funds and total net assets by country. (a) Panel A: Numbers of funds and total net asset by country across all funds; (b) Panel B: Institutional versus retail funds by country.
(a)
Country Numbers of funds TNA ($ million)
Argentina 63 551 Australia 1,266 196,271 Brazil 1,167 32,406 Canada 1,127 297,981 France 1,204 199,498 Germany 332 126,081 Hong Kong 111 37,346 Ireland 717 305,072 Japan 1,500 226,052 Norway 148 47,916 Switzerland 406 160,860 UK 1,094 700,005 US 3,162 7,330,925 All countries 12,297 9,660,965
DOI: 10.4236/tel.2019.97170 2716 Theoretical Economics Letters (b)
Institutional funds Retail funds
Country Number of funds (%) Number of funds (%)
Argentina 15 23.8 48 76.2 Australia 28 2.2 1,238 97.8 Brazil 65 5.6 1,102 94.4 Canada 28 2.5 1,099 97.5 France 33 2.7 1,171 97.3 Germany 13 3.9 319 96.1 Hong Kong 24 21.6 87 78.4 Ireland 130 18.1 587 81.9 Japan 262 17.5 1,238 82.5 Norway 15 10.1 133 89.9 Switzerland 180 44.3 226 55.7 UK 88 8.0 1,006 92.0 US 1,150 36.4 2,012 63.6 All countries 2,031 16.5 10,266 83.5
2.2. Variables Construction
2.2.1. Fund FlowsWe follow Chevalier and Ellison [2] and Sirri and Tufano [3] and calculate fund
flow as the new money growth rate that is due to new external money. Fund flow
for fund i in country c at quarter t is calculated as:
(
)
, , , , 1 , , , , , , 1 TNA TNA 1 Flow TNA i c t i c t i c t i c t i c t R − − − + = , (1)where TNAi c t, , is the total net asset value in local currency of fund i in country
c at the end of quarter t, and Ri c t, , is fund i’s raw return from country c in
quarter t. Table 2 presents descriptive statistics of fund flows by country for
in-stitutional funds and retail funds and for all funds. The average quarterly flow in our sample is −0.21%. To prevent extreme values driving our results, fund flows are winsorized by country at the bottom and top 1% level of the distribution.
2.2.2. Performance Measurement
We measure fund performance using raw returns and risk-adjusted returns (i.e.,
Carhart [29] four-factor alpha)5. The calculation of total returns assumes that
dividends are immediately reinvested. As in the US literature, our raw returns are gross of taxes and net of total expenses.
We follow Ferreira, Keswani, Miguel, and Ramos [30] and estimate four-factor
alpha for domestic, regional and global funds by using domestic, regional and world factors based on a fund’s investment region in the Lipper geographic focus
field6. We run the following regression:
5In robustness tests we also use one-factor alpha.
DOI: 10.4236/tel.2019.97170 2717 Theoretical Economics Letters Table 2. Fund flows by country.
All funds Institutional funds Retail funds
Country observations Mean Number of Standard deviation observations Number of Mean deviation Standard observations Mean Number of deviation Standard
Argentina 1,747 −0.65 18.26 176 −0.56 14.78 1,571 −0.77 22.30 Australia 40,126 −0.88 13.82 2,513 −2.98 15.38 37,613 −0.74 13.70 Brazil 24,293 −1.99 16.00 1,527 −1.96 17.02 22,766 −1.99 15.93 Canada 50,104 0.49 15.96 988 −0.26 12.90 49,116 0.50 16.01 France 61,664 −0.37 16.73 1,481 1.42 21.08 60,183 −0.41 16.61 Germany 18,788 −1.85 13.41 457 −3.48 18.06 18,331 −1.81 13.27 Hong Kong 3,817 0.57 16.51 755 1.70 12.16 3,062 0.29 17.40 Ireland 25,279 −0.98 19.04 3,277 −0.66 19.30 22,002 −1.03 19.00 Japan 54,700 −1.85 15.10 8,534 4.09 17.08 46,166 −2.95 14.43 Norway 8,832 0.76 18.15 634 3.28 24.74 8,198 0.56 17.53 Switzerland 12,940 −1.14 12.94 4,062 −0.17 13.93 8,878 −1.59 12.43 UK 50,379 −0.16 15.05 3,856 −1.36 16.59 46,523 −0.07 14.91 US 191,198 0.74 16.29 53,107 0.96 16.38 138,091 0.65 16.25 All countries 543,867 −0.21 15.94 81,191 0.87 16.64 462,676 −0.41 15.81 , 1 , 2 , 3 , 4 , , i t i i t i t i t i t i t R =
α β
+ MKT +β
SMB +β
HML +β
MOM +ε
(2)where Ri,t is the return net of fees in local currency of fund i in month t in excess
of the one-month correspondent risk-free benchmark, MKTi,t (market) is the
excess return in the fund’s investment region in month t, SMBi,t (small minus
big) is the average return on the small-capitalization stock portfolio minus the
average return on the large-capitalization stock portfolio in the fund’s investment
region, HMLi,t (high minus low) is the average return on high book-to-market
stock portfolio minus the average return on low book-to-market stock portfolio
in the fund’s investment region, and MOMi,t (momentum) is the average return
on past 12-month winners portfolio minus the average return on past 12-month losers portfolio in the fund’s investment region. The previous 36 months of net fund returns are used to estimate the time series regression of monthly excess returns based on the fund’s factor portfolios. We then compare the difference between the expected return and realized return of the fund and use this to esti-mate the fund’s abnormal return (or alpha) in each month. Finally, we
com-pound monthly alphas to calculate quarterly alphas7. Table 3 (Panel A), presents
average performance measures by country. The average raw return and the av-erage four-factor alpha in our sample is 1.76% and −0.44%, respectively.
2.2.3. Control Variables
Fund size determines fund flows, as larger funds tend to capture more flows [2]
7See Ferreira, Keswani, Miguel, and Ramos [16] for further details on the calculation of our perfor-mance measures.
DOI: 10.4236/tel.2019.97170 2718 Theoretical Economics Letters Table 3. Fund-level characteristics. (a) Panel A. Average quarterly fund-level characteristics by country; (b) Panel B. Pairwise correlation of fund-level characteristics.
(a)
Country Raw return (%) One-factor alpha (%) Four-factor alpha (%) ($ million) Size Family size ($ million) Age TSC (%) SMB HML Countries sold
Argentina 4.04 −1.44 −0.95 10.35 45.29 11.58 2.94 0.29 0.09 1.00 Australia 1.78 −0.39 −0.16 182.51 5,083.50 9.81 1.65 −0.09 −0.04 1.14 Brazil 0.13 −3.03 −4.01 76.30 4,312.31 7.72 1.79 0.20 −0.17 1.00 Canada 1.57 −0.68 −0.64 256.11 12,744.06 11.75 3.20 0.04 −0.01 1.00 France 1.60 −0.70 −0.69 160.94 7,240.96 11.85 2.32 0.05 −0.06 1.64 Germany 1.78 −0.71 −0.68 317.03 13,046.04 13.72 2.40 0.04 −0.12 1.88 Hong Kong 2.01 0.33 0.08 245.93 3,794.30 12.31 2.31 0.03 −0.14 2.35 Ireland 1.66 −0.44 −0.40 350.32 5,782.31 8.52 2.44 0.10 −0.07 7.87 Japan 2.03 −0.63 −0.57 122.68 16,802.76 9.16 1.86 0.15 0.01 1.00 Norway 2.65 −0.19 0.13 200.38 3,215.97 11.43 1.66 0.16 0.01 1.62 Switzerland 1.74 −0.36 −0.05 298.74 15,561.96 11.79 1.71 0.08 −0.10 1.29 UK 2.25 −0.07 0.01 480.71 10,734.98 15.13 2.11 0.22 −0.08 2.04 US 1.80 −0.28 −0.04 1,531.33 63,059.61 13.68 1.59 0.18 −0.01 1.06 All countries 1.76 −0.53 −0.44 688.13 28,365.02 12.09 1.99 0.12 −0.04 1.58
See Appendix 1 for variable definitions.
(b) 1 2 3 4 5 6 7 8 9 10 11 Raw return 1 1.00 One-factor alpha 2 0.41 1.00 Four-factor alpha 3 0.35 0.79 1.00 Flows 4 0.01 0.02 0.01 1.00 Size 5 0.02 0.03 0.02 0.38 1.00 Family size 6 0.06 0.08 0.06 0.01 0.02 1.00 Age 7 0.01 0.02 0.02 0.19 0.13 −0.05 1.00 Fee 8 −0.01 −0.03 −0.03 −0.11 −0.15 −0.02 −0.01 1.00 SMB 9 0.02 0.00 0.00 −0.03 0.00 0.00 −0.03 0.06 1.00 HML 10 −0.01 0.02 −0.02 0.00 0.00 0.02 0.00 −0.07 −0.17 1.00 Countries sold 11 0.01 0.02 0.01 0.01 −0.03 0.01 0.01 0.09 −0.01 −0.03 1.00
[3] [29]). We control for fund family size as many studies show that fund family
size has a strong impact on flows, including Nanda, Wang, and Zheng [9]. We
include fund age and fees as they have a significant impact on flows [5] [12].
Following Ferreira, Keswani, Miguel, and Ramos [16], we measure fund style
using the loadings on SMB and HML, and include the number of countries
DOI: 10.4236/tel.2019.97170 2719 Theoretical Economics Letters
presents averages of fund level control variables by country. Table 3 (Panel B)
presents the pairwise correlation matrix between fund control variables. Since the correlation coefficients are generally low, multicollinearity among these va-riables seems to be week, suggesting that these vava-riables can be included together in our regressions.
3. Methodology
3.1. The Flow-Performance Sensitivity: Linear Approach
We start by assuming a linear relationship between fund flows and performance, and, in each country-quarter, we rank last year fund performance measured
us-ing raw returns and four-factor alpha. We then regress fund flows of fund i, in
country c and quarter t on past performance rank together with the control
va-riables presented in Section 2. We therefore run the following panel regression:
, , 1 , , 1 1
Flowsi c t = +a
β
Performance ranki c t− +θ
Xt− +ε
t. (3)We also include country, time, investment region, and fund type (domestic, foreign, regional and global) fixed effects and standard errors adjusted for clus-tering by country or by fund when we run the regression for US funds. We start by running a first specification for all funds in our sample and, to test whether there are differences in how investors react to past performance in the US and outside the US, we separately run a regression for non-US countries and just for the US.
We move on and, because our aim is to study differences in the flow-perfor- mance sensitivity between institutional funds and retail funds, we next run ad-ditional specifications where we interact past performance rank with a dummy variable that takes the value of one if the fund is institutional and zero other-wise:
, , 1 , , 1
2 , , 1 3 1
Flows Performance rank Institutional
Performance rank Institutional .
i c t i c t i c t t t a X β β β θ ε − − − = + ∗ + + + + (4)
The regression includes all the control variables included in Equation (3), and also include country, time, investment region, and fund type (domestic, foreign, regional and global) fixed effects and standard errors adjusted for clustering by country or by fund when we run the regression for US funds.
3.2. The Flow-Performance Sensitivity: Three-Piecewise Linear
Approach
The literature is shown that mutual fund investors react differently to favorable
and poor past performance. We therefore follow, e.g., Sirri and Tufano [3] and
Ferreira, Keswani, Miguel, and Ramos [16] and use a piecewise-linear
specifica-tion, which allows for different flow-performance sensitivities at different levels
of performance. We allow slopes to differ for the lowest quintile [Lowi,c,t–1 = min
(0.2, Rank)], middle three-quintiles [Midi,c,t–1 = min (0.6, Rank-Lowi,c,t–1)], and
DOI: 10.4236/tel.2019.97170 2720 Theoretical Economics Letters performance rank. The coefficients on these piecewise decompositions of frac-tional ranks represent the marginal fund-flow response to performance. We then rerun Equation (3) and Equation (4), replacing performance rank with the three different levels of performance:
, , , 1 , , 1 2 , , 1 3 , , 1 , , 1 1 Flows Institutional . i c r t i c t i c t i c t i c t t t
a Low Mid High
X β β β δ θ ε − − − − − = + + + + + + (5) , , , 1 , , 1 2 , , 1 3 , , 1 , , 1 3 , , 1 4 , , 1 , , 1 5 , , 1 6 , , 1 , , 1 , , 1 1 Flows Institutional Institutional Institutional Institutional i c r t i c t i c t i c t i c t i c t i c t i c t i c t i c t i c t i c t t
a Low Mid High
Mid Mid High
High X β β β β β β β δ θ − − − − − − − − − − − − = + + + × + + × + + × + + +εt. (6) These regressions also include country, time, investment region, and fund type fixed effects and standard errors adjusted for clustering by country or by fund in the case of running the regression only for US funds. Finally, we run a Wald-test testing whether there is a significant difference in the slope of the
flow-performance function between High and Low regions of the performance
scale.
4. Empirical Results
Table 4 (Panel A) presents the results for the regressions in Equation (3) and Table 4. The impact of institutional funds on the flow-performance relationship. (a) Panel A: The linear approach; (b) Panel B: Three-piecewise linear approach.
(a)
Raw returns Four-factor alpha
All countries Non-US US All countries Non-US US
(1) (2) (3) (4) (5) (6) (7) (8) (9) (10) (11) (12) Performance 0.0572*** 0.0570*** 0.0469*** 0.0488*** 0.0752*** 0.0749*** 0.0492*** 0.0482*** 0.0385*** 0.0397*** 0.0673*** 0.0656*** (0.00) (0.00) (0.00) (0.00) (0.00) (0.00) (0.00) (0.00) (0.00) (0.00) (0.00) (0.00) Performance × institutional 0.0015 −0.0267*** 0.0011 0.0008 −0.0179*** 0.0009 (0.60) (0.00) (0.78) (0.43) (0.00) (0.84) Institutional 0.0014 0.0006 0.0120*** 0.0258*** −0.0083*** −0.0089*** 0.0015 −0.0027 0.0122*** 0.0214*** −0.0079*** −0.0116*** (0.35) (0.80) (0.00) (0.00) (0.00) (0.00) (0.30) (0.24) (0.00) (0.00) (0.00) (0.00) Log Size −0.0051*** −0.0051*** −0.0039*** −0.0039*** −0.0077*** −0.0077*** −0.0049*** −0.0049*** −0.0037*** −0.0037*** −0.0074*** −0.0074*** (0.00) (0.00) (0.00) (0.00) (0.00) (0.00) (0.00) (0.00) (0.00) (0.00) (0.00) (0.00)
Log Family Size 0.0020*** 0.0020*** 0.0012*** 0.0012*** 0.0032*** 0.0032*** 0.0022*** 0.0022*** 0.0013*** 0.0013*** 0.0034*** 0.0034*** (0.00) (0.00) (0.00) (0.00) (0.00) (0.00) (0.00) (0.00) (0.00) (0.00) (0.00) (0.00) Log Age −0.0125*** −0.0125*** −0.0105*** −0.0105*** −0.0150*** −0.0150*** −0.0120*** −0.0121*** −0.0100*** −0.0100*** −0.0144*** −0.0144*** (0.00) (0.00) (0.00) (0.00) (0.00) (0.00) (0.00) (0.00) (0.00) (0.00) (0.00) (0.00) Fee −0.2738*** −0.2739*** −0.1730*** −0.1741*** −0.6299*** −0.6305*** −0.2645*** −0.2650*** −0.1773*** −0.1778*** −0.5628*** −0.5656*** (0.00) (0.00) (0.01) (0.01) (0.00) (0.00) (0.00) (0.00) (0.01) (0.01) (0.00) (0.00) Flows 0.1846*** 0.1846*** 0.1754*** 0.1752*** 0.1943*** 0.1943*** 0.1881*** 0.1881*** 0.1779*** 0.1778*** 0.2002*** 0.2003***
DOI: 10.4236/tel.2019.97170 2721 Theoretical Economics Letters Continued (0.00) (0.00) (0.00) (0.00) (0.00) (0.00) (0.00) (0.00) (0.00) (0.00) (0.00) (0.00) SMB 0.0010 0.0010 0.0002 0.0002 0.0014 0.0014 0.0041** 0.0041** 0.0028* 0.0028* 0.0050 0.0049 (0.48) (0.48) (0.87) (0.91) (0.72) (0.72) (0.01) (0.01) (0.07) (0.07) (0.26) (0.27) HML 0.0019*** 0.0019*** 0.0019*** 0.0019*** 0.0114*** 0.0114*** 0.0020*** 0.0020*** 0.0020*** 0.0020*** 0.0113*** 0.0113*** (0.00) (0.00) (0.00) (0.00) (0.00) (0.00) (0.00) (0.00) (0.00) (0.00) (0.00) (0.00) Countries sold 0.0019*** 0.0019*** 0.0019*** 0.0019*** 0.0114*** 0.0114*** 0.0020*** 0.0020*** 0.0020*** 0.0020*** 0.0113*** 0.0113*** (0.00) (0.00) (0.00) (0.00) (0.00) (0.00) (0.00) (0.00) (0.00) (0.00) (0.00) (0.00) Adjusted R-squared 0.065 0.065 0.054 0.054 0.087 0.087 0.063 0.063 0.051 0.051 0.085 0.085 Number of observations 543,867 543,867 352,669 352,669 191,198 191,198 543,867 543,867 352,669 352,669 191,198 191,198 (b)
Raw returns Four-factor alpha
All countries Non-US US All Non-US US
(1) (2) (3) (4) (5) (6) (7) (8) (9) (10) (11) (12) Low 0.0583*** 0.0530*** 0.0598*** 0.0391** 0.0556*** 0.0902*** 0.0450*** 0.0426*** 0.0515*** 0.0475*** 0.0574*** 0.0218 (0.00) (0.00) (0.00) (0.04) (0.00) (0.00) (0.00) (0.00) (0.00) (0.00) (0.00) (0.23) Low × Institutional 0.0469** 0.0514** 0.0255 0.0416** 0.0516** 0.0319 (0.02) (0.04) (0.19) (0.05) (0.03) (0.25) Mid 0.0436*** 0.0441*** 0.0350*** 0.0362*** 0.0604*** 0.0644*** 0.0366*** 0.0356*** 0.0275*** 0.0284*** 0.0537*** 0.0533*** (0.00) (0.00) (0.00) (0.00) (0.00) (0.00) (0.00) (0.00) (0.00) (0.00) (0.00) (0.00) Mid × Institutional −0.0043 −0.0132** −0.0152** 0.0059 −0.0108* 0.0007 (0.32) (0.03) (0.01) (0.13) (0.09) (0.90) High 0.1588*** 0.1573*** 0.1264*** 0.1757*** 0.2004*** 0.1877*** 0.1461*** 0.1454*** 0.1081*** 0.1569*** 0.2006*** 0.1917*** (0.00) (0.00) (0.00) (0.00) (0.00) (0.00) (0.00) (0.00) (0.00) (0.00) (0.00) (0.00) High × Institutional 0.0115 −0.0734*** 0.0288 0.0091 −0.0674** 0.0395 (0.52) (0.00) (0.15) (0.66) (0.02) (0.15) Institutional 0.0016 −0.0059* 0.0123*** 0.0215*** −0.0081*** −0.0209*** 0.0019 −0.0060 0.0123*** 0.0084 −0.0075*** −0.0144*** (0.26) (0.10) (0.00) (0.00) (0.00) (0.00) (0.20) (0.10) (0.00) (0.15) (0.00) (0.00) Control
Variables Yes Yes Yes Yes Yes Yes Yes Yes Yes Yes Yes Yes
Adjusted R-squared 0.066 0.066 0.054 0.054 0.088 0.089 0.063 0.063 0.052 0.052 0.086 0.086 Number of observations 543,867 543,867 352,669 352,669 191,198 191,198 543,867 543,867 352,669 352,669 191,198 191,198 Wald test βHigh = βLow (p-value) (0.00) (0.00) (0.00) (0.00) (0.00) (0.00)
DOI: 10.4236/tel.2019.97170 2722 Theoretical Economics Letters Equation (4), when we study the flow-performance sensitivity assuming a linear
approach, while Table 4 (Panel B) presents the results for the piecewise linear
approach presented in Equation (5) and Equation (6). Performance is measured using both raw returns and four-factor alpha.
The results in Panel A of Table 4 show that institutional funds get
signifi-cantly more flows than retail funds outside the US and signifisignifi-cantly less flows than retail funds in the US (columns (3) and (9), and columns (5) and (11), re-spectively). When we interact past performance rank with the dummy variable
Institutional, the results show that institutional funds react significantly less to past performance outside the US (columns (4) and (10)) and that there is no sig-nificant difference on how institutional and retail investors react to past perfor-mance in the US. The results are similar whether we use raw returns or four-factor alpha as the performance measure. The coefficients on the remaining
control variables are consistent with the findings in the literature [5] [16].
The results in Table 4 (Panel B) show, in columns (1) and (7), that the
flow-performance relationship is convex when we pool the countries in our sample. The Wald test at the bottom of the table is always significant and con-firms that investors buy significantly more top performers than sell bottom per-formers. The convexity in the flow-performance relationship also remains sig-nificant when we run the regressions for countries outside the US (in columns
(3) and (9)) and for the US (in columns (5) and (11)). When, we interact Low,
Mid., and High with the institutional dummy variable, the results show that
while in non-US countries there are significant differences in how retail and in-stitutional investors react to past performance (columns (4) and (10)), in the US these differences are not statistically significant (columns (6) and (12)). Outside the US, institutional investors sell more poor performers and buy less top per-formers than retail investors, which, according to the findings in Ferreira,
Kes-wani, Miguel, and Ramos [16], is consistent with institutional investors being
more sophisticated than retail investors, and confirms our hypothesis. The re-sults are also economically important. When we use four-factor alpha as our performance measure, in column (10) the sensitivity of flows to poor performers more than doubles and the sensitivity of flows to top-performers decreases by 43% in the case of institutional investors.
5. Explaining the Flow-Performance Relationship across
Countries
In Section 4, we find differences on the flow-performance sensitivity for retail and institutional funds while comparing non-US countries to the US. In the US, where the investors are more sophisticated, there are no differences on how re-tail and institutional investors react to past performance. Outside the US, rere-tail
investors react less to poor performance and more to top performance, i.e., the
flow performance sensitivity is more convex for retail investors, which is consis-tent with retail investors being less sophisticated than institutional investors.
DOI: 10.4236/tel.2019.97170 2723 Theoretical Economics Letters Our findings are therefore consistent with differences in investor sophistica-tion across countries to explain differences on the flow-performance sensitivity across countries. To test if that is the case, we now use proxies for investor
so-phistication and rerun the regressions in Table 4 splitting our sample into
countries with more and less sophisticated investors.
Our proxies for investor sophistication include people’s internet access, the level of financial literacy, and the level of financial sophistication in the country. Internet is a sophisticated channel to access information and spread funds characteristics. Greater internet use reduces informational participation costs of
investing in mutual funds [16]. Data is from the World Development Indicators.
Financial literacy is defined as the percentage of adults that are financially
lite-rate and are from Klapper, Lusardi, and Oudheusden [31]. Financial literacy is a
measure of how people understand various financial areas. This includes topics related to personal finance, money and investing and, and therefore financial
li-teracy affects financial behavior in many ways [32]. Lusardi and Mitchelli [33]
and Rooij, Lusardi, and Alessie [34] show that households with low financial
li-teracy are less likely to wisely manage their investments, as less financial literate tend to incur in more risk and expenses that could be avoided. Final, we include the financial sophistication of retail investors as a proxy for investor sophistica-tion. Data is from the World Economic Forum in the annual Global
Competi-tiveness. Table 5 presents averages for our proxies for investor sophistication
across countries.
Next, we run the regressions using the piecewise linear approach, presented in Table 5. Proxies for investor sophistication averaged across countries.
Country Internet (%) literacy (%) Financial sophistication Financial
Argentina 46.31 28 3.90 Australia 77.18 64 6.27 Brazil 46.83 35 5.40 Canada 78.50 68 6.24 France 67.12 52 5.89 Germany 76.40 66 6.07 Hong Kong 69.46 43 6.47 Ireland 65.56 55 5.95 Japan 76.18 43 5.16 Norway 88.05 71 5.63 Switzerland 81.90 57 6.66 UK 80.25 67 6.72 US 78.65 57 6.44 All countries 71.59 54 6.14
DOI: 10.4236/tel.2019.97170 2724 Theoretical Economics Letters Equation (6), splitting our sample into countries with more and less sophisti-cated investors. We run separately regressions for countries with below-median and above-median of the development variable concerned. In order to avoid giving excessive weight to countries in our sample with a greater fraction of number of funds, we use weighted least squares, weighting each fund by the
in-verse of the number of funds in that country-quarter8.
Table 6 presents the results and shows that, in below-median countries, i.e., the countries where investors are less sophisticated, institutional investors are more sensitive to poor performance than retail investors and sell more funds when they perform poorly. Above-median countries are the ones with more so-phisticated investors and, in these countries, our results show no statistically sig-nificant difference in how retail and institutional investors react to poor perfor-mance. When it comes to top performance, the results show no difference on how institutional investors and retail investors react to past performance in countries where investors are more sophisticated (above-median countries). However, in countries where investors are less sophisticated (below-median Table 6. Flow-performance sensitivity and country-level investors sophistication.
Internet (%) Financial literacy Financial sophistication
Below Above Below Above Below Above
(1) (2) (3) (4) (5) (6) Low 0.0344*** 0.0450*** 0.0104 0.0595*** 0.0162 0.0564*** (0.01) (0.00) (0.46) (0.00) (0.24) (0.00) Low × Institutional 0.0795* 0.0208 0.1174** −0.0015 0.1132** −0.0010 (0.10) (0.37) (0.01) (0.95) (0.02) (0.97) Mid 0.0286*** 0.0396*** 0.0272*** 0.0395*** 0.0261*** 0.0404*** (0.00) (0.00) (0.00) (0.00) (0.00) (0.00) Mid × Institutional −0.0079 0.0044 −0.0159* 0.0086** −0.0145* 0.0078* (0.50) (0.28) (0.06) (0.05) (0.09) (0.07) High 0.2185*** 0.1575*** 0.1214*** 0.1593*** 0.1233*** 0.1584*** (0.00) (0.00) (0.00) (0.00) (0.00) (0.00) High × Institutional −0.0828** 0.0141 −0.0904** 0.0295 −0.0838* 0.0283 (0.04) (0.53) (0.04) (0.19) (0.06) (0.21) Institutional −0.0147* −0.0031 0.0130 −0.0093** 0.0134 −0.0089** (0.05) (0.48) (0.14) (0.02) (0.13) (0.03)
Control Variables Yes Yes Yes Yes Yes Yes
Adjusted R-squared 0.051 0.070 0.066 0.063 0.064 0.064
Number of observations 175,714 368,153 171,500 372,367 176,515 367,352
*, **, and *** indicate significance at the 10%, 5%, and 1% level, respectively. See Appendix 1 for variable definitions.
8In robustness tests we also run a separate specification excluding the US as this country represents 35% of the observations in our sample.
DOI: 10.4236/tel.2019.97170 2725 Theoretical Economics Letters countries), we can see that institutional investors are significantly less sensitive to past performance. This is consistent with what we would expect, as it shows that, in less sophisticated countries, institutional investors are on average more sophisticated than retail investors. The results are also economically important. If, for example, we take the results in column (1), in countries where investors are less sophisticated, the sensitivity of institutional investors to bottom perfor-mance is 2.3 times higher than the sensitivity of retail investors to bottom per-formers. In the case of top performance, institutional investors buy on average 38% less top performers than retail investors.
6. Robustness
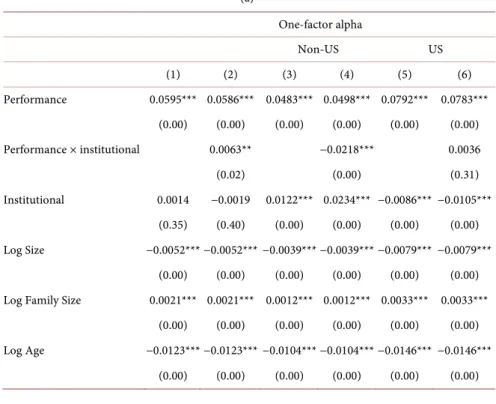
In order to check the robustness of our results, we run some additional tests. We
start by rerunning the results in Table 4, Panel A and Panel B, using now
one-factor alpha as our performance measure. The results are presented in Table
7 (Panel A, Panel B), for the linear approach and the three-piecewise linear
ap-proach, respectively, and show that our main findings remain unchanged.
We next rerun the results in Table 6, excluding US funds. This is because the
US is by far the country with a large number of observations in our study. The
results are presented in Table 8 and show that even when we exclude the US the
main results remain unchanged. In countries where investors are more sophisti-cated, there are no differences in how retail investors and institutional investors respond to past performance.
Table 7. The impact of institutional funds on the flow-performance relationship— One-factor alpha. (a) Panel A: The linear approach; (b) Panel B: Three-piecewise linear approach. (a) One-factor alpha Non-US US (1) (2) (3) (4) (5) (6) Performance 0.0595*** 0.0586*** 0.0483*** 0.0498*** 0.0792*** 0.0783*** (0.00) (0.00) (0.00) (0.00) (0.00) (0.00) Performance × institutional 0.0063** −0.0218*** 0.0036 (0.02) (0.00) (0.31) Institutional 0.0014 −0.0019 0.0122*** 0.0234*** −0.0086*** −0.0105*** (0.35) (0.40) (0.00) (0.00) (0.00) (0.00) Log Size −0.0052*** −0.0052*** −0.0039*** −0.0039*** −0.0079*** −0.0079*** (0.00) (0.00) (0.00) (0.00) (0.00) (0.00)
Log Family Size 0.0021*** 0.0021*** 0.0012*** 0.0012*** 0.0033*** 0.0033***
(0.00) (0.00) (0.00) (0.00) (0.00) (0.00)
Log Age −0.0123*** −0.0123*** −0.0104*** −0.0104*** −0.0146*** −0.0146***
DOI: 10.4236/tel.2019.97170 2726 Theoretical Economics Letters Continued Fee −0.2712*** −0.2720*** −0.1681*** −0.1682*** −0.6319*** −0.6333*** (0.00) (0.00) (0.01) (0.01) (0.00) (0.00) Flows 0.1838*** 0.1838*** 0.1750*** 0.1748*** 0.1927*** 0.1927*** (0.00) (0.00) (0.00) (0.00) (0.00) (0.00) SMB 0.0016 0.0016 0.0006 0.0005 0.0021 0.0021 (0.27) (0.27) (0.66) (0.70) (0.57) (0.57) HML 0.0019*** 0.0019*** 0.0019*** 0.0019*** 0.0121*** 0.0120*** (0.00) (0.00) (0.00) (0.00) (0.00) (0.00) Number of
countries fund sold 0.0019*** 0.0019*** 0.0019*** 0.0019*** 0.0121*** 0.0120***
(0.00) (0.00) (0.00) (0.00) (0.00) (0.00)
Adjusted R-squared 0.066 0.066 0.054 0.054 0.090 0.090
Number of observations 543,867 543,867 352,669 352,669 191,198 191,198
*, **, and *** indicate significance at the 10%, 5%, and 1% level, respectively. See Appendix 1 for variable definitions.
(b)
All countries Non-US US
(1) (2) (3) (4) (5) (6) Low 0.0499*** 0.0451*** 0.0518*** 0.0403*** 0.0433** 0.0801*** (0.00) (0.00) (0.00) (0.00) (0.03) (0.00) Low × Institutional 0.0505*** 0.0412* 0.0267 (0.01) (0.07) (0.21) Mid 0.0465*** 0.0459*** 0.0368*** 0.0376*** 0.0649*** 0.0663*** (0.00) (0.00) (0.00) (0.00) (0.00) (0.00) Mid × Institutional 0.0034 −0.0093 −0.0060 (0.37) (0.12) (0.24) High 0.1648*** 0.1660*** 0.1318*** 0.1807*** 0.2168*** 0.2144*** (0.00) (0.00) (0.00) (0.00) (0.00) (0.00) High × Institutional −0.0068 −0.0855*** 0.0095 (0.72) (0.00) (0.69) Institutional 0.0017 −0.0086** 0.0125*** 0.0180*** −0.0084*** −0.0214*** (0.26) (0.02) (0.00) (0.00) (0.00) (0.00)
Control Variables Yes Yes Yes Yes Yes Yes
Adjusted R-squared 0.067 0.067 0.055 0.055 0.091 0.091
Number of observations 543,867 543,867 352,669 352,669 191,198 191,198
Wald test β High = β Low
(p-value) (0.00) (0.00) (0.00)
*, **, and *** indicate significance at the 10%, 5%, and 1% level, respectively. See Appendix 1 for variable definitions.
DOI: 10.4236/tel.2019.97170 2727 Theoretical Economics Letters Table 8. Flow-performance sensitivity and country-level investor sophistication—excluding the US.
Internet (%) Financial literacy Financial sophistication
Below Above Below Above Below Above
(1) (2) (3) (4) (5) (6) Low 0.0344*** 0.0610*** 0.0104 0.0848*** 0.0162 0.0795*** (0.01) (0.00) (0.46) (0.00) (0.24) (0.00) Low × Institutional 0.0795* −0.0410 0.1174** −0.0359 0.1132** −0.0371 (0.10) (0.37) (0.01) (0.44) (0.02) (0.41) Mid 0.0286*** 0.0280*** 0.0272*** 0.0290*** 0.0261*** 0.0302*** (0.00) (0.00) (0.00) (0.00) (0.00) (0.00) Mid × Institutional −0.0079 −0.0062 −0.0159* −0.0139 −0.0145* −0.0148 (0.50) (0.40) (0.06) (0.14) (0.09) (0.10) High 0.2185*** 0.1641*** 0.1214*** 0.1779*** 0.1233*** 0.1656*** (0.00) (0.00) (0.00) (0.00) (0.00) (0.00) High × Institutional −0.0828** −0.0157 −0.0904** −0.0142 −0.0838* −0.0145 (0.04) (0.67) (0.04) (0.41) (0.06) (0.51) Institutional −0.0147* 0.0345*** 0.0130 0.0030 0.0134 0.0036 (0.05) (0.00) (0.14) (0.70) (0.13) (0.64)
Control Variables Yes Yes Yes Yes Yes Yes
Adjusted R-squared 0.051 0.057 0.066 0.041 0.064 0.042
Number of observations 175,714 176,955 171,500 181,169 176,515 176,154
*, **, and *** indicate significance at the 10%, 5%, and 1% level, respectively. See Appendix 1 for variable definitions.
7. Conclusions
The literature that studies differences on investment decisions between institu-tional and retail investors is mostly based on the US mutual fund industry.
According to Ferreira, Keswani, Miguel, and Ramos [16], the findings of
flow-performance relationship in the US do not map directly onto other coun-tries. To examine the differences between retail and institutional investors on the flow-performance relationship, we use a large sample of actively managed equity mutual funds in 13 countries. Consistent with the literature, we find a convex flow-performance relationship, but we also find significantly greater convexity in the flow-performance relationship of retail investors outside the US. This is be-cause outside the US retail investors tend to sell less poor performer funds and buy more top performers.
We then hypothesize that investor sophistication explains differences in how retail and institutional investors react to past performance across countries. We use a piecewise linear relationship to rank past performance and, when we com-pare how retail and institutional investors respond to top performance, we find
DOI: 10.4236/tel.2019.97170 2728 Theoretical Economics Letters that institutional investors react significantly different to past performance but only in countries where investors are less sophisticated. In those countries, in-stitutional investors buy significantly less funds when they perform well and sell significantly more funds when they perform poorly. These findings provide evi-dence that institutional investors are more sophisticated than retail investors in less sophisticated countries. In more sophisticated countries, like the US, retail investors have the same degree of sophistication as institutional investors.
Conflicts of Interest
The authors declare no conflicts of interest regarding the publication of this pa-per.
References
[1] Ippolito, R. (1992) Consumer Reaction to Measures of Poor Quality: Evidence from the Mutual Fund Industry. Journal of Law and Economics, 35, 45-70.
https://doi.org/10.1086/467244
[2] Chevalier, J. and Ellison, G. (1997) Risk Taking by Mutual Funds as a Response to Incentives. Journal of Political Economy, 105, 1167-1200.
https://doi.org/10.1086/516389
[3] Sirri, E.R. and Tufano, P. (1998) Costly Search and Mutual Fund Flows. Journal of
Finance, 53, 1589-1622.https://doi.org/10.1111/0022-1082.00066
[4] Del Guercio, D. and Tkac, P.A. (2002) The Determinants of the Flow of Funds of Managed Portfolios: Mutual Funds vs. Pension Funds. Journal of Financial and
Quantitative Analysis, 37, 523-557.https://doi.org/10.2307/3595011
[5] Huang, J., Wei, K.D. and Yan, H. (2007) Participation Costs and the Sensitivity of Fund Flows to Past Performance. Journal of Finance, 62, 1273-1311.
https://doi.org/10.1111/j.1540-6261.2007.01236.x
[6] Barber, B., Odean, T. and Zheng, L. (2005) Out of Sight, Out of Mind: The Effects of Expenses on Mutual Fund Flows. Journal of Business, 78, 2095-2120.
https://doi.org/10.1086/497042
[7] Massa, M. (2003) How Do Family Strategies Affect Fund Performance? When Per-formance Maximization Is Not the Only Game in Town. Journal of Financial
Eco-nomics, 67, 249-304.https://doi.org/10.1016/S0304-405X(02)00253-2
[8] Khorana, A. and Servaes, H. (2004) Conflicts of Interest and Competition in the Mutual Fund Industry. Working Paper, London Business School.
[9] Nanda, V., Wang, Z.J. and Zheng, L. (2004) Family Values and the Star Phenome-non: Strategies of Mutual Fund Families. Review of Financial Studies, 17, 667-698. https://doi.org/10.1093/rfs/hhg054
[10] Jain, P. and Wu, J. (2000) Truth in Mutual Fund Advertising: Evidence on Future Performance and Fund Flows. Journal of Finance, 55, 937-958.
https://doi.org/10.1111/0022-1082.00232
[11] Cremers, M., Ferreira, M., Matos, P. and Starks, L. (2016) Indexing and Active Fund Management: International Evidence. JournalofFinancialEconomics, 120, 539-560.
https://doi.org/10.1016/j.jfineco.2016.02.008
[12] Gil-Bazo, J. and Ruiz-Verdú, P. (2009) The Relation between Price and Perfor-mance in the Mutual Fund Industry. Journal of Finance, 64, 2153-2183.
DOI: 10.4236/tel.2019.97170 2729 Theoretical Economics Letters [13] Vikram, N., Wang, Z. and Zheng, L. (2004) The ABCs of Mutual Funds: On the In-troduction of Multiple Share Classes. Working Paper, University of Michigan,Ann Arbor, MI.
[14] Ivković, Z. and Weisbenner, S. (2009) Individual Investor Mutual Fund Flows.
Journal of Financial Economics, 92, 223-237.
https://doi.org/10.1016/j.jfineco.2008.05.003
[15] Kim, M. (2019) Changes in Mutual Fund Flows and Managerial Incentives. Work-ing Paper.
[16] Ferreira, M.A., Keswani, A., Miguel, A.F. and Ramos, S.B. (2012) The Flow-Per- formance Relationship around the World. Journal of Banking and Finance, 36, 1759-1780.https://doi.org/10.1016/j.jbankfin.2012.01.019
[17] Ferreira, M., Massa, M. and Matos, P. (2018) Investor-Stock Decoupling in Mutual Funds. ManagementScience, 64, 1975-2471.
https://doi.org/10.1287/mnsc.2016.2681
[18] Berk, J.B. and Green, R.C. (2004) Mutual Fund Flows and Performance in Rational Markets. Journal of Political Economy, 112, 1269-1295.
https://doi.org/10.1086/424739
[19] James, C.M. and Karceski, J.J. (2002) Captured Money? Differences in the Perfor-mance Characteristics of Retail and Institutional Mutual Funds. Working Paper. https://doi.org/10.2139/ssrn.299730
[20] Mazur, M., Salganik-Shoshan, G. and Zagonov, M. (2017) Comparing Performance Sensitivity of Retail and Institutional Mutual Funds’ Investment Flows. Finance
Re-search Letters, 22,66-73.https://doi.org/10.1016/j.frl.2016.12.031
[21] Keswani, A. and Stolin, D. (2012) Investor Reaction to Mutual Fund Performance: Evidence from UK Distribution Channels. Journal of Financial Research, 35, 425-450.https://doi.org/10.1111/j.1475-6803.2012.01323.x
[22] Khorana, A., Servaes, H. and Tufano, P. (2005) Explaining the Size of the Mutual Fund Industry around the World. Journal of Financial Economics, 78, 145-185. https://doi.org/10.1016/j.jfineco.2004.08.006
[23] Khorana, A., Servaes, H. and Tufano, P. (2009) Mutual Fund Fees around the World. Reviewof Financial Studies, 22, 1279-1310.
https://doi.org/10.1093/rfs/hhn042
[24] Haslem, J.A., Baker, H.K. and Smith, D.M. (2008) Performance and Characteristics of Actively Managed Retail Mutual Funds with Diverse Expense Ratios. Financial
Services Review, 17, 49-68.https://doi.org/10.2139/ssrn.1128983
[25] Baker, K.H., Haslem, J.A. and Smith, D.M. (2009) Performance and Characteristics of Actively Managed Institutional Equity Mutual Funds. Journal of Investing, 18, 27-44.https://doi.org/10.3905/JOI.2009.18.1.027
[26] Glode, V., Hollifield, B., Kacperczyk, M. and Kogan, S. (2012) Time-Varying Pre-dictability in Mutual Fund Returns. Working Paper.
https://doi.org/10.2139/ssrn.1364351
[27] Investment Company Institute (2015) Mutual Fund Fact Book. ICI, Washington DC.
[28] European Fund and Asset Management Association (EFAMA) (2016) Asset Man-agement in Europe Annual Review, Facts and Figures.
[29] Carhart, M.M. (1997) On Persistence in Mutual Fund Performance. Journal of
Finance, 52, 57-82.https://doi.org/10.1111/j.1540-6261.1997.tb03808.x
DOI: 10.4236/tel.2019.97170 2730 Theoretical Economics Letters Mutual Fund Performance. Review of Finance, 17, 483-525.
https://doi.org/10.1093/rof/rfs013
[31] Klapper, L., Lusardi, A. and Van Oudheusden, P. (2015) Financial Literacy around the World. Standard and Poor’s Ratings Services Global Financial Literacy Survey. [32] Lusardi, A. and Mitchell, O.S. (2014) The Economic Importance of inancial
Litera-cy: Theory and Evidence. Journal of Economic Literature, American Economic
As-sociation, 52, 5-44.https://doi.org/10.1257/jel.52.1.5
[33] Lusardi, A. and Mitchelli, O.S. (2007) Financial Literacy and Retirement Prepared-ness: Evidence and Implications for Financial Education. Business Economics, 42, 35-44.
[34] Rooij, M.V., Lusardi, A. and Alessie, R. (2011) Financial Literacy and Stock Market Participation. Journal of Financial Economics, 101, 449-472.
DOI: 10.4236/tel.2019.97170 2731 Theoretical Economics Letters
Appendix 1. Variable Definitions
Variable Definition
Panel A: Fund characteristics
Raw return Fund return in local currency (percentage per quarter), calculated by adding back fund expense ratio to net raw return.
One-factor alpha
Net one-factor alpha (percentage per quarter) is estimated with three years of past monthly fund excess returns in local currency. We use local factors (fund domicile) for domestic funds, regional factors for regional funds, and world factors for global funds. Regional factors include Asia-Pacific, Europe, North America, and Emerging Markets, and the classification is based on the fund’s investment region using data on fund’s domicile country and fund’s geographic investment style provided by the Lipper database.
Four-factor alpha
Net four-factor alpha (percentage per quarter) is estimated with three years of past monthly fund excess returns in local currency. We use local factors (fund domicile) for domestic funds, regional factors for regional funds, and world factors for global funds. Regional factors include Asia-Pacific, Europe, North America, and Emerging Markets, and the classification is based on the fund´s investment region using data on fund’s domicile country and fund’s geographic investment style provided by the Lipper database. Size Total net assets in millions of U.S. dollars (Lipper).
Family size Family total net assets in millions of U.S. dollars of other equity funds in the same management company excluding the own fund TNA (Lipper).
Age Number of years since the fund launch date (Lipper).
Fees Total shareholder charges estimated as total expense ratio plus one-fifth of loads (Lipper).
Flows Percentage growth in TNA (in local currency) in a quarter, net of internal growth (assuming reinvestment of dividends and distributions).
SMB
Loadings on the small minus big size factor (SMB) from four-factor alpha regressions. For domestic funds, we use the domestic SMB from the domestic four-factor alpha regressions, for regional funds we use the regional SMB from the four-factor alpha calculated using the region specific factors, and for global funds we use the SMB from the four-factor alpha calculated using global factors.
HML
Loadings on the high minus low factor (HML) from four-factor alpha regressions. For domestic funds, we use the domestic HML from the domestic four-factor alpha regressions, for regional funds we use the regional HML from the four-factor alpha calculated using the region specific factors, and for global funds we use the HML from the four-factor alpha calculated using global factors.
Countries sold The number of countries where the fund is sold Panel B: Country characteristics
Internet Ratio between number of internet users and the population (World Development Indicators). Financial literacy Percentage of adults who are financially literate [31].
Financial sophistication Financial sophistication of retail investors in a country measured by the World Economic Forum in the annual Global Competitiveness Report using the question “The level of sophistication of financial markets is higher than international norms”.