accepted after revision January 19, 2010 Bibliography DOI http://dx.doi.org/ 10.1055/s-0030-1248286 Published online: March 18, 2010
Int J Sports Med 2010; 31: 421 – 427 © Georg Thieme Verlag KG Stuttgart · New York ISSN 0172-4622
Correspondence
Prof. Victor Machado Reis UTAD Sports Apartado 1013 5000 Vila Real Portugal Tel.: + 351 / 259 / 350877 Fax: + 351 / 259 / 330168 [email protected] Key words ● ▶ oxygen uptake ● ▶ swimming velocity ● ▶ regression error ● ▶ anaerobic energy
Examining the Accumulated Oxygen Defi cit Method in
Front Crawl Swimming
measure of ANAER [20] . A diff erent approach that can be used to assess ANAER is through the accu-mulated oxygen defi cit (AOD). This method also requires a number of physiological assumptions and an agreement between AOD and energy equivalent from blood lactate measurements was previously reported [19] . The AOD precision may be assessed for each individual and exercise con-dition, thus providing information on the accu-racy of the method. This methodology has been vastly applied in other sports, both in laboratory [6, 29] as well as in fi eld testing [9, 26] .
Few have reported the analysis of the AOD and the subsequent ANAER during Front crawl swim-ming [21, 22, 31 – 33, 35] , while others have pre-sented estimates on the anaerobic energy release during swimming using diff erent approaches [15, 34] . Ogita et al. [21] describe a maximum AOD of ≈ 38 ml · kg − 1 for supra maximal 2 – 3 min
bouts in the swimming fl ume. Silva et al. [31] were able to fi nd an ANAER of 15 % to the overall energy release during the 200 m freestyle event, a lower value than the estimates of Zamparo et al. [34] for the same distance. Thus, little informa-tion on the AOD and how this measure may be of
Introduction
▼
The determination of the energy cost of swim-ming (Cs) has been well reported since the sev-enties. Initially, researchers assessed the Cs solely by the contribution of aerobic processes, moni-toring VO 2 at sub maximal or even maximal
intensities [7] . The lack of attention given to the anaerobic contribution (ANAER) to overall energy demand can be justifi ed by diffi culties imposed in the assessment of anaerobic energy release. Some attempts have been made to overcome this gap, assessing the Cs with the combination of data from aerobic and anaerobic energy path-ways.
The most common procedure to assess anaerobic energy release is to use the values resulting from the transformation of net blood lactate concen-tration into O 2 equivalents [15, 18, 34] . This
method is based on a number of assumptions which are similar to that underlying other meth-ods that are used to understand human physiol-ogy during exercise (i. e. amount of muscle mass involved), although some have suggested that the lactate O 2 equivalent may not be a quantitative
Authors V. M. Reis 1,2 , D. A. Marinho 2,3 , F. B. Policarpo 2 , A. L. Carneiro 2 , C. Baldari 4 , A. J. Silva 1,2 Affi liations Affi liation addresses are listed at the end of the article
Abstract
▼
The present study investigated the Accumulated Oxygen Defi cit (AOD) method in front crawl swimming with the aims to assess the robustness of the oxygen uptake / swimming velocity regres-sion line and to quantify the preciregres-sion of the AOD. Twenty-nine male swimmers performed two swimming tests in diff erent days, with a 24 h recovery between tests: a graded test and an all-out test. The all-all-out test was performed either in 100 m (n = 11), 200 m (n = 13) or 400 m (n = 5). Through all testing expired gases were collected breath by breath and analysed with a K4b2 Gas Analyser (Cosmed, Rome, Italy) connected to
an AquaTrainer Valve (Cosmed, Rome, Italy). The error of oxygen uptake / swimming velocity regression lines was ≈ 4 – 5 ml · kg − 1 · min − 1 ) and
the regressions allowed an extrapolation of the energy cost to higher intensities with a standard error of prediction of ≈ 3 – 4 ml · kg − 1 · min − 1 .
How-ever, the data variability was considerable (95 % confi dence intervals of the linear extrapolation larger than 13 ml · kg − 1 · min − 1 ). The AOD
impre-cision varied among the three distance events from ≈ 3 – 13 ml · kg − 1 . These absolute errors are
small, considering the time that subjects took to cover the three distances, but relative to the AOD values that were estimated they can be consid-ered high, especially in the 400 m bout.
interest to assess anaerobic energy release during swimming is available.
Medb ø et al. [19] were the fi rst to present a detailed study on the precision of the AOD estimation for treadmill running. Others have subsequently assessed the robustness of the method by the precision of the supra maximal energy demand prediction error [29, 30] or by the precision of the AOD itself [26] . In cycling exer-cise, Russell et al. [29] showed that the inclusion of exercise intensities above the lactate threshold in the VO 2 / exercise
inten-sity regression line did not signifi cantly change the AOD but did improve the precision of the estimated supra maximal energy demand. In running, Reis et al. [25] reported that the inclusion of exercise intensities above the lactate threshold in the VO 2 / intensity regression does not improve the precision of the total energy demand and that of AOD in endurance-trained runners. Nevertheless, a tendency for an underestimation of the AOD and for a larger imprecision was found when exclusively sub thresh-old intensities were used. Taking into account these results, Reis et al. [25] suggested that the use of complete regressions (includ-ing a wide spectrum of exercise intensities) is more suitable to estimate the total energy demand and the AOD of endurance-trained subjects. However, to our knowledge, no study on the precision of the AOD estimation in swimming is available. The extent to which AOD may relate to swimming performance is still poorly understood. However, it is our opinion that prior to using such estimates when attempting to predict performance it is necessary to understand how precise the AOD estimation is and how much its precision varies among diff erent distance events. Therefore, the present study intended to investigate the AOD method in front crawl swimming.
The aims of the present study were: i) to assess the robustness of the oxygen uptake / swimming velocity regression line in front crawl swimming; ii) to assess the robustness of the linear extrap-olation of supra maximal oxygen demand from the oxygen uptake / swimming velocity regression line in front crawl swim-ming; iii) to quantify the precision of the AOD in supra maximal front crawl swimming.
We hypothesized that the oxygen uptake / swimming velocity regression line could present a precision that enables the calcu-lation of AOD with an error within the literature references for running or cycling ( ≈ 5 ml · kg − 1 ).
Methods
▼
Participants
Twenty-nine male swimmers volunteered after medical approval and gave informed consent to participate in the present study. The present study meets the ethical standards of the Interna-tional Journal of Sports Medicine [13] . All subjects were involved in systematic training and competition programs (from 9 – 12 weekly training sessions) and participated regularly in swim-ming front crawl events. A stadiometer with a range scale of 0.10 cm was used for the evaluation of height and a standard scale weighing machine was used to assess body mass. Skinfolds were taken with a skinfold caliper Slim Guide (Creative Health Products, USA) to estimate fat percentage as suggested by Faulkner protocol [11] . These measurements were performed during the fi rst day of the experimental tests, before the graded test. The mean ( ± 1 standard deviation) of their age, height, arm span, body mass and estimated fat percentage were 18.2 ± 2.6
years, 1.78 ± 0.06 m, 1.86 ± 0.06 m, 68.9 ± 11.6 kg and 10.3 ± 0.8 % , respectively. The swimmers ’ personal best performance at the time of the measurements in the 100 m, 200 m and 400 m in short length (25 m swimming pool) were 54.92 ± 4.17 s, 127.78 ± 16 86 s and 261.9 ± 10.4 s, respectively.
Procedures
During the fi ve days prior to the experiment the subjects were not engaged in high-intensity training sessions and limited their training program to a single daily low-intensity swimming ses-sion. The subjects performed two swimming tests on diff erent days, with a 24 h recovery between tests: a graded swimming test and an all-out test. Both tests were conducted in a 25 m swimming pool in the morning (between 10 a.m and 12 a.m.) at a room temperature of 25 – 28 degrees Celsius and with a humid-ity of 50 – 60 % .
Graded and intermittent test
The fi rst test included several exercise bouts. During this test the swimming speed of the subjects was kept constant by an elec-tronic pacer, with successive fl ashing lights, placed at the bot-tom of the pool (TAR. 1.1, GBK-electronics, Aveiro, Portugal). The subjects were instructed to follow the pacer light signal. Dis-tance of the two fi rst bouts was 350 m, and 400 m from the third bout on. Initial velocity was established according to the swim-mers ’ individual performance in the 400 m freestyle minus 5 increments of velocity. The increments were 10 % of the 400 m best performance velocity per each 400 m stage until exhaus-tion. No warm-up was performed before the start of the test and recovery between successive bouts was individualized. The sub-jects started each bout when their VO 2 presented two consecu-tive values within 2 ml · kg − 1 · min − 1 from that recorded before
the start of the fi rst bout (average VO 2 during the 2 nd min prior
to the start of the fi rst bout of the graded test). The test was started with the subjects inside the pool (after the signal the subjects pushed-off the wall with their feet and started to swim). Every 25 m the turn-over was performed with a body rotation to the side of the lateral wall, without diving, subsequent feet push-off from the wall and reduced gliding. The graded test ended by subject ’ s voluntary exhaustion or until they could no longer swim at the predetermined pace. Immediately after the conclu-sion of each bout, capillary blood samples were collected from the fi nger to determine the blood lactate concentration.
All-out test
The second test consisted of an out swimming test. The all-out test was performed at one of the three distances: 100 m (n = 11), 200 m (n = 13) or 400 m (n = 5). Subjects were assigned to each distance according to their best competitive performance and were asked to swim as if they were in a timed competition race.
Subjects were allowed to perform their regular competition warm-up procedures. However, the test was not started until the subjects ’ VO 2 returned to resting values (the same individual
value recorded for each subject before the start of the graded test). Each subject performed the test individually. The start of the test and each turn-over were performed as described in the graded test. In addition, capillary blood sample collections were made every 2 min post-race until blood lactate (BL) concentra-tion levelled off .
Data collection
Through all testing expired gases were collected breath by breath and analysed with a K4b2 Gas Analyser (Cosmed, Rome, Italy) connected to an AquaTrainer Valve (Cosmed, Rome, Italy). VO 2
was averaged for 20 s intervals. Before each test, a reference air calibration of the device was performed using a gas sample with a 16 % O 2 concentration and a 5 % CO 2 concentration. The fl ow meter was also calibrated before each testing with a 3 000 ml syringe. Whole blood lactate concentration was measured with an Accusport device (Boehringer, Mannheim, Germany). Despite the accuracy previously demonstrated by this equipment [1] , before each test a calibration of the Accusport was performed with several YSI 1 530 Standard Lactate Solutions (2, 4, 8 and 16 mmol · L − 1 ).
The graded test was performed to obtain VO 2 / velocity relation
dots that enabled the calculation of a valid linear regression equation. Although it has been suggested that, theoretically, this relationship should include the cube swimming velocity, data available in the literature clearly shows that the former proce-dure is less accurate when compared with the linear regression procedure [2] . Peak VO 2 was the highest 20 s average VO 2 value
observed in each subject either in the graded or in the all-out tests. Swimming velocity associated with peak VO 2 was
esti-mated from the inclusion of the peak VO 2 of each subject in the individual VO 2 / velocity regression equation. The VO 2 / velocity regression was developed for each subject using the steady-state VO 2 values during the last min of each exercise bout in the
graded test. Bouts that failed to comply with the VO 2
steady-state attainment (given by a diff erence below 2 ml · kg − 1 · min − 1
between two consecutive minutes) were not included in the regressions. An individual resting VO 2 measurement (zero speed VO 2 ) was also included in the regressions. Oxygen uptake meas-urements from incomplete bouts (less than 400 m) were not included in the regression.
The Cs was determined from the slope of the VO 2 / velocity
regres-sion line. Accumulation of blood lactate in the graded test was traced by linear interpolation to determine the swimming veloc-ity corresponding to the 4 mmol · L − 1 threshold.
The accumulated oxygen defi cit (AOD) was calculated as the dif-ference between total energy demand (ED) and accumulated VO 2 (VO 2 Ac) during the all-out tests. This estimation was not
corrected for body oxygen stores. Total energy demand (TED) was calculated by linear extrapolation and VO 2 Ac was the inte-gration of VO 2 during the all-out test over the time, as given by Equation (1). VO Ac2 =
∫
VO dt⋅ t t 2 1 2 (1) The imprecision of the AOD (AOD error ) was calculated as follows[26] :
AOD error = √ (error for total ED 2 + error for VO
2 Ac 2 ) (2)
where
error for total ED = error for ED . duration (3) and
error for VO 2 Ac = error for VO 2 . duration (4)
The error for ED is given by the standard error of the predicted value for the energy demand. The error for VO 2 was assumed to be 3 % [27] .
Statistical analysis
Data was analysed with SPSS 14.0. (SPSS Science, Chicago, USA). Normality assumption was verifi ed with the Shapiro-Wilk test
for all variables. The results are presented as means ± one stand-ard deviation (SD). Linear regression was used on all appropriate data. The scatter around the regression line (S y · x ) was used to assess the robustness of the regression lines. The standard error of the predicted value (SEP) was used to assess the robustness of the linear extrapolation of the energy cost of swimming. Diff er-ences between groups of subjects were assessed with one way ANOVA and Scheff e post-hoc, after normality assumption was verifi ed. Simple bivariate correlations between variables were investigated with the Pearson product-moment coeffi cient, tak-ing values from the overall sample. The statistical signifi cance was set to p ≤ 0.05.
Results
▼
All subjects completed four sub maximal bouts with a duration comprised between 5 min and 6 min 30 s, where VO 2 achieved a
steady-state. The fi rst three bouts were performed at an inten-sity below the 4 mmol · L − 1 lactate threshold and the fourth bout
above this threshold. ● ▶ Fig. 1 shows a typical VO 2 on-kinetics
pattern for one subject in the four sub maximal bouts and ● ▶ Fig. 2 depicts the regression lines from steady-state VO 2 and
swim-ming velocity in the three groups of subjects. Some subjects were engaged in a fi fth bout to attain voluntary exhaustion, but all these failed to conclude the full bout. Mean ( ± SD) values for blood lactate and relative intensity expressed as peak VO 2
per-centage were, respectively, in the four sub maximal bouts: 2.26 ± 0.87 mmol · L − 1 and 53.54 ± 9.30 % ; 2.32 ± 0.92 mmol · L − 1
and 60.29 ± 7.43 % ; 2.85 ± 1.24 mmol · L − 1 and 75.68 ± 8.47 % ;
5.63 ± 3.06 mmol · L − 1 and 88.75 ± 10.24 % .
Peak VO 2 was 59.46 ± 7.00 ml · kg − 1 · min − 1 in the overall sample,
with diff erent mean values [F (2; 6.172) = 930.627; p = 0.006] between the 200 m swimmers ´ group (63.79 ± 5.44 ml · kg − 1 · min − 1 )
and the 100 m group (55.82 ± 7.35 ml · kg − 1 · min − 1 ). In the 400 m
group peak VO 2 was 56.23 ± 2.95 ml · kg − 1 · min − 1 . Energy cost of
swimming was 0.583 ± 0.06 ml · kg − 1 · m − 1 , 0.675 ± 0.06 ml · kg − 1 ·
m − 1 and 0.574 ± 0.04 ml · kg − 1 · m − 1 , respectively, in the 100 m,
200 m and 400 m groups (non-signifi cant diff erences).
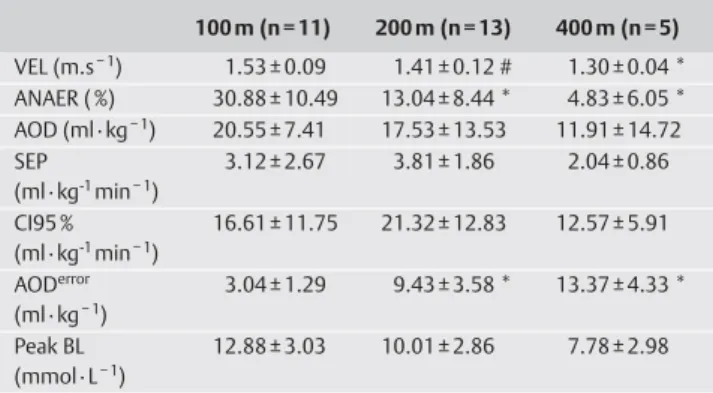
● ▶ Table 1 presents measurements and calculations in the three
all-out bouts that were performed.
Time (s) 0 60 120 180 240 300 360 420 480 540 VO 2 (ml.kg -1.min -1) 0 10 20 30 40 50 60 0.78 m.s-1 0.93 m.s-1 1.10 m.s-1 1.24 m.s-1
Fig. 1 VO 2 on-kinetics pattern for one subject in the four sub maximal
bouts.
Swimming velocity correlated with Peak BL (r = 0.68, p < 0.01) and with ANAER (r = 0.49, p < 0.01). Peak BL correlated also with ANAER (r = 0.69, p < 0.01). Additionally, ANAER was inversely correlated with Peak VO 2 (r = − 0.45, p < 0.05) and with AOD error
(r = − 0.71, p < 0.01). The AOD correlated only with energy cost of swimming (r = 0.45, p < 0.05).
Discussion
▼
The present study intended to investigate the AOD method in front crawl swimming. The main fi ndings of the present study were that the robustness of oxygen uptake / swimming velocity regression lines was acceptable (with standard errors of ≈ 4 – 5 ml · kg − 1 · min − 1 ) The AOD absolute errors were small but
relative to the AOD values that were estimated they can be viewed as high (especially in the 400 m bout).
The use of the VO 2 / exercise intensity regression to estimate the
Cs is present in the literature [3, 14, 21] , although providing little information about the VO 2 on-kinetics of the subjects that were
assessed. Nevertheless, others have conducted pilot studies on the VO 2 kinetics during front crawl swimming [17, 28] .
More-over, the time to attain VO 2 steady-state has been shown to be lower in subjects with high aerobic ability [10] . The main assumption to use the VO 2 / exercise intensity regression line to
estimate the Cs is the establishment of steady-state sub maximal VO 2 at several exercise intensities. Thus, the sub maximal
exer-cise bouts must have a duration that enables the VO 2 to attain a steady state. In the present study, all subjects completed four full sub maximal bouts with a duration comprised between 5 min and 6 min 30 s, where VO 2 achieved a steady-state (see ● ▶ Fig. 1 ).
In the fi rst two bouts VO 2 attained a steady-state within the fi rst
3 min of exercise, while in the third bout it took approximately 3 min 30 s to attain such status. These three bouts were per-formed at an intensity below 75 % of subjects ’ peak VO 2 and with a blood lactate less than 3 mmol · L − 1 . In the fourth bout, which
was performed at a relative intensity of 88.75 ± 10.24 % peak VO 2
(5.63 ± 3.06 mmol · L − 1 for BL), the VO
2 on-kinetics presented a
diff erent pattern. It was possible to observe in most of the sub-jects an apparent VO 2 steady-state (given by a variation less than 2 ml · kg − 1 · min − 1 ) in the last min of exercise. However, the fact
that VO 2 mean values over the last minute of exercise were more than 300 ml · min − 1 higher than the value recorded at the 3 rd min,
it is possible that a true slow component was present [23] and that VO 2 could still have risen more if the exercise bout had been
prolonged. Others have also found similar VO 2 slow component mean values in competitive swimmers [8, 12] .
The regression lines obtained from mean VO 2 and swimming velocity during the sub maximal bouts in the graded test (see ● ▶ Fig. 2 ) revealed a higher slope for the 200 m group and a
lower slope in the 100 m group. Consequently, the mean Cs var-ied (non-signifi cantly) from 0.574 ± 0.04 ml · kg − 1 · m − 1 (100 m
group) to 0.675 ± 0.06 ml · kg − 1 · m − 1 (200 m), with an
intermedi-ate mean value in the 400 m group (0.583 ± 0.06 ml · kg − 1 · m − 1 ).
Since the peak VO 2 of the subjects included in the 200 m group
was higher when compared with the remaining subjects , these diff erences may partly explain the higher Cs observed in the 200 m group. These mean values are consistent with the obser-vations by Reis et al. [24] and that by Barbosa et al. [4] on similar subject cohort.
The linearity of the scatter was high in the three groups of subjects and the standard error of estimate varied little ( ≈ 4 – 5 ml · kg − 1 · min − 1 ). We could not fi nd in the literature
stud-ies with a similar subject cohort that provided information on this type of regression robustness during front crawl swimming. Our criticism regarding the lack of data on the sub maximal VO 2 on-kinetics in the literature is also applicable here. The use of mathematical models to explain physiological responses war-rants a clear identifi cation of the precision of those models. In the present case, energy cost is estimated and not measured, therefore requiring proper presentation of its robustness. The error of our regressions was ≈ 4 – 5 ml · kg − 1 · min − 1 , which is above
our previous observations in running [25, 26] .
When the individual regression lines were used to extrapolate the energy demand in the all-out bouts, we found no diff erences between the three swimming distances and the standard errors of prediction were ≈ 3 – 4 ml · kg − 1 · min − 1 . In our opinion this
pre-cision can be considered acceptable, since the mean energy demand for the all-out bouts was 58.03 ± 8.66 ml · kg − 1 · m − 1 ,
which gives us a relative error of prediction of ≈ 6 % . However, in running and cycling exercise, others have reported lower errors of the predicted value [25, 30] .
It has also been suggested that the combined use of both sub and supra 4 mmol · L − 1 lactate threshold exercise intensities may
Velocity (m.s-1) 0 10 20 30 40 50 60 0.0 0.2 0.4 0.6 0.8 1.0 1.2 1.4 70 100-m 200-m 400-m 100-m R2 = 0.98 Sy.x = 4.30 Y = 31.14x + 4.30 200-m R2 = 0.98 Sy.x = 5.29 Y = 40.59x + 3.13 400-m R2 = 0.97 Sy.x = 4.13 Y = 34.43x + 3.83 VO 2 (ml.kg -1.min -1)
Fig. 2 Regression lines (VO 2 as function of swimming velocity) in the
three groups of subjects (mean values recorded for each group in the graded test. N = 11 for 100-m; n = 13 for 200-m; n = 5 for 400-m. Table 1 Measurements and calculations in the three all-out bouts (means ± SD). 100 m (n = 11) 200 m (n = 13) 400 m (n = 5) VEL (m.s − 1 ) 1.53 ± 0.09 1.41 ± 0.12 # 1.30 ± 0.04 * ANAER ( % ) 30.88 ± 10.49 13.04 ± 8.44 * 4.83 ± 6.05 * AOD (ml · kg − 1 ) 20.55 ± 7.41 17.53 ± 13.53 11.91 ± 14.72 SEP (ml · kg - 1 min − 1 ) 3.12 ± 2.67 3.81 ± 1.86 2.04 ± 0.86 CI95 % (ml · kg - 1 min − 1 ) 16.61 ± 11.75 21.32 ± 12.83 12.57 ± 5.91 AOD error (ml · kg − 1 ) 3.04 ± 1.29 9.43 ± 3.58 * 13.37 ± 4.33 * Peak BL (mmol · L − 1 ) 12.88 ± 3.03 10.01 ± 2.86 7.78 ± 2.98
VEL = average swimming velocity; ANAER = anaerobic fraction of energy release; AOD = accumulated oxygen defi cit; SEP = standard error of the predicted energy cost; CI95 % = 95 % confi dence interval of the predicted energy cost; AOD error = estimation error of AOD; Peak BL = peak blood lactate post-exercise
* = Diff erent from 100-m (p < 0.01); # = diff erent from 100-m (p < 0.05)
aff ect the model precision and or validity [5] . An absence of such phenomenon with endurance-trained runners during treadmill exercise has been described [25] . The alleged sensitivity of the model to exercise intensity could be explained by the fact that including high exercise intensities (above the anaerobic thresh-old) creates more deviations from linearity. Since we observed the appearance of a VO 2 slow component in the last bout of the grade test and a less evident VO 2 steady-state, we re-calculated
our regression with exclusion of data from that last bout. We found that the linearity of the model did not change and that standard error of the regression as well as the standard error of the predicted value increased slightly ( ≈ 5 % and ≈ 3 % increases, respectively). However the 95 % confi dence intervals of the pre-dicted value increased four-fold, which clearly lowers the robust-ness of the model when it comes to extrapolation beyond the exercise intensities included in the graded test. Consequently, also the error in AOD estimation would tend to increase with this procedure (especially in the 100 m distance with a two-fold increase). These results indicate that the inclusion of higher intensities in the regression line is necessary to improve the pre-cision of the model when extrapolations are to be made into supra maximal exercise intensities.
It has been suggested that an underestimation in the energy cost could be a result of an underestimation of the steady-state VO 2 at high sub maximal exercise intensities, due to the interference of the O 2 slow component [5] . However, in the present study, the slope of the regression lines without the 4 th bout of exercise
lowered the energy cost of swimming by ≈ 7 % . If an underesti-mation of the true energy cost during the 4 th bout due to a
pos-sible underestimation in steady-state VO 2 was present in our
subjects, the opposite tendency was to be expected. Therefore, we decided to maintain all sub maximal VO 2 measurements in the regression lines.
The accumulated oxygen defi cit (AOD) has been vastly used to quantify anaerobic energy release during exercise in diff erent physical activities, especially in running [6, 9, 26] but is rarely used in swimming [21] . In the present study we found AOD mean values of 20.55 ± 7.41 ml · kg − 1 , 17.53 ± 13.53 ml · kg − 1 and
11.91 ± 14.72 ml · kg − 1 , respectively, in the 100 m, 200 m and
400 m all-out bouts. These values are much lower than those by Ogita et al. [21] for supra maximal 2 – 3 min bouts in the swim-ming fl ume.
The anaerobic fractions of energy release (ANAER) in the present study were ≈ 31 % in the 100 m bout, ≈ 13 % in the 200 m bout and ≈ 5 % in the 400 m bout. Despite the few studies on the AOD dur-ing pool swimmdur-ing [32] , other approaches have been used to quantify ANAER in real or simulated competitions performed by swimmers. Estimations from post-exercise BL, together with assumptions for alactic energy as well as for aerobic energy release, have indicated higher values than those in the present study for the same distance events: 14 – 18 % in 400 m [15, 34] ; 29 % in 200 m [34] and 51 % in 100 m [34] . Since the subjects in the study by Zamparo et al. [34] were younger than those in the present study and were tested in the early preparation phase of the season, while our subjects were tested after a competitive season, it is not likely that diff erences in the development of anaerobic ability explain the smaller ANAER in the present study. Thus, diff erences in the method that was used to calculate ANAER are more likely to explain the discrepancies. Calculating the ANAER from AOD assessment, Troup [32, 33] also found higher estimations for pool swimming (55 % in 100 m and 35 % in 200 m) and for fl ume swimming (55 % in 100 m and 39 % in
200 m). The higher competitive level of the subjects that were tested by Troup [32, 33] may help to explain the larger ANAER. The post-exercise peak BL in the present study presented a small variation between the three all-out exercise bouts (see ● ▶ Table 1 ). Our mean values are lower than those reported in
the literature for trained swimmers performing the same dis-tances, especially in the 200- and 400 m events [15, 16] . This may be explained by the diff erent athletic ability of the subjects. We tested young national-level competitive swimmers while those reports in the literature have assessed high-performance subjects. Another factor that may have contributed to the dis-crepancies is the fact that the swimmers in the present study used a valve attached to a gas analyzer. The apparatus clearly lowers the average swimming speed of the subjects during the bouts, as compared to free-swimming, and this may result in a lower anaerobic energy demand. Since AOD and lactate both refl ect the anaerobic pathway, it is possible that in those studies with high performance subjects swimming in a free condition, larger true values of AOD were present. Indeed, in the present study both peak BL and ANAER correlated positively with swim-ming velocity during the all-out test (r = 0.68, p < 0.01 and r = 0.49, p < 0.01, respectively). On the other hand, peak BL and ANAER were also correlated (r = 0.69, p < 0.01). Surprisingly, the AOD did not correlate with peak BL. These results suggest that although AOD and peak BL may both refl ect anaerobic pathways of energy release, they do not necessarily represent the same time-course response of human physiology during high-intensity exercise. The fact that AOD is calculated based on measurements during exercise and BL is measured post-exercise may contribute to a possible mismatch between these two. During supra maximal running it has been demonstrated that AOD attains a maximal value between 2 – 3 min of treadmill exhaustive exercise [19] . Our data seem to indicate that front crawl swimming is much diff erent, since a signifi cantly lower AOD was observed in the 200 m and 400 m distances, when compared with the 100 m dis-tance (see ● ▶ Table 1 ). The largest AOD mean value observed in
the short-distance (20.55 ± 7.41 ml · kg − 1) is probably not the
subjects maximal AOD. In the future it may be interesting to assess the swimmers ’ response during a 50 m all out bout to con-fi rm if AOD is larger than our observations in the 100 m. Anyway, in our opinion the nature of swimming itself (liquid environ-ment and low frequency of moveenviron-ment, as compared with all-out running) may prevent maximal AOD appearing during this type of activity. Therefore, an assessment of swimmers AOD during high-intensity running or cycling may also be an interesting issue. The AOD variability was high, especially in the 400 m bout. The larger variability observed in the longer distance refl ects a time-eff ect. Since the AOD is an amount of energy and not a rate of energy production, it is natural that the longer the exercise bout lasts the larger are the chances that intindividual diff er-ences in AOD are increased.
Due to the uneven amount of subjects in the three groups as well as the smaller size of the 400 m group, our results may present some bias. In the case of the 400 m ANAER estimations, another issue helps to explain the large variability. Due to a mean swim-ming velocity that, for some subjects, is below their peak VO 2 velocity, these subjects are able to swim the 400 m distance without presenting AOD. This phenomenon illustrates the dependency of AOD (thus ANAER as calculated in the present study) on the VO 2 kinetics during exercise. Indeed, due to the
longer duration of the 400 m bout, chances are that the swim-mers attain peak VO 2 (or near-to-peak VO 2) values, thereby
increasing the mean VO 2 during the bout to a value above the predicted energy requirements. On the other hand, the mechan-ical constraints imposed by the Aquatrainer, also tend to lower the average velocity during the bout, thereby lowering the pre-dicted energy demand. In fact, we found that AOD was negative in some subjects, where the mean VO 2 during the bout was above the predicted energy requirement. Therefore, the data obtained from the 400 m event should be interpreted with cau-tion and serve merely as an example of a possible limitacau-tion to assess AOD over this distance.
In the present study, the error of AOD estimation was signifi -cantly larger (see ● ▶ Table 1 ) in the 200 m (9.43 ± 3.58 ml · kg − 1 )
and in the 400 m (13.37 ± 4.33 ml · kg − 1 ) bouts, when compared
with that calculated for the 100 m bout (3.04 ± 1.29 ml · kg − 1 ).
Moreover, considering the AOD values that were assessed in the three distances, the relative error is much smaller for the 100 m event. Relative to the AOD values that were estimated these errors can be viewed as high (especially in the 400 m bout). In the literature, we have not found a single reference to the AOD error in swimming. Therefore, we were only able to refer to pre-vious references regarding other types of exercise (i. e. running), which are typically ≈ 4 – 5 ml · kg − 1 [19, 25] .
In conclusion, the oxygen uptake / swimming velocity regression lines allowed an extrapolation of the Cs to higher intensities with a high precision (standard errors of prediction of ≈ 3 – 4 ml ·
kg − 1 · min − 1). The absolute AOD error in the all-out bouts
increased concomitantly with the distance and, since the abso-lute AOD values followed an inverse tendency, the relative error for AOD estimation was much lower in the 100 m event. Affi liations
1 Department of Sport Sciences, Exercise and Health, University of
Tr á s-os-Montes and Alto Douro, Vila Real, Portugal
2 Research Centre in Sport, Health and Human Development, Vila Real,
Portugal
3 Department of Sport Sciences, University of Beira Interior, Covilh ã , Portugal
4 IUSM, University of Rome, Rome, Italy
References
1 Baldari C , Bonavolont à V , Emerenziani GP , Gallotta MC , Silva AJ , Guidetti L . Accuracy, reliability, linearity of Accutrend and Lactate Pro versus EBIO plus analyzer . Eur J Appl Physiol 2009 ; 107 : 105 – 111
2 Barbosa TM , Bragada JA , Reis VM , Marinho DA , Carvalho C , Silva AJ . Energetics and biomechanics as determining factors of swimming performance: Updating the state of the art . J Sci Med Sport 2009 ; 29 , [Epub ahead of print]
3 Barbosa TM , Fernandes R , Keskinen KL , Cola ç o P , Cardoso C , Silva J , Vilas-Boas JP . Evaluation of the energy expenditure in competitive swimming strokes . Int J Sports Med 2006 ; 27 : 894 – 899
4 Barbosa TM , Fernandes R , Keskinen KL , Vilas-Boas JP . The infl uence of
stroke mechanics into energy cost of elite swimmers . Eur J Appl
Physiol 2008 ; 103 : 139 – 149
5 Bearden S , Moff at R . Leg electromyography and the VO 2 -power
rela-tionship during bicycle ergometry . Med Sci Sport Exerc 2001 ; 33 : 1241 – 1245
6 Bickham D , Le Rossignol P , Gibbons C , Russell AP . Re-assessing accumu-lated oxygen defi cit in middle-distance runners . J Sci Med Sport 2001 ; 5 : 336 – 340
7 Costill D , Kovaleski J , Porter D , Kirwan J , Fielding R , King D . Energy expenditure during front crawl swimming: predicting success in mid-dle-distance events . Int J Sports Med 1985 ; 6 : 266 – 270
8 Demarie S , Sardella F , Billat V , Magini W , Faina M . The VO 2 slow
com-ponent in swimming . Eur J Appl Physiol 2001 ; 84 : 95 – 99
9 Duffi eld R , Dawson B , Goodman C . Energy system contribution to
100-m and 200-100-m track running events . J Sci Med Sport 2004 ; 7 : 302 – 313
10 Edwards A , Chalis N , Chapman J , Claxton D , Fysh M . VO 2 kinetics
deter-mined by PRBS Techniques diff erentiate elite endurance runners from elite sprinters . Int J Sports Med 1999 ; 20 : 1 – 6
11 Faulkner JA . New perspectives in training for maximum performance . J Am Med Assoc 1968 ; 205 : 741 – 746
12 Fernandes RJ , Keskinen KL , Cola ç o P , Querido AJ , Machado LJ , Morais PA ,
Novais DQ , Marinho DA , Vilas-Boas JP . Time limit at VO 2max velocity in
elite crawl swimmers . Int J Sports Med 2008 ; 29 : 145 – 150 13 Harriss DJ , Atkinson G . International Journal of Sports Medicine –
Eth-ical Standards in Sport and Exercise Science Research . Int J Sports Med 2009 ; 30 : 701 – 702
14 Kjendlie PL , Ingjer F , Madsen Ø , Stallman RK , Stray-Gundersen J . Diff er-ences in the energy cost between children and adults during front crawl swimming . Eur J Appl Physiol 2004 ; 91 : 473 – 480
15 Laffi te LP , Vilas-Boas JP , Demarle A , Silva J , Billat V . Changes in physi-ological and stroke parameters during a maximal 400-m free swim-ming test in elite swimmers . Can J Appl Physiol 2004 ; 29 : S17 – S31 16 Lindh AM , Peyrebrune MC , Ingham SA , Bailey DM , Folland JP . Sodium
bicarbonate improves swimming performance . Int J Sports Med 2008 ; 29 : 519 – 523
17 Machado L , Querido A , Keskinen KL , Fernandes R , Vilas-Boas JP . Math-ematical modeling of the slow component of oxygen uptake kinetics in front crawl . In: Vilas-Boas JP, Alves F, Marques A (eds). Book of Abstracts of the Xth Biomechanics and Medicine in Swimming. Port J Sport Sci 2006 ; 6 (Supl. 1) : 144 – 146
18 Margaria R , Cerretelli P , di Prampero P , Massari C , Torelli G . Kinetics and mechanics of oxygen debt contraction in man . J Appl Physiol 1963 ; 18 : 277 – 371
19 Medb ø J , Mohn A , Tabata I , Bahr R , Vaage O , Sejersted O . Anaerobic capacity determined by maximal accumulated O2 defi cit . J Appl Physiol 2008 ; 64 : 50 – 60
20 Medb ø JI , Toska K . Lactate release, concentration in blood, and appar-ent distribution volume after bicycling exercise . Jap J Physiol 2001 ; 51 : 303 – 312
21 Ogita F , Onodera T , Tabata I . Eff ect of hand paddles on anaerobic energy release during supramaximal swimming . Med Sci Sports Exerc 1999 ; 31 : 729 – 735
22 Ogita F , Tabata I . Aerobic and anaerobic energy release during
supramaximal swimming at diff erent levels of hypobaric hypoxia .
Med Sci Sports Exerc 2000 ; 32 : S336
23 Reis VM , Guidetti L , Duarte JA , Ascens ã o A , Silva AJ , Sampaio JE , Russell
AP , Baldari C . Slow component of VO 2 during level and uphill treadmill
running: relationship to aerobic fi tness in endurance runners . J Sports Med Phys Fitness 2007 ; 47 : 135 – 140
24 Reis V , Silva AJ , Reis A , Garrido N , Moreira A , Carneiro A , Marinho D , Neto S . Assessment of sub maximal and supra maximal swimming energy cost in crawl and breaststroke swimmers . In: Vilas-Boas JP, Alves F, Marques A (eds). Book of Abstracts of the Xth Biomechanics and Medicine in Swimming. Port J Sport Sci 2006 ; 6 (Supl. 1) : 55 – 56 25 Reis VM , Silva AJ , Ascens ã o A , Duarte JA . Inclusion of exercise
intensi-ties above the lactate threshold in O2/running speed regression does not improve the precision of accumulated oxygen defi cit estimation in endurance-trained runners . J Sports Sci Med 2005 ; 4 : 455 – 462 26 Reis VM , Duarte JA , Esp í rito-Santo J , Russell AP . Determination of
accu-mulated oxygen defi cit during a 400 m run . J Exerc Physiol 2004 ; 7 : 77 – 83
27 Robergs RA , Burnett AF . Methods used to process data from indirect
calorimetry and their application to VO 2 max . J Exerc Physiol 2003 ; 6 :
44 – 57
28 Rodr í guez F , Keskinen K , Keskinen O , Malvela M . Oxygen uptake kinet-ics during free swimming: a pilot study . In: Chatard JC. (ed).
Biome-chanics and Medicine in Swimming IX; 2002. University Press,
Saint- É tienne , 379 – 390
29 Russell AP , Rossignol P , Snow R , Lo S . Cycling at 120 when compared to 80 rev/min increases the accumulated oxygen defi cit but does not aff ect the precision of its calculation . J Exerc Physiol 2002 ; 5 : 32 – 38 30 Russell AP , Rossignol P , Lo S . The precision of estimating the total energy demand: implications for the determination of the accumu-lated oxygen defi cit . J Exerc Physiol 2000 ; 3 : 55 – 63
31 Silva A , Reis VM , Reis A , Garrido N , Moreira A , Carneiro A , Alves F . Associations between energy release and performance in a supramax-imal eff ort of 200 m in crawl . In: Vilas-Boas JP, Alves F, Marques A (eds). Book of Abstracts of the Xth Biomechanics and Medicine in Swimming. Port J Sport Sci 2006 ; 6 (Supl. 1) : 59 – 60
32 Troup J . Aerobic characteristics of the four competitive strokes . In: Troup J (ed). International Center for Aquatic Research Annual . Studies by the International Center for Aquatic Research (1990 – 1991) .
Colo-rado Springs, US Swimming Press ; 1991 a ; 3 – 7
33 Troup J . Measurement of swimming anaerobic capacity . In: Troup J (ed). International Center for Aquatic Research Annual. Studies by the
International Center for Aquatic Research (1990 – 1991) . Colorado
Springs, US Swimming Press ; 1991 b ; 9 – 16
34 Zamparo P , Capelli C , Cautero M , Di Nino A . Energy cost of front crawl swimming at supra-maximal speeds and underwater torque in young swimmers . Eur J Appl Physiol 2000 ; 83 : 487 – 491
35 Zoeller , Nagle E , Robertson R , Moyna N , MLephart S , Goss F . Peak blood lactate and accumulated oxygen defi cit as indicies of freestyle
swim-ming performance in trained adult female swimmers . Journal of
Swimming Research 2000 ; 14 : 18 – 25