Master in Finance
Master`s final work
Equity Research-Portucel
PAULO RICARDO OLIVEIRA DE MATOS
II (This page was intentionally left in blank)
III Author: Paulo Ricardo Oliveira de Matos
IV
Acknowledgements
The present work proved a challenge on itself, and an excellent opportunity to apply in real world company all that I have learned in my academic path. And reaching this point was only possible due to family and friends that were next to me in the good and bad moments. And for that I am grateful for all of them.
To my parents Francisco and Cecilia, words cannot make justice to my sincere thanks for all the sacrifices that were made by them and patience with me. Not only on this particular moment but throughout my life. If it weren`t for them this work would never be possible.
My girlfriend Joana, for all the support and infinite patient, thanks for always being present and all the help.
I also would like to thanks my tutor Professor Carlos Bastardo that was always available to help.
V
Resumo
A avaliação de empresas é uma arte baseada em formulas matematicas mas sem a precisão final que as ciencias matematicas nos acostumaram, no entanto é crucial para para tomar decisões de investimento e proporcionar criação de valor.
Neste trabalho vai ser avaliada a maior empresa de produção de papal e pasta de papel de Portugal, a Portucel, com o objectivo final de alcançar um preço alvo para as suas acções.
No capitulo um será revista a literatura dominande para o tópico de avaliação de empresas vendo os prós e contras de cada modelo e os dados necessarios para a implementação dos mesmos. Nos capitulos seguintes será apresentada a empresa, estudo do ambiente macroeconomico em que esta se insere e no final uma analise SWOT e de forças de Porter.
No capitulo final será descrito o metodo usado para avaliar a empresa e os resultados da avalição assim como os diversos pressupostos para a fazer serão discutidos.
VI
Abstract
The valuation of a company it's an art based on mathematical formulas without the precision that the Sciences of math demand, but it`s crucial to the decision of investing and the creation of value.
In this work it's going to be valuated the portuguese pulp and paper biggest company, Portucel, in order to reach a final target price for each share. Starts in chapter one with a broad review of literature on the subject of valuation, seeing the pros and cons of each one and the specific data requirement to elaborate them. This will be followed through the next chapters with a presentation of the company, the macroeconomic outlook and a SWOT and Porter`s Strengths analysis.
It also will be made a description of the methodology used to evaluate the firm and present the results and assumptions that were made during the process, ending with the final conclusions.
VII
Index
1-Introduction ... 1
2-Literature Review ... 2
2.1-Dicounted cash flow ... 3
2.1.1-Firm Valuation ... 3
2.1.2-Equity Valuation ... 4
2.1.3- Dividend discount model ... 6
2.1.4- Capital cash flow ... 7
2.1.5- Discounted economic profit (Discounted Economic Value Added) ... 8
2.1.6- Adjusted present value model (APV)... 9
2.2-Relative valuation ... 10
2.3-Contigeny claim valuation ... 12
2.4- Asset based valuation ... 12
2.4.1-Book value ... 13
2.4.2-Liquidation value ... 13
2.4.3-Replacement cost... 13
3-Presentation of Portucel ... 14
3.1-Stackholder structure ... 15
3.2-Dividend payout policy ... 16
3.3-Operational perform ... 16
3.4- Strategy ... 17
4-Macroeconomic framework ... 18
4.1-Energetic costs... 18
4.2- EUR/USD exchange rate ... 19
VIII 4.4-BEKP prices ... 20 4.5- Paper prices ... 20 5-Swot analysis ... 21 6- Porter strengths ... 22 7-Valuation ... 24 7.1- WACC ... 24 7.2- Sales ... 25
7.3- CAPEX and Net working capital ... 25
7.4-Valuation ... 26 7.5-Sensability analysis ... 27 7.6-Multiple analysis ... 27 8-Comparision...28 9-Conclusion ... 30 10-Bibliography ... 31 Appendix A- Figures ... 34 Appendix B- Tables ... 38
IX
Figures index
Figure I- Semapa stockholder structure………16
Figure II- Dividend of the last three years………34
Figure III- Capital employed turnover………..34
Figure IV- Fixed assets turnover………...35
Figure V-Total assets turnover………..35
Figure VI- Sales/Revenue per employee………...35
Figure VII- Real GDP growth rate………36
Figure VIII- Electric prices for industrial consumers………...36
Figure IX- EUR/USD exchange rate……….37
Figure X- Wood prices………..37
X
Table index
Table I- Portucel stockholder structure………...15
Table II- Portucel valuation………...26
Table III- Capex………...38
Table IV- Sensibility analysis………..38
XI
List of Abbreviations
ROIC- Return on invested capital g- Growth
DCF- Discounted cash flow FCF- Free cash flow
CF-Cash flow
FCFF- Free cash flow to the firm
WACC-Weighted average cost of capital D/E- Debt to equity ratio
OR-Operational results RR- Reinvestment rate
FCFE- Free cash flow to equity Re- Cost of equity
B- Beta Rf- Risk free Rd-Cost of debt
CCF- capital cash flow V-Enterprise value C-Net invested capital NPV- Discounted EVA EPS-Earnings per share
XII PEG- Price earnings growth ratio
UWF-Uncoated Wood free Printing and writing paper. BEKP- Bleach Eucalyptus Kraft Pulp
RAIZ- Institute of forestry and paper investigation CEPI- Confederation of European Paper Industries
1
1-Introduction
This work has the intention of valuating Portucel SA, a portuguese pulp and paper company traded in the Lisbon stock market PSI 20 with a current price of 3,22 as off 17 September 2014. The final objective is to apply a method of valuation and give a buy or sell recommendation.
The work is organized as following: literature review, firm presentation, macroeconomic outlook, SWOT and Porter strengths analysis and finally the valuation and conclusions.
In part one, the major models for valuating will be described. The research was based on the main authors about the theme in order to find the best valuation model to apply in Portucel valuation.
The second part will be used to characterize Portucel SA. The main focus goes to the stakeholder structure, the dividend payout policy the operational performance and the company`s strategy.
The third part will undertake a macroeconomic outlook of factors that may 1influence the company final price, such as energetic cost, the exchange rate, the wood price, the BEKP price and the paper prices on the market. The goal here is to find factors that may influence the value creation on the company.
The fourth and fifth parts are composed by a SWOT and Porter Strengths analysis in order to know better the market and industry in which the company dwells. The valuation of the company is made in the last chapter, explaining the methods and assumption to achieve the final value.
2
2-Literature Review
The process of valuation to reach a final value of a company it`s not a scientific process. Although there are multiple methods, these are not completely empirical and there is not one infallible on the final result. However, the risk of mislead final value can be minimize if the assumptions are constant over the work and knowing the limitation that existed during the valuation, especially when there is limited date available.
Before proceeding to a more technical review, let`s remember what are the value drivers for a company. As described by (Koller, Goedhart and Wessels, 2010) it can be resumed as a combination of return of invested capital (ROIC) with the global growth (g) of a company, being the ROIC more important. The bubble dot com in 2000 should be mentioned here, as the companies were creating value in the stock market with apparently no real accounting proof of that amazing performance. The investors were buying the future expectation of value, perspective defended by (Vélez-Pareja and Tham, 2001). The value is not found on the accounting statements, it comes from the future expectations investors have, and those come from the capacity of a company to create future cash flow, that could not happen.
The models most used in valuation according to (Damodaran, 2006) are: discounted cash flow (DCF), liquidation and accounting valuation, relative valuation and contingent claim valuation. The DCF models are subdivided in many variations.
3
2.1-Dicounted cash flow
This model it's based in a fundamental assumption of finance, the investor buys today so it can sells in the future and with that operation collect a profit. The essential steps to use this model are: calculate the free cash flow (FCF), forecast future accounting values for the company and compute the most adequate discount tax to achieve the present value of the cash flows (Jennergren 2011).
The calculation of these forecast are subjective, because what it's wanted is the exact value of the company and to be able to create a model that gives us the intrinsic1 value. That perfect value is unknown to us, we don’t know if the valuation that we make is correct or not.
The DCF is divided in different approaches that have the same logic behind but uses different types of Cash flow (CF) and discount rates. The models are: firm valuation, equity valuation, adjusted present value, discounted economic profit and capital cash flow. A particularity to take in count is if the CF is to equity or to the firm, we should use the appropriate discount rates. Also if they are in real or nominal value, the discount rates should reflect that.
2.1.1-Firm Valuation
This model valuates the company as a hole, the equity part and the debt part all together. In this case it`s crucial to be able to compute the Free cash flow to the firm (FCFF) based on the income statement. According to (Damodaran, 2012) the FCFF formula is:
(1) 𝐹𝐶𝐹𝐹 = 𝐹𝑟𝑒𝑒 𝐶𝑎𝑠ℎ 𝐹𝑙𝑜𝑤 𝑡𝑜 𝐸𝑞𝑢𝑖𝑡𝑦 + 𝐼𝑛𝑡𝑒𝑟𝑒𝑠𝑡 𝑒𝑥𝑝𝑒𝑛𝑠𝑒(1 − 𝑡𝑎𝑥 𝑟𝑎𝑡𝑒)
+ 𝑃𝑟𝑖𝑛𝑐𝑖𝑝𝑎𝑙 𝑟𝑒𝑝𝑎𝑦𝑚𝑒𝑛𝑡𝑠 − 𝑁𝑒𝑤 𝑑𝑒𝑏𝑡 𝑖𝑠𝑠𝑢𝑒𝑠 + 𝑃𝑟𝑒𝑓𝑒𝑟𝑟𝑒𝑑 𝑑𝑖𝑣𝑖𝑑𝑒𝑛𝑑 The FCFF is discounted using weighted average cost of capital (WACC). The use of this rate will allow us to incorporate the effect of debt in the cost of capital. For purposes of valuation it's assumed that the company as a stable Debt/equity (D/E) ratio,
4 so it's presumed that investors also demand the same rate of return during the valuation period. If a company tends to have a volatile D/E ratio it should be used a different model (Koller et al. 2010). Using the WACC discount rate, we are already using the tax shield that debt creates for a company reducing the amount taxes will cover, and creates a lower discount rate than if it would be all equity. If more debt means lower cost of capital then more debt is always a positive for company value.
However that’s is not true because companies have only the capacity to pay a certain amount, in interest to the debt holders, and if they realize that the company has difficulties in paying them back, they will demand a higher interest rate. Agency and bankruptcy costs will increase the global risk of the company resulting in and higher return rate the investor would require (Berk, DeMarzo, 2011).
Forecasting FCFF, knowing that they are dependent of operational returns, the expected growth should be then the reinvestment rate (RR) multiplying by the ROIC. In the terminal value is useful to use a perpetuity formula:
(2) 𝑇𝑒𝑟𝑚𝑖𝑛𝑎𝑙 𝑣𝑎𝑙𝑢𝑒 =𝐹𝐶𝐹𝐹 𝑜𝑓 𝑙𝑎𝑠𝑡 𝑓𝑜𝑟𝑒𝑐𝑎𝑠𝑡𝑒𝑑 𝑦𝑒𝑎𝑟 (𝑤𝑎𝑐𝑐 − 𝑔p)
gp=Grow rate in perpetuity.
The perpetuity growth rate must be equal or less than the economic growth rate, and the company must have at the time a stable grow, in particular the RR rate must be consistent with the g rate (Damodaran, 2002).
2.1.2-Equity Valuation
In equity valuation the Free cash flow to equity (FCFE) it's considered, as the operational outcome after the debt payments, and they can be interest or working capital needs. The ultimate goal is to calculate the profits a company can distribute for all its shareholders in the form of dividends (Damodaran, 2002).
5 It`s similar to dividend discount models, but with the difference that it is not only important looking for the dividends that were actually paid but also what could a company have paid. This implies that the company distributes all its earnings, and therefore the company growth depends solely on its operational earnings.
The FCFE growth will be the equity reinvestment rate times the equity returns. The discount rate to use on this case is the return on equity demanded by the equity holders. The most common way to calculate that is the CAPM (Capital Asset Pricing Model) equation:
(3) 𝑅e= 𝑅f+ 𝛽 ∗ (𝑅𝑖𝑠𝑘 𝑝𝑟𝑒𝑚𝑖𝑢𝑚)
Re= expected return on equity
Rf= Risk free rate
𝛽= Beta
Like in the previous model, a constant growth in perpetuity can be assumed, and the terminal value will be achieved dividing the last FCFE forecast to the difference between equity returns and the grow rate. If the company is in the middle of a phase that is not the maturity, meaning the fundamentals will change in the near future, the valuation is made using a two or three stage model. The only thing that changes are the growth rates. According to the stage the company is on: high growth, decline of the high growth stage and maturity with a stable grow rate (Damodaran, 2012). This can also be applied to the previous model.
The main disadvantage of this model is ignoring the structure of capitals, (Koller et al, 2010) states that a company can borrow debt to pay dividends, creating an illusion of increasing value and it`s not true because in operational level the source of cash flow all is unchanged. Another problem comes when trying to evaluate a company in each its business units, which would make us allocate the debt and interest to each business unit, a colossal task.
A detail in this model is that it should be equivalent to the Firm valuation one net of debt. However its possible that it will not happen because of the WACC used and losses reported to the next period. When valuating equity in the traditional way, it's presumed that there aren`t reported losses in the present period that had origin in the past. If there are, the tax shield will be wrong. (Télez-Pareja and Tham, 2001) suggests
6 a way to calculate WACC in order to take this situation into account, they call it TV WACC. To do account for tax savings are only made when they are actually happen.
2.1.3- Dividend discount model
Similar to the last model it valuates the equity, but only uses the dividends paid. So the value of the stock should be:
(4) 𝑉𝑎𝑙𝑢𝑒 𝑝𝑒𝑟 𝑠ℎ𝑎𝑟𝑒 𝑜𝑓 𝑠𝑡𝑜𝑐𝑘 = ∑𝐸𝑥𝑝𝑒𝑐𝑡𝑒𝑑 𝑑𝑖𝑣𝑖𝑑𝑒𝑛𝑑𝑠 𝑝𝑒𝑟 𝑠ℎ𝑎𝑟𝑒 (1 + 𝐾𝑒)𝑡
𝑡=∞ 𝑡=1
Only two major inputs here, the expected value of the dividend and the cost of equity. The Re is calculated through CAPM as presented before. Let us look to forecasting dividends. A forecast of net income and the payout ratio of the company must be made.
Like the other models, this one also has variants depending on which growth stage the company is. The Gordon model assumes a stable growth rate, and it will be the same perpetually. So the value is:
(5) 𝑉𝑎𝑙𝑢𝑒 𝑜𝑓 𝑠𝑡𝑜𝑐𝑘 =𝐸𝑥𝑝𝑒𝑐𝑡𝑒𝑑 𝑑𝑖𝑣𝑖𝑑𝑒𝑛𝑑𝑠 𝑛𝑒𝑥𝑡 𝑦𝑒𝑎𝑟 𝐾𝑒 − 𝑔
Being extremely sensitive to the growth rate, it`s advisable to know the limitation and assumptions on it. The dividend growth rate cannot surpass the net income growth rate and the growth rate must be equal or inferior to the economy growth rate were the company is. The Gordon model is only useful for mature companies with stabilized growth rates.
7 (6) 𝑃𝑜 = ∑ 𝐷𝑃𝑆t (1 + 𝐾e,hg)𝑡+ 𝑡=𝑛 𝑡=1 𝐷𝑃𝑆n+1 (𝑘e,st− 𝑔n)
DPS= expected dividends per share in year t.
Ke= Cost of equity (hg: hight grow period, st: stable grow period). DPSn+1= Expected dividends at n+1.
gn= Grow rate for perpetuity.
Damodaran et al, 2002, also states that repurchase of stock is a way of stockholder remuneration. This factor must be taken into account when performing a valuation, so a new formula is used:
(7) 𝑀𝑜𝑑𝑖𝑓𝑖𝑒𝑑 𝑑𝑖𝑣𝑖𝑑𝑒𝑛𝑑 𝑝𝑎𝑦𝑜𝑢𝑡 =
=(𝐷𝑖𝑣𝑖𝑑𝑒𝑛𝑑𝑠 + 𝑆𝑡𝑜𝑐𝑘 𝑏𝑢𝑦𝑏𝑎𝑐𝑘𝑠 − 𝐿𝑜𝑛𝑔 𝑡𝑒𝑟𝑚 𝑑𝑒𝑏𝑡 𝑖𝑠𝑠𝑢𝑒𝑠) 𝑁𝑒𝑡 𝑖𝑛𝑐𝑜𝑚𝑒
The growth rate must also be modified:
(8) 𝑀𝑜𝑑𝑖𝑓𝑖𝑒𝑑 𝑔𝑟𝑜𝑤 𝑟𝑎𝑡𝑒 = (1 − 𝑀𝑜𝑑𝑖𝑓𝑖𝑒𝑑 𝑝𝑎𝑦𝑜𝑢𝑡 𝑟𝑎𝑡𝑖𝑜) × 𝑅𝑒𝑡𝑢𝑛𝑟 𝑜𝑛 𝑒𝑞𝑢𝑖𝑡𝑦
2.1.4- Capital cash flow
This method uses the tax shield into the capital cash flow (CCF), the CCF is the FCF plus the tax shield. It takes into account the cash available to stockholders plus the interest paid to debt holders. Using the tax shield into the cash flow, it`s easier to analyze a company that has a volatile capital structure, because unlike WACC models that would make us recalibrate the discount rate at each period, this one doesn’t.
It can be considered equivalent to the Firm valuation model, but easier to use in high risk companies, and more precise than the APV model because the discount rate
8 used in tax shield is the same for the rest of the cash flow, dealing better results when risk is involve. The APV assumes that the tax shied happens in the moment debt payments are made, so it has the same risk as debt and the cost of debt should be used to discount it. That leads the APV model to return higher results then CCF, and when valuating unstable capital structures we need to know the risk of a tax shield divergence in the future (Ruback, 2002).
The discount rate used in this model is a big advantage because the structure of capital is not necessary to the process, just market values as the unlevered Beta, the risk free and market premium. So the formula is:
(9) 𝐾a= 𝑃𝑟𝑒 − 𝑡𝑎𝑥 𝑊𝐴𝐶𝐶 = 𝑅f+𝛽u𝑅p
The weak point relies with the fact that having a mix cash flow with debt makes it hard to see what really operating performance is and compare it to competitors.
2.1.5- Discounted economic profit (Discounted Economic
Value Added)
This method assumes finding the value of something exclusively by its discounted cash flow it's too simple. The argument is that a decreasing cash flow can mean a bad performance but also a strong investment that will pay out in the future. In this approach, the operation value of a company equals to the invested capital in the balance sheet plus the present value of economic value added forecasted for each year of the valuation (Koller el al, 2010).
The final value achieved by this model if multiple assumption has followed especially the constant WACC rate, should be equal to the firm valuation model. The particularity here is that the creators of value are ROIC and WACC, and unlike the FCF models, if ROIC is decreasing we will not find value in the future. The enterprise value of a company V is given by:
9 (10) 𝑉 = 𝐶 + 𝑁𝑃𝑉
C stands for net invested capital and NPV is the present value EVA, that can be calculated by:
(11) 𝐸𝑉𝐴 = 𝑁𝑂𝑃𝐴𝑇 − 𝑊𝐴𝐶𝐶 × 𝐶𝑎𝑝𝑖𝑡𝑎𝑙 𝑜𝑟
(12) 𝐸𝑉𝐴 = (𝑅𝑂𝐶 − 𝑊𝐴𝐶𝐶) × 𝐶𝑎𝑝𝑖𝑡𝑎𝑙
Looking at the previous formula it easy to see that value is created when we have return on capital superior to WACC that represents the cost to raise those capitals.
There are several EVA models to evaluate a business the most important are: constant grow EVA model, variable grow EVA model, forecast EVA model and T-period EVA model (Grant, 2009).
2.1.6- Adjusted present value model (APV)
APV is a widely known model which evaluates the firm by dividing it into parts. First the firm with no debt and then calculates the positive effects of debt in form of tax shield. The first is discounted at the unlevered rate of equity and for tax shield the debt discount rate is used, the final value of the firm is:
(13) 𝐶𝑜𝑚𝑝𝑎𝑛𝑦 𝑉𝑎𝑙𝑢𝑒 = 𝑈𝑛𝑙𝑒𝑣𝑒𝑟𝑑 𝑓𝑖𝑟𝑚 𝑣𝑎𝑙𝑢𝑒 + 𝑃𝑉 𝑡𝑎𝑥 𝑠ℎ𝑖𝑒𝑙𝑑
The formula above is just a simple way to demonstrate the global intention. There are bankruptcy costs that must be computed especially with high levered firms. According to (Fernadez, 2005) the bankruptcy cost incorporate the probability of bankruptcy or restructuration, information problems, reputation problems and access to grow opportunities. Can be calculated as:
10 (14) 𝑃𝑉 𝑜𝑓 𝑒𝑥𝑝𝑒𝑐𝑡𝑒𝑑 𝑏𝑎𝑛𝑘𝑟𝑢𝑝𝑡𝑐𝑦 𝑐𝑜𝑠𝑡 =
= 𝑃𝑟𝑜𝑏𝑎𝑏𝑖𝑙𝑖𝑡𝑦 𝑜𝑓 𝑏𝑎𝑛𝑘𝑟𝑢𝑝𝑡𝑐𝑦 × 𝑃𝑉 𝑜𝑓 𝑏𝑎𝑛𝑘𝑟𝑢𝑝𝑡𝑐𝑦 𝑐𝑜𝑠𝑡
These factors are not easy to figure but (Damodaran, 2002) says that the probability of bankruptcy can be extrapolated from a bond rank. Depending on the rank that firm has (or similar firms have) there is a default risk associated. To reach the bankruptcy cost we can create our own data from the market and compare, but all of these have a great risk of incoherence.
At last there is an optimal level of debt for each enterprise, that maximization happens when the costs of capital are minimized and the cash flow maximized.
2.2-Relative valuation
The objective in relative valuation is to reach a final value based in comparisons of the price that similar assets have in the market. There are two core components. First the price of assets that are going to be used must be standardized, because what is going to be considered is the asset final market price. That price is a combination between the number of stocks and the value of the firm, but firms don't have the same number of stocks for trade, so to standardize multiples are used. Second assets that really are similar to what we want to value must be found, they must have similar cash flows, growth potential and similar risk (Damodaran, 2012).
What was said before is not easy in real scenarios, because two assets with equal value cannot be found in the market. Therefore the differences between our target firm and the most comparable ones must be taken into account. (Damodaran, 2006) suggests three methods:
-Subjective adjustments: when an average to compare different multiples is used. (Damodaran, 2006) and (Liu, 2001) defend that the harmonic mean it’s the best way. If that mean is too unrealistic, the analyst can make some assumptions, but that can lead to valuation mistakes.
11 -Modified multiples: in this case multiples are modified to take into account a specific variable, the companion variable. The multiples are modified because of a critical value that needs to be addressed in order to make the firms comparable. When using the potential of growth, all other measures must be comparable, and also the relation between multiples is linear. For example if growth duplicates then the PE also duplicates too
-Statistical techniques: When the relation among multiples is complex, the two processes above are hard to execute. To solve that, the statistical methods can be applied, like regressions, and test various independent variables against the dependent in order to explain it. To find out which variable has more influence towards the dependent variable, regression also can be used. Likewise we can use the same statistical method at the market level to find a firm from another sector that can be comparable to ours.
The most widely used multiples can be divided in four categories: earnings multiples, book value multiples, revenue multiples and sector specific multiples. The first two are more dependent on accounting rules. Therefore the last two are better to compare companies with different accounting rules and start-up`s which are likely to report negative results.
Fernandez, 2001, argues that relative valuation should be used primarily as a form of comparison to a more complex analysis process, because multiples tend to be very volatile. It also states that multiples can be divided in three groups: based on firm capitalization, firm value and grow. The most used multiples are:
(15) 𝑃𝐸𝑅(𝑝𝑟𝑖𝑐𝑒 𝑒𝑎𝑟𝑛𝑖𝑛𝑠 𝑟𝑎𝑐𝑖𝑜) = 𝑆ℎ𝑎𝑟𝑒 𝑝𝑟𝑖𝑐𝑒 𝐸𝑎𝑟𝑛𝑖𝑛𝑔𝑠 𝑝𝑒𝑟 share (16) 𝐸𝑛𝑡𝑒𝑟𝑝𝑟𝑖𝑠𝑒 𝑣𝑎𝑙𝑢𝑒 𝑡𝑜 𝐸𝐵𝐼𝑇𝐷𝐴 = 𝐸𝑉 𝐸𝐵𝐼𝑇𝐷𝐴 (17) 𝐸𝑛𝑡𝑒𝑟𝑝𝑟𝑖𝑠𝑒 𝑉𝑎𝑙𝑢𝑒 𝑡𝑜 𝐸𝐵𝐼𝑇𝐷𝐴 𝑔𝑟𝑜𝑤 =𝐸𝑉 𝐸𝐺 (18) 𝑃𝑟𝑖𝑐𝑒 𝑡𝑜 𝑏𝑜𝑜𝑘 𝑣𝑎𝑙𝑢𝑒 = 𝑃 𝐵𝑉 (19) 𝑃𝑟𝑖𝑐𝑒 𝑡𝑜 𝑐𝑎𝑠ℎ 𝑒𝑎𝑟𝑛𝑖𝑛𝑔𝑠 = 𝑃 𝐶𝐸
12 Liu, 2001 says multiples can ignore some information that would be useful in a broader evaluation as DCF, but they have the same principles. Value is a function that grow with the earnings grow and decreases when risk increases.
To identify the value drivers that better explain comparable firms with the target, first historical value drivers were identified, like Cash flow, EBITDA, sales, earnings and book value. Then future value drivers obtain through analysts forecasts like EPS (Earnings per share) and PEG (Price earnings grow). Intrinsic measures based on residual income were also used.
The conclusions about the best multiples to use, are the ones based on forecast profit and if that forecast is between one and three years better. From data based on historical values also the ones based on profit are better, the worst are the ones based on cash flow (Liu, 2001).
2.3-Contigeny claim valuation
This method defends real cash flow value can be higher or lower than the estimated ones in a traditional way. This happens because cash flows can be dependent of a certain event, and, if it happens or not, the cash flow value will vary largely.
In this case we use a similar model used to price financial options like a binomial tree. In practice this model analyses part of a company that normal models can't, for example patents or natural resources that were not fully developed (Damodaran, 2012).
2.4- Asset based valuation
Asset based valuation assumes the best way to know the value of a company is to look at it`s financial statements and don’t undertake forecast of the future.
13
2.4.1-Book value
The balance sheet states the exact accounting value of a business, both assets and equity. Accounting rules could give different values for assets depending if they accounted for it`s historical price or present value. Another problem is the intangible assets like brands that are difficult to value properly. A general consensus according (Damodaran, 2006) was achieved and for fixed assets historical values should be used for current assets present market value is the proper choice.
This can be a good proxy for mature companies, if they have little or zero growth and don’t have the capacity for extra returns. For the other cases this approach doesn’t work.
2.4.2-Liquidation value
The value of a company is computed based on the final value of every asset of a firm if they were to be sold. However, in a hurry to sell will lead to a discount on the final price of each asset, the magnitude of that discount is correlated to the number of buyers available to purchase each item. This particularity influences greatly the final value.
This method is good for companies already at financial distress but for all the others will value them much lower than their real value (Damodaran, 2006).
2.4.3-Replacement cost
Like the name indicates, this method considers the value of a company, the cost that it would have if all the assets were to be replaced (Damodaran, 2006) .
14
3-Presentation of Portucel
Portucel was founded in 1964 and named Socel - Sociedade Industrial de Celulose, with an industrial complex producing BEKP in Setubal. In the following years a paper mill was acquired and starts making paper, using as primary raw material the pulp produced in the group.
In 1972 the first exports to Europe began, starting to build up market share, which is the biggest market for Portucel today and it`s major source of revenues. In 1976 the company was nationalized and the privatization process only begun in mid 90`s. However, the group Portucel/Soporcel only appears in 2001, when the privatization process is completed. In 2004 the group was acquired by Semapa which is an industrial conglomerate and nowadays the major stock holder of Portucel.
Presently the group is European lead and sixth globally in UWF (uncoated wood free) paper sector that englobes office and graphic papers. It also leads in Europe in production of pulp, BEKP (bleached eucalyptus kraft pulp) and is the fifth producer at a global level.
It`s worth mentioning that 62%, according to most recent Portucel annual report, of the sales are made under a brand developed by the group, showing it`s strength and commitment in looking for what the clients want and deliver. The star of the group is Navigator, premium office paper and number one in sales globally for the segment.
Through time Portucel has expanded it`s business portfolio. What begun only with pulp and paper production, now also have agro-forestry and energy. Forestry production is growing and in 2013 showed a 10% grow due to an investment in Espirra vivarium, achieving an annual production capacity of 12 million plants. In energy the group focus on biomass production, the project started in 2009 and already is 50% of national biomass production and 5% total national energy.
15
3.1-Stackholder structure
Portucel is traded in the Portuguese stock market, being one of biggest companies there. In 31 July 2014 represents nearly 1% of the total value of the market index according to CMVM. It`s major stockholder is Semapa SGPS SA, with a share of 75,85% of capital, shown in the table I. Worth to mention that Seinpar investments B.V. it`s a subsidiary of Semapa SGPS SA.
Table I
Portucel stokholder structure.
Source: Portucel Website.
Analyzing the above table, it`s opportune to see who is Semapa. It is a Portuguese industrial conglomerate with three major sectors of activity:
-Paper and pulp (Portucel group) -Concrete ( Secil group)
-Environment (ETSA group)
Portucel was acquired in 2004 by an OPA for 67,10% of it`s capital at a target price of 1,55€ per stock. Semapa stock holder structure can be seen below on Figure I. We should note that president of Semapa Pedro Queiroz Pereira is also the board president at Portucel and allegedly who have a major position on Cimigest under several financial vehicles, making him the owner of Portucel.
16
Figure I
Semapa stockholder structure
Source: Semapa website.
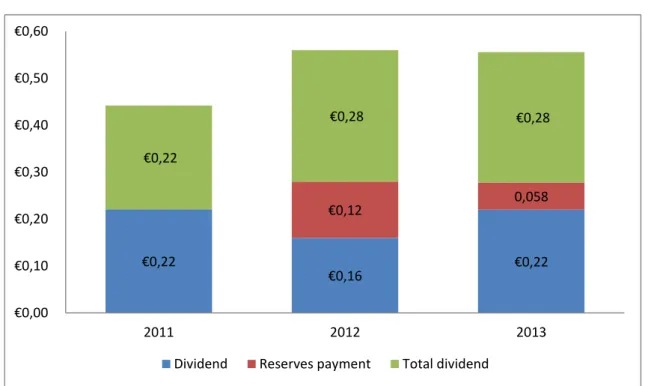
3.2-Dividend payout policy
Portucel paid dividends to the stockholders based on the profit of the period and reserves, the details about the dividend paid in the last three years are in the Appendix-A, Figure II.
3.3-Operational perform
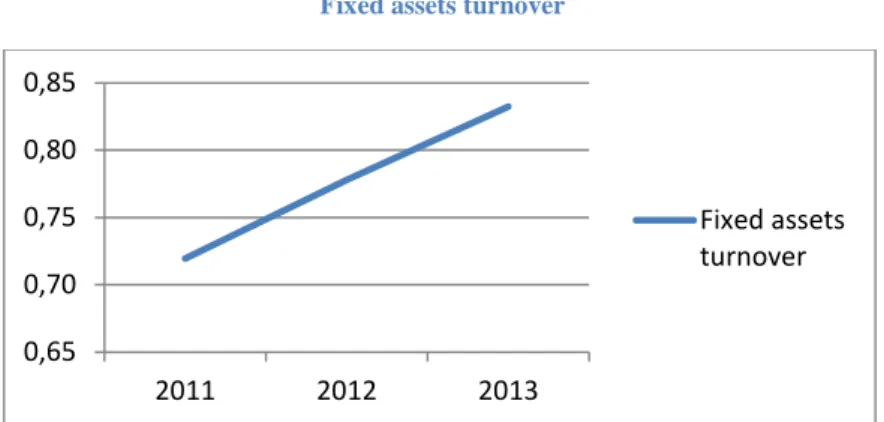
Portucel assumes itself as an high efficiency company. Using data from the firm annual report, some operational ratios will be computed to see if it's capable of minimizing wastes and maximizing the productive process with the current assets available. A good operational performance has a direct impact on the earnings. In a market highly competitive, were the prices are push down due to competitive strengths, it`s imperative to get a bigger profit margin by production efficiency. The ratios to use will be: capital employed turnover, fixed assets turnover, total assets turnover and sales/revenue per employee. The Figures are in appendix-A.
The Figure III, capital employed turnover, shows a relation between invested capital and the revenues of the period, showing how well managed is the capital of the investors. It was been increasing except for the result in 2013 that can be explained by
17 the maturity of 160 million € worth of bonds, making liabilities take a big decrease in value.
Return against fixed assets is analyzed Figure IV and shows that the investments made by Portucel were capable to increase the revenue, showing that the operation capacity of the factories is being better used.
Figure V shows total assets turnover. The ratio is similar to the one in Figure IV but now all the assets are considered, witch justifies the results in 2013 as the cash and equivalents account had a big increase.
At last, the relation between sales and employees, present on Figure VI shows an increase through the three years, even when the work force is being slightly reduced in the last years but the revenue from sales keeps growing, which shows a better use of the technology and new equipment used in Portucel.
3.4- Strategy
The strategy followed by Portucel has three main focus: expansion to new markets, efficiency gains in production and R&D Portucel sponsors in specialized center RAIZ (Instituto de Investigação da Floresta e do Papel) and universities. The final result is a high quality in production the flagship of the company, which allows it to have success in a highly competitive market.
A great investment was made in Mozambique and will accommodate a big forestry area and an industrial unit to produce pulp and energy. In national territory a new expansion of the forestry area was made, making the group the owner of the biggest certified plants vivarium of Europe. Also comes to slightly mitigate the risk of wood price variation on the markets. We should note that Portucel always try to certificate is projects with the high quality standards on the market, fitting the high quality policy of the company.
18 The exports of product are made to more than 100 countries around the world, however European Union have more than 85% of that market share, never the less is a good example of a company trying to expand is market.
The gains in productivity are achievable because the great investment that was made in high tech equipment that allows to produce more using less resources, especially at energetic levels and also making possible to have a great productivity without the workers having to do extra shifts.
4-Macroeconomic framework
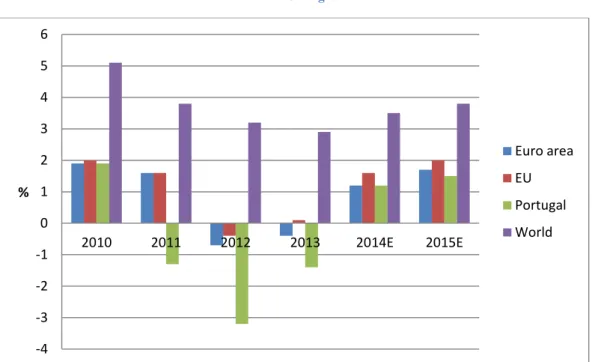
The revenue of Portucel depends of the international pulp and paper prices that are connected to the global economic activity, which is still recovering from the crisis of 2008, especially Europe, the major market for Portucel. Figure VII shows the expected grow in GDP. A growth in the coming years can sustain the prices of pulp and paper. However, in Europe, the major market, the growth is still very low and the macroeconomic outlook for the Eurozone is still cautious. We should mention that globally, the major player now is the Chinese market and according to RISI (2014) the demand can be revised up in 2014 and 2015.
4.1-Energetic costs
The energetic costs are also mentioned as a competitive disadvantage in Portucel annual report. These are negative aspects in the profit margin and to heavy industry like Portucel can be an operating risk. In the Figure VIII we can see that there was a rising in the prices of electricity in Portugal and seem to stabilize in the last year. Nevertheless Portugal still has a higher cost then the rest of Eurozone.
19
4.2- EUR/USD exchange rate
The company strategy was always focused in exports, a right choice when the home market is as small as the Portuguese. The exports are primarily to other European countries, but an effort to diversify the markets as been made lately.
It`s known that the firms don’t have a competitive strategy based in low prices, focusing more on premium quality products higher priced then it`s competitors from South America and China. Although the strength of the European currency put`s Portucel in disadvantage face it`s competitors from USA and Canada, being the exchange rate a risk for the operation.
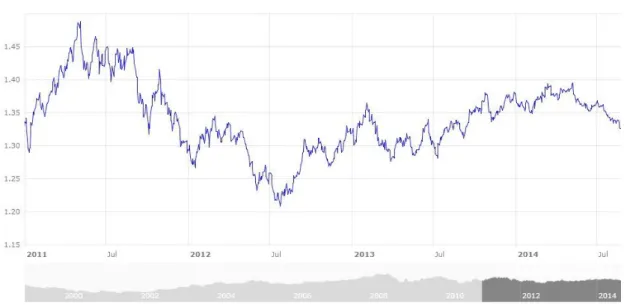
The forecasts are aiming to a downward of Euro/USD in the near future due to the recovery of the United States economy, the announced reduction of FED injections of money in the economy and the low inflation in Eurozone. In the CME futures market the years of 2015 points to an average exchange rate of 1,32855 EUR/USD but in the next years it points to a recovery for Euro. The evolution of EUR/USD exchange rate can be analyzed in Figure IX.
4.3-Wood prices
Globally the price increased in 2013, mainly due to American and Asiatic markets were the economic recovery is stronger. The USA are the biggest contributors to the rise in wood prices because of the housing market recovery. It`s expected a 4 to 5 percent rise according to the RISI (2014) report. The Figure X shows the evolution of wood prices in the last years.
20
4.4-BEKP prices
We already stated here that the pulp prices are dependent of economic growth, and demand in 2013 grew especially in BEKP products because of the Chinese market. But the level of prices was constant in Europe, consequence of the devaluation of Euro versus the Dollar. The Figure XI shows the evolution of BEKP prices in Europe. The price should remain stable and the reason is that the Chinese mainly show a growth on demand but are reluctant in buying large quantities, waiting to for the start of operation of a big complex in South America, so prices suffer from downward forces and they can buy cheaper RISI (2013).
Figure II BEKP prices in Europe
Source Portucel 2013 annual report.
4.5- Paper prices
The paper market shows less positive signs than the pulp in demand aspects. According to Portucel annual report, the international prices were less 0,5% than in last year.
CEPI (Confederation of European Paper and Industries) (2013), shows that global production and demand has shown a downfall in last years because of graphic papers reduced demand, the economic performance also helped in keeping the demand low. RISI (2014), says that demand on paper in 2014 should rise again following the
21 economic growth, but that forecast is based that the gap between economic growth and paper demand in 2014 will be smaller than in the last years.
5-Swot analysis
To better understand the economic environment and the difficulties, Portucel may have as is advantages face competitors. A SWOT analysis is performed based on annual reports from the firm, as well as a report by CEPI (2005).
Strengths
- Portucel`s brands are recognize, especially in the premium sector with Navigator which even in recession is able to grow in sales.
- Exports for many countries, diversifying the market risk. - Strong technological capabilities and efficiency in production.
- Type of wood consumed exists abundantly in the country of production.
Weaknesses
- Growth in energy and wood costs can compromise the profit margins. - High work force costs and inflexible labor laws.
- Tendency to appear more environment regulation and bring new costs to production.
Opportunities
- Markets in Eastern Europe, Russia and Asia.
22 - Better use of information technologies.
Risks
- Increasing tendency of energy and transportation costs.
- Access to credit at competitive rates it`s difficult because of the national crisis in the banking sector.
- Tendency to cut in investment and development may arise to cut expenses. - Old work force and difficult to find specialized workers, may bring high
formation cost in the future.
6- Porter strengths
Analyzing the competition in the market to better define a future strategy, Michael Porter describes in “How competitive forces shape strategy, 2000” four variables to take into account: entry of new competitors in the market, suppliers power of negotiation, clients power of negotiation and risk of substitute products.
Entrance of new competitors
The entrance of new players implies that someone has to loose space and the probability of newcomers enter depends on the barriers existent. Those barriers are the economics of scale, product differentiation, capital requirements and government support.
The pulp and paper industry is a heavy industry with very high costs of investment. In a market already saturated and with low margins, were the profit depends on the production efficiency and market diversification, we can say that in Europe, the risk of appearing new competitors is low. However, in emerging markets were are low labor costs, energy costs and permissive environment laws, there are more chances of new competitors to arrive, like it`s said in RICI (2014) report. So in these markets the risk is medium.
23 Suppliers and clients power of negotiation:
The power of negotiation from suppliers can make a company bankrupt, decreasing the profit margin to the point that is no more profitable. Clients can also demand better and more services, according to the level of competition on the market.
The supplier has a large power of negotiation if there is little competition and the industry is concentrated. If the product that he offers is highly specialized and the supplier does not depend of it to profit, then there is no motivation to keep prices reasonable.
In the industry were Portucel operates, it`s vulnerable to the price of raw materials like wood or the chemical products. Since the company kept a strategy of high quality witch implies the use of certified wood, diminishing the number of available suppliers, and the wood prices are not only dependent of pulp and paper industry the housing market also makes the prices. So we conclude that the supplier’s power of negotiation on this sector is medium.
The clients in this market don`t have the power to influence the prices, the companies that exist and have good management are well established and already have a predefine set of products that are price accordingly. Portucel increased the prices of is premium papers sector and the sales grew in the period. So we can say the client’s power of negotiation is low.
Entrance of substitute products
The entrance of new products in the market, affects the revenue and growth of a firm. It all depends of trade-off price/quality the new product has. That relation dictates how well the product can enter the market and take market share.
Portucel is not exposed to this type of risk, since it`s a company with a high level of productivity and quality. In the paper side, which represented 80% of the revenue last year, according to Portucel annual report, the risk is low because of the investigation advantage, the equipment already installed and also the brands that already are recognize on the market, making the necessary investment to other company to compete from zero, too high.
24 The competitors already on the market are well known to the company, so the risk from a R&D revolution on a new product that jeopardizes Portucel market share is very unlikely to occur.
7-Valuation
Valuation is reported to 31 December of 2013, and was made based on the discounted cash flow method, were the cash flows were estimated for a 5 year period and then discounted at WACC rate. The DCF is used because it`s the better way to reach a company value based on it`s fundamentals (Damodaran, 2012). In the following points, the major assumption undertake during valuation will be explained.
7.1- WACC
To calculate the WACC discount rate, a cost of equity of 9,29% was considered. That value is the result of CAPM model. In CAPM model a risk free of 5,45% that was the yield of Portuguese OT in the beginning of 2014, a beta of 0,64, the result of regression between the daily return of PSI and Portucel stock during 5 years were considered.
To calculate the cost of debt, the risk free was added to the default rate given by Moody`s for BB+ bonds, that were the level of risk of the Portucel bonds according Bloomberg, the result was 7,55%.
The WACC rate is the weighted average of the debt and equity cost, was calculated in the three years using historical data for the D/E ratio, Portucel keep that ratio stable so the values were between 7,81% in 2013 and 7,93% in 2011, with a three year average of 7,87% value that was used in the valuation. The WACC was considered
25 to be constant during the forecast years because the company also historically showed that the D/E ratio was shown low volatility.
7.2- Sales
The sales play a major role in this forecasting as the weighted average of the different rubrics was made based on the sales and then that average to forecast for the next periods as explained in (Koller, 2005).
To estimate future sales the assumption that the company will not make future investments in the near future was made. Also the production should continue constant over time since the utilization levels are near 100% as stated in the company annual report. Also the weight of the different sectors was kept constant, because viable information in that regard was not available and changes could only increase the valuation error. So sales were predicted based on the evolution of the Eurozone economy that is the major market of the firm. That’s a forecast average of 1,88% grow.
7.3- CAPEX and Net working capital
The traditional way to calculate CAPEX could not be implemented in this valuation, since the company has ended it`s cycle of investment that value would not be accurate to the historical levels. In (Portucel- forward looking statements, April 2013), the company stated that CAPEX historically was about 20% of the EBITDA and that was the value used in valuation. Details in appendix-B, table III.
The net working capital was calculated net of cash, since the cash in not and operational need. And also net of debt, because the debt will be subtracted net of cash later so we avoid double use of the same values.
26
7.4-Valuation
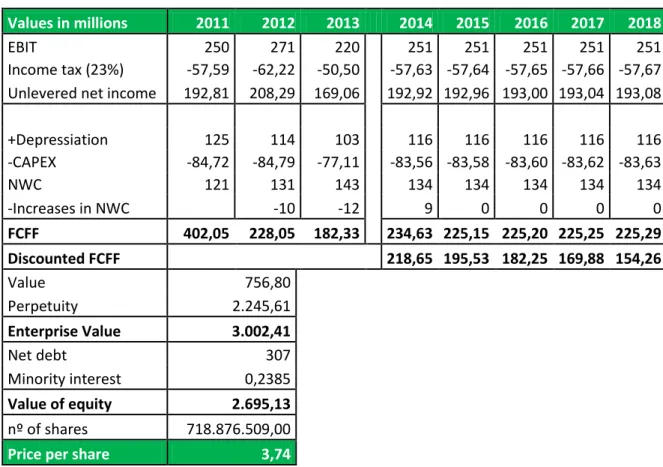
The valuation, like said before was based on the discount of free cash flow, most precisely FCFF calculated as described in point 2.1.1 and to calculate the value in perpetuity a value of 1% was assume, because it`s a mature firm and a grow rate of 1% is consistent with the rest of the assumption made. The income tax rate used is based on KPMG corporate tax rates. To reach the final value, the debt net of cash was subtracted and also the minority interest, so the value of equity is what remains. Finally the equity value was divided by the number of shares outstanding at the end of 2013 giving the value of 3,74 euros per share, as seen on table II.
Table II Portucel valuation
Values in millions 2011 2012 2013 2014 2015 2016 2017 2018
EBIT 250 271 220 251 251 251 251 251 Income tax (23%) -57,59 -62,22 -50,50 -57,63 -57,64 -57,65 -57,66 -57,67 Unlevered net income 192,81 208,29 169,06 192,92 192,96 193,00 193,04 193,08
+Depressiation 125 114 103 116 116 116 116 116 -CAPEX -84,72 -84,79 -77,11 -83,56 -83,58 -83,60 -83,62 -83,63 NWC 121 131 143 134 134 134 134 134 -Increases in NWC -10 -12 9 0 0 0 0 FCFF 402,05 228,05 182,33 234,63 225,15 225,20 225,25 225,29 Discounted FCFF 218,65 195,53 182,25 169,88 154,26 Value 756,80 Perpetuity 2.245,61 Enterprise Value 3.002,41 Net debt 307 Minority interest 0,2385 Value of equity 2.695,13 nº of shares 718.876.509,00
Price per share 3,74
Source Made by author.
At 17 September 2014 the current Portucel stock price is 3,22 euros what represent a potential increase in value of 16,15%.
27
7.5-Sensability analysis
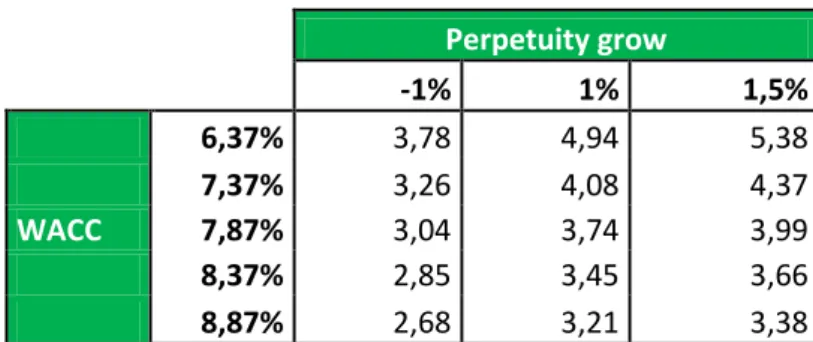
To complement the valuation some key factors were change to see the impact on the final value of the company, the factors change were the WACC rate and the terminal grow rate, the results achieved were very volatile and in some cases unrealistic in the short period the values were between 5 euros a share with terminal grow 1,5% and WACC rate 6,37% and 2,68 with terminal grow -1% and WACC rate 8,87%, for the complete table of results please see appendix-B, table IV.
7.6-Multiple analysis
To better compare Portucel to it`s competitors a multiple analysis is useful, because it`s easy and we can have a more present overview of the market feeling over the companies described. The firms that were used were chosen from PWC annual (Global Forest, Paper and Packaging industry survey, 2013) comprehend the top revenue company with International Paper and American company and the two best classified European companies UPM-Kymmene and Stora Enso both from Finland to close the group an European company near Portucel classification was chosen another finish firm, Ahlstrom. The results are appendix-B, table V and the multiples considered were P/E ratio, price/book ratio and price/sales ratio. In P/E ratio Portucel was only below UPM-Kimmesne suggesting a relation between share price and earnings per share that leave to improvement. In the EPS ratio Portucel is the second only behind Internacional Paper and UPM-Kimmense two top 5 companies in revenue last year. In P/B and P/S the company doesn`t seem to be under valuated and looking solely to this ratios investors may not see it as a good investment possibility.
28
8-Comparison
In this chapter a comparison to a master thesis from last year will be made, stating the different assumptions and why I fallowed a different approach on the valuation of the same company.
The author Miguel Fernandes, used the same valuation model the discounted cash flow to the firm and arrived at a different target price of 3.33 € per share. One of the reasons was the way forecast of sales was threated. On this work the sales were forecasted assuming that the only relevant factor was the evolution of the GDP of the Eurozone. This was done because it`s simpler way and therefore less suspect to insert more uncertainty to the valuation.
On the other work forecast of sales also took into account the evolution of the Eurozone GDP growth and then some variables were inserted to provide the forecast, especially the evolution of production capacity, also the pulp production was forecasted in basis of the historical relation of the quantity of pulp that was produced and then introduced in the production of paper. Also the prices of sale were considered to be lower in the future, about the prices as the company stated in it`s report at least in paper deals in premium market and their prices don’t fallow the market tendency in 100% . Last year they increase a bit on the prices contrary to the market tendency.
The major differences in the WACC rate consisted in the way inputs were calculated. The cost of equity also from CAPM had for risk free from the 10 year German bund, the beta used the MSCI Europe as the index to do the regression against and the cost of debt and then because the risk free was a German bund a country risk premium was added. The cost of debt was also the risk free plus a spread according to the rating of the bonds outstanding from the company.
In this work it was more appropriate to use a risk free rate considering the OT from Portugal also with 10 years maturity, however it`s understandable the use of the German bund`s in 2013 since the interest rates for Portuguese OT at that time was too high to represent a realistic risk free rate. The Beta was calculated using the PSI 20
29 because the company is represented in Portugal and their major market can be in Europe it still suffers from market risk and variation according to the behavior of the Portuguese market therefore the PSI 20 seems the better choice to use to calculate the beta. Also if this is used to calculate the cost of equity we should remember that their major shareholder`s and owners of the company are Portuguese so the cost of equity should represent the Portuguese market.
The cost of debt was calculated the same way adding a spread according to the rating of Portucel`s Bonds, the difference as said before was that the risk free is the Portuguese OT rate.
The CAPEX was also difficult to calculate in both works, the company had finished the investment cycle and the values were useful to forecast company future value. So information made available by the company was used I used the historical value of 20% of EBITDA according to a quarterly report by the company the other work used 5% of the revenue also according to information made available by the company. The net working capital was calculated the same way.
The process of valuation used the same model the cash flow to the firm and also the the growth to perpetuity was the same 1% as it`s the normal for firms with this level of maturity, the principal difference here was the WACC tax is adjusted each here going from 8,8% to 9,5%, since the debt to equity ration in the company is historically in conservative values and stable, in this work an average WACC calculated with data the three years of historical data was used.
In conclusion this proves that a valuation is highly influences by the analyst assumption choices and those choices are made considering the informational and it`s quality available at the time, they can not make sense now but at the time their were made because probably was the best then. So to keep the valuation up to date is imperative that the values are actualized with current info and some assumptions changed trough time if their assumptions don’t make sense anymore.
30
9-Conclusion
In this work as been stated the existence of many valuation models, to choose what is right depends in what the analyst feels more comfortable and the information available at the moment. There isn`t a model that guarantees the right price it is to the analyst choose the right assumptions and achieve a realistic value for the company. Many times there are a lot of information that surely influence the performance of the firm but if the amount or how it influences is unknown it is best to leave it and assume simpler influence factor, the most important thing is to keep coherence in all the valuation process.
Portucel is a well managed firm that is capable of good returns in an industry were many companies have enter bankruptcy, and has been capable of perform important investments in the past without raising it`s level of debt to dangerous values, leaving room to increase it if needed in the future. The assumption may seem a little conservative with very low grow on it`s sales but even this way the price target is 3,74 that is 16,15% more then it`s current value and therefore the recommendation of buy is the conclusion in this work.
31
10-Bibliography
CEPI (2005). Competitiveness and Europe`s Pulp & Paper industry: The state of play. Brussels, Confederation of European Paper Industries.
CEPI (2013).Key statistics: European pulp and paper industry. Brussels, Confederation of European Paper Industries.
Damodaran, Aswath (2002). Investment valuation: Tools and techniques for determining the value of any asset. 2ª Ed. NewYork, John Wiley & Sons.
Damodaran, Aswaath (2006). Valuation approaches and metrics: A survey of the theory and evidence. New York, Stern University.
Damodaran, Aswath (2012). Investment valuation: Tools and techniques for determining the value of any asset. 3ª Ed. NewYork, John Wiley & Sons.
DeMarzo, Peter and Berk, Jonathan (2011). Coporate finance. 2ª Ed.Harlow, Pearsn education.
European Central Bank (2014). Euro foreign exchange reference rates [Data base]. Available at: http://www.ecb.europa.eu/stats/exchange/eurofxref/html/index.en.html [Accessed 13/08/2014].
Eurostat (2014). Real GDP grow [Data base]. Available at: http://epp.eurostat.ec.europa.eu/tgm/table.do?tab=table&init=1&plugin=1&language=e n&pcode=tec00115.
Eurostat (2014). Energy statistics- prices [Data base]. Available at: http://epp.eurostat.ec.europa.eu/portal/page/portal/energy/data/main_tables .
Fernades, Miguel (2013). Equity reseach- Portucel. Lisbon, ISEG.
Fernadez, Pablo (2001). Valuation using multiples. How do analysts reach their conclusion?. Barcelona, IESE Business School-University of Navarra.
32 Fernandez, Pablo (2005). Discounted cash flows valuations methods: Examples of perpetuities, constant grow and general case. Barcelona, IESE Business School-University of Navarra.
Grant, James L. (2009). The valuation hand book. Univercity of Massachusetts Boston. Grupo Portucel Soporcel (2014). Informação financeira. [Online]. Available at:
http://www.portucelsoporcel.com/pt/investors/financial-information.php [Accessed:
14/08/2014].
Grupo Portucel Soporcel (2014). Accionistas. [Online]. Available at: http://www.portucelsoporcel.com/pt/investors/shareholders.php [Accessed: 20/08/2014].
Investing Businness Week (2014). Company overview [Online]. Available at: http://investing.businessweek.com/research/stocks/private/snapshot.asp?privcapId=5327 6193 [Accessed: 16/07/2014].
Jennergren, Peter L. (2011). A tutorial on the discounted cash flow model for valuation of companies. Stockholm Shool of Economics.
Koller, Tim; Goedhart, Marc and Wessels, David (2010). Valuation: Measuring and managing the value of companies. 5ª Ed. NewYork, John Wiley & Sons.
KPMG (2014). Corporate tax rate tables [Online]. Available at: http://www.kpmg.com/global/en/services/tax/tax-tools-and-resources/pages/corporate-tax-rates-table.aspx [Accessed 25/08/2014].
Liu, Jing; Nissin, Doron and Thomas, Jacob (2001). Equity valuation using multiples. Univercity of California Los Angeles.
NASDAQ (2014). Lumber: Latest price & chart for lumber [Online]. Available at: http://www.nasdaq.com/markets/lumber.aspx [Accessed 20/08/2014].
Porter, Michael (2000). How competitive forces shape strategy Boston, Harvard University.
Portucel-Relatório de Gestão 2011. Portucel-Relatório de Gestão 2012.
33 Portucel- Relatório de Gestão 2013.
PWC (2013). Global Forest, Paper & Packaging Industry Survey. Pricewaterhousecoopers LLP.
RISI (2013). World pulp monthly: Analysis and forecast of the international pulp market. Bedford, RISI Inc.
RISI (2014). World pulp monthly: Analysis and forecast of the international pulp market. Bedford, RISI Inc.
RISI (2014).Lumber commentary: A monthly economic analysis of the north American softwood lumber markets. Bedford, RISI Inc.
Ruback, Richard S. (2002).Capital cash flows :A simple approach to valuating risky cash flows. Boston, Harvard University.
Semapa SGPS (2014). Principais accionistas [Online]. Available at: http://www.semapa.pt/pt-pt/principais-accionistas [Accessed: 17/08/2014].
Vélez-Pareja, Ignacio and Tham, Joseph (2001). Firm valuationor cash flow to equity?.Bogotá, Politécnico Grancolombiano.
34
Appendix A- Figures
Figure III
Dividend of the last three years
Source- Data from Portucel annual reports, graphic made by author. Figure III
Capital employed turnover
Source Data from firm annual report, elaborated by the author
€0,22 €0,16 €0,22 €0,12 0,058 €0,22 €0,28 €0,28 €0,00 €0,10 €0,20 €0,30 €0,40 €0,50 €0,60 2011 2012 2013
Dividend Reserves payment Total dividend
0,55 0,60 0,65 0,70 2011 2012 2013 Capital employed turover
35
Figure IIV Fixed assets turnover
Source- Data from firm annual reports, elaborated by the author. Figure V
Total assets turnover
Source- Data from firm annual reports, elaborated by the author. Figure V
Sales/Revenue per emplyee
Source- Data from firm annual reports, elaborated by the author.
0,65 0,70 0,75 0,80 0,85 2011 2012 2013 Fixed assets turnover 0,51 0,52 0,53 0,54 0,55 0,56 2011 2012 2013 Total assets turover €620 000,00 €640 000,00 €660 000,00 €680 000,00 2011 2012 2013
Sales/Revenue per employee
Sales/Revenue per employee
36
Figure VI Real GDP grow rate
Source Data from Eurostat, prepared by author.
Figure VIII
Electricity prices for industrial consumers
Source Data from Eurostat, prepared by author.
-4 -3 -2 -1 0 1 2 3 4 5 6 2010 2011 2012 2013 2014E 2015E % Euro area EU Portugal World 0,0850 0,0900 0,0950 0,1000 0,1050 0,1100 Euro area Portugal
37
Figure IVII EUR/USD exchange rate
Source BCE. Figure VIII Wood prices
38
Appendix B- Tables
Table III Capex
Values in millions 2011 2012 2013 2014E 2015E 2016E 2017E 2018E
EBITDA (RO-Amt-Provisões) 385,07 385,42 350,50 379,84 379,91 379,99 380,07 380,15
CAPEX 84,72 84,79 77,11 83,56 83,58 83,60 83,62 83,63
Source Data from Portucel annual reports, calculations made by author. Table III Sensibility analysis Perpetuity grow -1% 1% 1,5% 6,37% 3,78 4,94 5,38 7,37% 3,26 4,08 4,37 WACC 7,87% 3,04 3,74 3,99 8,37% 2,85 3,45 3,66 8,87% 2,68 3,21 3,38
Source Data calculated by author. Table V
Multiple analysis
Comapny
Current P/E
ratio EPS Market cap. Price/book Price/sale
International Paper 9,11 5,48 21.265.710.000 2,83 0,76
Stora Enso 10,39 0,06 5.022.220.000 0,99 0,49
Ahlstrom - -0,25 359.360.000 1,1 0,36
Portucel 11,41 0,29 2.513.560.000 1,55 1,61
UPM-Kimmense 12,08 0,93 5.986.000.000 0,82 0,59