Submitted8 May 2015
Accepted 26 January 2016
Published29 February 2016
Corresponding author
Carla Sousa-Santos, carla.santos@ispa.pt, csousasantos@gmail.com
Academic editor
William Amos
Additional Information and Declarations can be found on page 20
DOI10.7717/peerj.1694
Copyright
2016 Sousa-Santos et al.
Distributed under
Creative Commons CC-BY 4.0
OPEN ACCESS
Broad-scale sampling of primary
freshwater fish populations reveals
the role of intrinsic traits, inter-basin
connectivity, drainage area and latitude
on shaping contemporary patterns of
genetic diversity
Carla Sousa-Santos1, Joana I. Robalo1, Ana M. Pereira1, Paulo Branco2,3,
José Maria Santos2, Maria Teresa Ferreira2, Mónica Sousa4and
Ignacio Doadrio5
1MARE, ISPA, Lisbon, Portugal
2CEF—Centro de Estudos Florestais, Instituto Superior de Agronomia, Universidade de Lisboa,
Lisbon, Portugal
3CERis—Civil Engineering Research and Innovation for Sustainability, Instituto Superior Técnico,
Lisbon, Portugal
4Instituto da Conservação da Natureza e das Florestas, I.P., Lisbon, Portugal 5Museo Nacional de Ciencias Naturales, CSIC, Madrid, Spain
ABSTRACT
Background. Worldwide predictions suggest that up to 75% of the freshwater fish species occurring in rivers with reduced discharge could be extinct by 2070 due to the combined effect of climate change and water abstraction. The Mediterranean region is considered to be a hotspot of freshwater fish diversity but also one of the regions where the effects of climate change will be more severe. Iberian cyprinids are currently highly endangered, with over 68% of the species raising some level of conservation concern.
Methods.During the FISHATLAS project, the Portuguese hydrographical network was extensively covered (all the 34 river basins and 47 sub-basins) in order to contribute with valuable data on the genetic diversity distribution patterns of native cyprinid species. A total of 188 populations belonging to 16 cyprinid species of Squalius, Luciobarbus, Achondrostoma, Iberochondrostoma, AnaecyprisandPseudochondrostoma were characterized, for a total of 3,678 cytochromebgene sequences.
Discussion. Targeting multiple co-distributed species of primary freshwater fish allowed us to assess the relative role of historicalversuscontemporary factors affecting genetic diversity. Since different patterns were detected for species with identical distribution areas we postulate that contemporary determinants of genetic diversity (species’ intrinsic traits and landscape features) must have played a more significant role than historical factors. Implications for conservation in a context of climate change and highly disturbed habitats are detailed, namely the need to focus management and conservation actions on intraspecific genetic data and to frequently conduct combined genetic and demographic surveys.
SubjectsBiodiversity, Conservation Biology, Genetics
Keywords Cyprinidae, Haplotype diversity, Nucleotide diversity, Mediterranean streams, Freshwater fish conservation, Genetic diversity drivers, Endangered species
INTRODUCTION
Freshwater biodiversity has declined faster than terrestrial and marine biodiversity over the last decades (Jenkins, 2003). Up to 75% of the freshwater fish species occurring in rivers with reduced flow could be extinct by 2070 due to climate change and water abstraction (Xenopoulos et al., 2005). The Iberian freshwater ichthyofauna is very rich in diversity and endemisms (Doadrio et al., 2011), a feature that was potentiated by geographical isolation and that is common to other Mediterranean peninsulas (Clavero, Blanco-Garrido & Prenda, 2004). Cyprinids are the most diverse and ecologically impor-tant components of the Iberian native ichthyofauna, contributing to the Mediterranean hotspot of freshwater fish diversity (Myers et al., 2000) with at least 16 endemic species (Doadrio et al., 2011). However, native cyprinids are highly endangered, with over 68% (26 out of 38) of the species raising some level of conservation concern (Cabral et al., 2005;Doadrio et al., 2011).
changes and extreme events are likely to impact freshwater fish populations, resulting in drastic reductions and/or changes in species-distribution ranges, communities and life-histories that ultimately may lead to extinction (Filipe, Lawrence & Bonada, 2013). Migrating or dispersing to more favourable sites might obviate extinction. However, as Iberian cyprinids are primary freshwater fish, they are confined to their habitats and, thus, their evolutionary history closely resembles the evolution of paleodrainages and the rearrangements of the fluvial network through time (Reyjol et al., 2007). This obligatory confinement makes them excellent models to study speciation and the radiation of ancient lineages throughout Iberia (e.g.,Salgueiro et al., 2003;Mesquita et al., 2005;Sousa et al., 2007;Almada & Sousa-Santos, 2010;Gante, 2011;Lopez-Cunha et al., 2012;Aboim et al., 2013;Sousa-Santos et al., 2014a;Sousa-Santos et al., 2014b).
Although crucial, the application of genetics in the management of wild threatened species is still far from being common (Frankham, 2010). Thus, given the imperilment of most of the Portuguese native cyprinid species, the FISHATLAS project was launched to contribute with valuable data on the genetic diversity distribution patterns of native cyprinid species that would help to prioritize target populations for conservation.
As the distribution of the genetic diversity may have been shaped by historical and contemporary events we aimed to disentangle the factors underlying the observed pat-terns. As such, in parallel with the spatial patterning of genetic diversity, the broad-scale sampling also allowed for testing the effects of species intrinsic traits and environmental characteristics on observed levels of genetic diversity. Data obtained allowed us to address the following questions: (1) Is the genetic diversity of endemic fish populations influenced by the specific status of each population and by other characteristics that are intrinsic to the species, such as the maximum size or migratory behaviour? (2) Is the genetic diversity of each population influenced by the area and by the hydrological regime of the river drainages they inhabit? (3) Does latitude influence genetic diversity, given that populations from northern rivers are subjected to lower temperatures and fewer temperature fluctuations, contrasting with those from southern rivers which are exposed to higher temperatures, lower oxygen concentrations and cyclical regimes of floods and droughts (Magalhães, Schlosser & Collares-Pereira, 2003;Henriques, Sousa & Coelho, 2010;Füssel et al., 2012;Jesus, Inácio & Coelho, 2013)? (4) Do populations of species with wider distribution ranges show higher overall genetic diversity than those with more geographically confined distributions? and (5) do populations inhabiting isolated drainages show less genetic diversity than those occupying interconnected sub-basins of a dendritic river basin?
MATERIALS AND METHODS
Target species(Collares-Pereira, 1980),Iberochondrostoma almacai(Coelho, Mesquita & Collares-Pereira, 2005),Pseudochondrostoma polylepis(Steindachner, 1865),Pseudochondrostoma duriense (Coelho, 1985),Pseudochondrostoma willkommii(Steindachner, 1866), Luciobar-bus microcephalus(Almaça, 1967),Luciobarbus bocagei(Steindachner, 1865),Luciobarbus sclateri(Günther, 1868),Luciobarbus comizo(Steindachner, 1865),Squalius carolitertii (Doadrio, 1987),Squalius pyrenaicus(Günther, 1868),Squalius torgalensis(Bogutskaya, Rodrigues & Collares-Pereira, 1998) andSqualius aradensis(Bogutskaya, Rodrigues & Collares-Pereira, 1998). Of all the cyprinids native to Portugal, only four species [Squalius alburnoides(Steindachner, 1866), Luciobarbus steindachneri(Almaça, 1967), Achondrostoma arcasii(Steindachner, 1866) andIberochondrostoma olisiponensis(Gante, Santos & Alves, 2007)] were not includeda prioridue to their hybridogenetic origin (Sousa-Santos, Collares-Pereira & Almada, 2007), uncertain taxonomic classification (Robalo et al., 2006;Gante et al., 2015) or extreme scarcity in wild populations ( Sousa-Santos et al., 2014a).L. microcephaluswas posteriorly excluded from the analyses due to the low number of individuals sampled in each population (see below).
Sampling
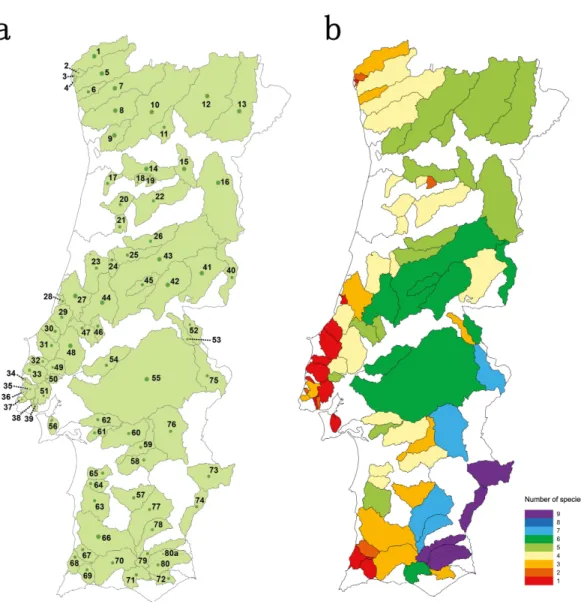
Thirty four river basins were sampled in the Portuguese mainland hydrographical net-work. The six largest river basins (Douro, Vouga, Mondego, Tagus, Sado and Guadiana) were further sub-divided into 47 sub-basins resulting in a total number of 81 geographical units sampled (Table S1andFig. 1A). Populations for which less than 15 individuals were collected were excluded from analyses.
Fish were collected with standard wadable electrofishing procedures (CEN, 2003) and returned to the water immediately after non-destructive sampling. Collected fin clips were preserved in 96% ethanol and vouchers were kept at the tissue collection of MARE/ISPA for subsequent DNA extraction, amplification and sequencing. Permits for field work were given by ICNF (permit number 176/2010/CAPT and 53/2012/CAPT).
DNA extraction, amplification and sequencing
Total genomic DNA was extracted from fin clips using REDExtract-N-Amp Tissue PCR kits (Sigma-Aldrich) following the manufacturer’s instructions. The mitochondrial cytochromeb(cytb) gene was amplified using the primers LCB1-new ACTTGAAGAAC-CACCGTTG (adapted from the LCB1 primer described byBrito et al., 1997) and HA-CAACGATCTCCGGTTTACAAGAC (Schmidt & Gold, 1993). PCR conditions were the following: 35×(94◦C 1′+50◦C 1′+72◦C 2′). PCR products were purified and sequenced in the forward direction using the LCB1-new primer, at GATC Biotech (Konstanz,
Germany). Obtained sequences were trimmed at the 3′and 5′ends so they had the same length for all the individuals sampled (720bp) and deposited in GenBank (KU366823–
KU370500).
DNA analyses and gene diversity mapping
ARLEQUIN software package V.3.5 (Excoffier & Lischer, 2010) was used to quantify the number of private haplotypes for each population (i.e., haplotypes that were exclusive for the considered population and that were not found elsewhere). These values were then used to calculate the percentage of private haplotypesper population (of all the haplotypes found in the considered population) and the average percentage of private haplotypesperpopulation for each target species (%NPH). Mean, standard deviation,
minimum and maximum values of %NPHwere obtained with EXCEL 2013 (MicrosoftR).
ARLEQUIN was also used to estimate gene diversity (hindex, defined as the proba-bility that two randomly chosen haplotypes are different in a sample; used as a measure of haplotype diversity for haploid data), nucleotide diversity (πindex, defined as the probability that two randomly chosen homologous nucleotides are different) and mean number of pairwise differences (MNPD, defined as the mean number of differences between all pairs of haplotypes in a sample) for each population. Analyses of molecular variance (AMOVA) were also performed with ARLEQUIN.
Values obtained for thehindex were mapped in the sampling areas by Yris Graphics (www.yrisgraphics.com). This index, which varies between 0 and 1, reflects the probability of two randomly chosen haplotypes being different in a sample, and was selected to illustrate haplotype diversity of sampled populations. Using this index, diversity classes (common for all species) were established, allowing for an automatic visual inspection of the diversity level of distinct populations. The maps and database are available for download at the project’s webpage (www.fishatlas.net).
Data analyses and hypothesis testing
Populations, regardless of species, were considered the unit of comparison. In order to test whether the obtained genetic diversity pattern was influenced by species’ intrinsic traits and extrinsic factors, data concerning 8 variables were collected and organized in a matrix (Table S2). Six of these variables are categorical: (1) ‘‘species’’ (with 16 categories, corresponding to the 16 species studied:L. bocagei, L. sclateri, L. comizo, P. duriense, P. polylepis, P. willkommii, I. almacai, I. lusitanicum, I. lemmingii, S. carolitertii, S. pyrenaicus, S. aradensis, S. torgalensis, A. hispanica, A. oligolepisandA. occidentale), and the dichotomous variables (2) ‘‘hydrological regime,’’ (3) ‘‘latitude,’’ (4) ‘‘migratory behaviour,’’ (5) ‘‘species range,’’ and (6) ‘‘inter-basin connectivity.’’ The quantitative variables ‘‘drainage area’’ and ‘‘species maximum size’’ were also included in the matrix.
network (downloaded fromhttp://sniamb.apambiente.pt/Home/Default.htm) by using the polygon area as implemented in QGIS 2.10.1 software. Whenever a population inhabits a sub-basin of a larger basin, the area of the sub-drainage was considered, as for the studied small fish species the main course of a large river may represent a natural barrier to gene flow.
Individual linear regressions were performed to test the effect of each of these inde-pendent variables onh,π and MNPD indices calculated for each population. Dummy variables were created for the categorical independent variable ‘‘species,’’ enabling the use of the 16 categories of this variable in a regression model.
Predictor variables with significant effects (α <0.05) were selected as candidate variables for the modelling process. Then, a hierarchical linear regression was performed, first including all selected variables (excluding ‘‘species’’) with a stepwise method and, finally including the categorical variable ‘‘species.’’ This procedure sought to first analyse the effect of each of the variables regardless of the effect of ‘‘species.’’ This variable was then included to test whether other aspects intrinsic to the species, not measured by the remaining independent variables, were significant. This method was adopted independently for each of the three dependent variables:h,π and MNPD. We search for the presence of outliers and excluded them to avoid spurious trends or masking of valid ones.
For the analyses of each species separately, given the lower number of samples, non-parametric tests were performed: Spearman’sρ, to test the correlation between ‘‘drainage area’’ and each of the dependent variables; and Mann–Whitney’sUtests to compare groups (populations inhabiting connected or unconnected water bodies; populations occurring in permanent or temporary river basins; and northern and southern populations) concerning their genetic diversity (h,π and MNPD indices). All statistical analyses were conducted using IBM SPSS Statistics, version 22 (IBM Corporation, 2013).
RESULTS
Species richness concerning the Portuguese native cyprinid ichthyofauna varied between 1 and 9 speciesper river basin/sub-basin (Fig. 1B). The larger river basins, such as those of the Douro, Tagus and Guadiana, accommodate the highest values of species richness, while in the smaller coastal river basins draining into the Atlantic only one to three native cyprinids were found (Fig. 1B).
Patterns of genetic diversity
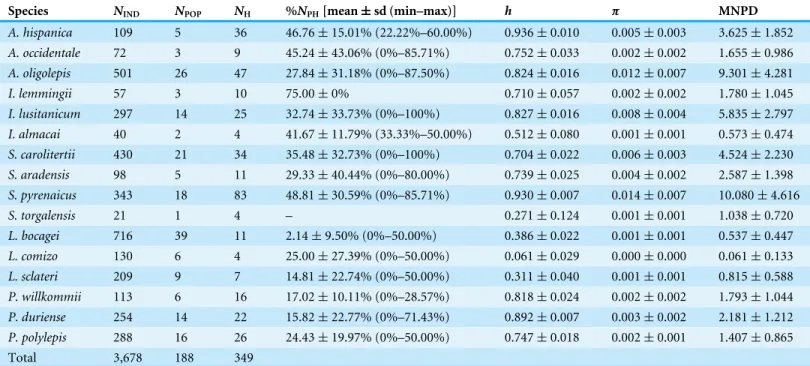
In general, populations of the small sized non-migratory speciesA. hispanica,A. oligolepis, I. lemmingii, I. lusitanicum, I. almacai, S. aradensis, S. carolitertiiandS. pyrenaicusshow higher percentages of private haplotypes (average valuesper species ranging from 27.84% to 75.00%,Table 1) than populations of the larger sized potamodromous speciesL. bocagei, L. comizo, L. sclateri, P. willkommii, P. duriense andP. polylepis(average valuesper species ranging from 2.14% to 25.00%,Table 1).
Table 1 Genetic diversity of populations.Number of sampled individuals (NIND), number of sampled populations (NPOP), number of haplotypes retrieved (NH) and average percentage of private haplotypes per population (%NPH), for each target species. Values obtained for haplotype diversity (h), nucleotide diversity (π) and mean number of pairwise differences (MNPD) are also presented.
Species NIND NPOP NH %NPH[mean±sd (min–max)] h π MNPD
A. hispanica 109 5 36 46.76±15.01% (22.22%–60.00%) 0.936±0.010 0.005±0.003 3.625±1.852
A. occidentale 72 3 9 45.24±43.06% (0%–85.71%) 0.752±0.033 0.002±0.002 1.655±0.986
A. oligolepis 501 26 47 27.84±31.18% (0%–87.50%) 0.824±0.016 0.012±0.007 9.301±4.281
I. lemmingii 57 3 10 75.00±0% 0.710±0.057 0.002±0.002 1.780±1.045
I. lusitanicum 297 14 25 32.74±33.73% (0%–100%) 0.827±0.016 0.008±0.004 5.835±2.797
I. almacai 40 2 4 41.67±11.79% (33.33%–50.00%) 0.512±0.080 0.001±0.001 0.573±0.474
S. carolitertii 430 21 34 35.48±32.73% (0%–100%) 0.704±0.022 0.006±0.003 4.524±2.230
S. aradensis 98 5 11 29.33±40.44% (0%–80.00%) 0.739±0.025 0.004±0.002 2.587±1.398
S. pyrenaicus 343 18 83 48.81±30.59% (0%–85.71%) 0.930±0.007 0.014±0.007 10.080±4.616
S. torgalensis 21 1 4 – 0.271±0.124 0.001±0.001 1.038±0.720
L. bocagei 716 39 11 2.14±9.50% (0%–50.00%) 0.386±0.022 0.001±0.001 0.537±0.447
L. comizo 130 6 4 25.00±27.39% (0%–50.00%) 0.061±0.029 0.000±0.000 0.061±0.133
L. sclateri 209 9 7 14.81±22.74% (0%–50.00%) 0.311±0.040 0.001±0.001 0.815±0.588
P. willkommii 113 6 16 17.02±10.11% (0%–28.57%) 0.818±0.024 0.002±0.002 1.793±1.044
P. duriense 254 14 22 15.82±22.77% (0%–71.43%) 0.892±0.007 0.003±0.002 2.181±1.212
P. polylepis 288 16 26 24.43±19.97% (0%–50.00%) 0.747±0.018 0.002±0.001 1.407±0.865
Total 3,678 188 349
pattern (Table 1): L. comizo presented the lowest values (π=0.000 ± 0.000 and MNPD=0.061 ± 0.133, respectively) andS. pyrenaicusthe highest (π=0.014 ± 0.007 and MNPD=10.080 ± 4.616, respectively).
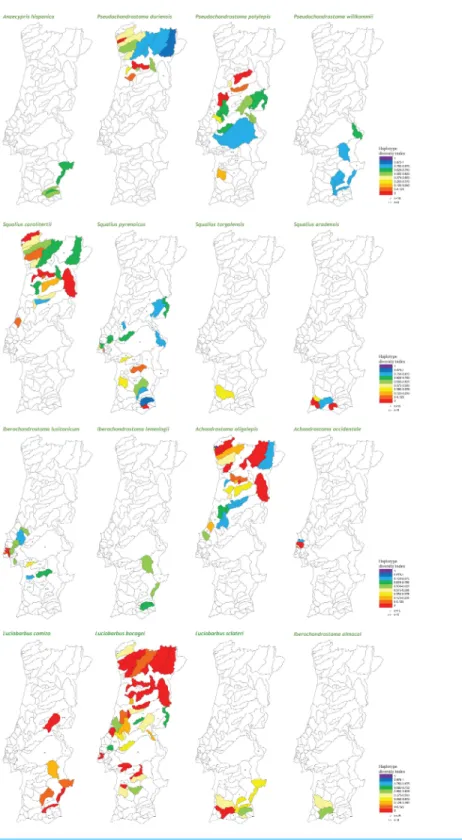
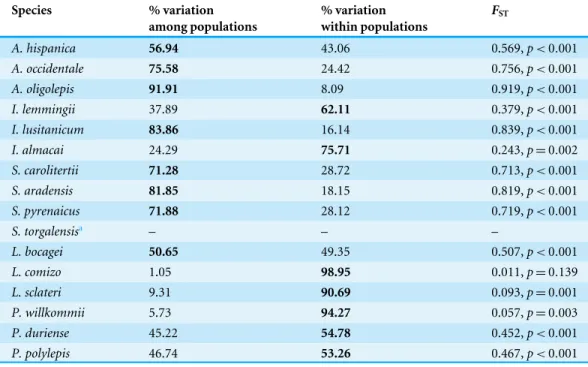
At the population level, the spatial distribution of haplotype diversity values revealed distinct levels of diversity among populations of the same species and distinct patterns among species (Fig. 2). Indeed, analyses of molecular variance (AMOVAs) conducted for each target species separately revealed two contrasting patterns: in eight of the 15 species most of the variation (ranging from 50.65% for L. bocageito 91.91% for A. oligolepis) could be attributed to differences among populations, while for the remaining seven species 53.26% (forP. polylepis) to 98.95% (forL. comizo) of the variation was explained by genetic differentiation within populations (Table 2).
Genetic diversity determinants
Table 2 AMOVAs.Results from the analyses of molecular variance (AMOVAs) conducted independently for each target species. For each species, the highest % of variation explained is presented in bold. Signifi-cantFSTvalues (p<0.005) indicate significant evidence of population subdivision.
Species % variation among populations
% variation within populations
FST
A. hispanica 56.94 43.06 0.569,p<0.001
A. occidentale 75.58 24.42 0.756,p<0.001
A. oligolepis 91.91 8.09 0.919,p<0.001
I. lemmingii 37.89 62.11 0.379,p<0.001
I. lusitanicum 83.86 16.14 0.839,p<0.001
I. almacai 24.29 75.71 0.243,p=0.002
S. carolitertii 71.28 28.72 0.713,p<0.001
S. aradensis 81.85 18.15 0.819,p<0.001
S. pyrenaicus 71.88 28.12 0.719,p<0.001
S. torgalensisa – – –
L. bocagei 50.65 49.35 0.507,p<0.001
L. comizo 1.05 98.95 0.011,p=0.139
L. sclateri 9.31 90.69 0.093,p=0.001
P. willkommii 5.73 94.27 0.057,p=0.003
P. duriense 45.22 54.78 0.452,p<0.001
P. polylepis 46.74 53.26 0.467,p<0.001
Notes.
aAMOVA was not conducted for this species since it has only one population.
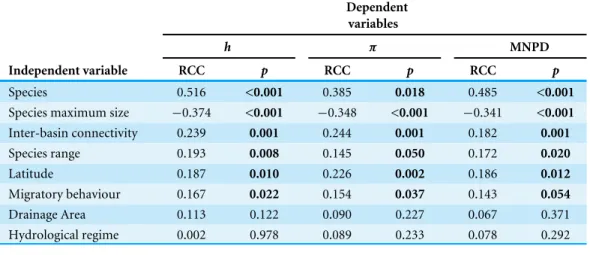
Linear regressions between selected independent variables and h values showed that ‘‘species maximum size,’’ ‘‘inter-basin connectivity,’’ ‘‘species range,’’ ‘‘latitude,’’ ‘‘migratory behaviour’’ and ‘‘species’’ had a significant effect on the diversity of populations (Table 3). The independent variables ‘‘drainage area’’ and ‘‘hydrological regime’’ had no significant effect on haplotype diversity (Table 3). After the removal of the outliers, linear regressions usingπand MNPD as dependent variables retrieved the same pattern (Table 3). Regarding the effect on thehindex, the inclusion of all independent variables (excluding ‘‘species’’) in the linear regression, using a stepwise method, indicated that the best fit model only includes ‘‘species maximum size,’’ ‘‘inter-basin connectivity’’ and ‘‘latitude.’’ Non-significant predictor variables ‘‘range’’ and ‘‘migratory behaviour’’ were excluded from the analysis (Table 4). This model explains 26.7% of the haplotype diversity variance (Table 4). The inclusion of the variable ‘‘species’’ in a hierarchical regression analysis had a significant effect, increasing the explained variance to 32.3% (Table 4).
When applying the same stepwise procedure to the remaining two genetic diversity indices, the results from the linear regressions showed a similar pattern: the same variables were included in the model (‘‘species maximum size,’’ ‘‘inter-basin connectivity,’’ ‘‘latitude’’ and ‘‘species’’) and the best fit model explained 33.7% and 26.7% of the variance, respectively, forπ and MNPD (Table 4).
Table 3 Correlation coefficients.Regression correlation coefficients (RCC) and their respectivep-values obtained for the linear regressions between the dependent variables haplotype diversity (h), nucleotide di-versity (π) and mean number of pairwise differences (MNPD) and eight independent variables.
Dependent variables
h π MNPD
Independent variable RCC p RCC p RCC p
Species 0.516 <0.001 0.385 0.018 0.485 <0.001 Species maximum size −0.374 <0.001 −0.348 <0.001 −0.341 <0.001 Inter-basin connectivity 0.239 0.001 0.244 0.001 0.182 0.001 Species range 0.193 0.008 0.145 0.050 0.172 0.020 Latitude 0.187 0.010 0.226 0.002 0.186 0.012 Migratory behaviour 0.167 0.022 0.154 0.037 0.143 0.054 Drainage Area 0.113 0.122 0.090 0.227 0.067 0.371 Hydrological regime 0.002 0.978 0.089 0.233 0.078 0.292
Table 4 Hierarchical regression models.Results of the different hierarchical regression models between selected independent variables and the three genetic diversity indices (haplotype diversity,h; nucleotide diversity,π; and mean number of pairwise differences, MNPD) as dependent variables. For each measure of genetic diversity a series of hierarchical models were fitted based on four key predictor variables (species maximum size, MS; inter-basin connectivity, IBC; latitude, L; and species, S). Four other measured vari-ables were not included because they were shown to be individually unimportant (see Methods). For each model we present adjustedR2(coefficient of determination),1R(R2change), test statistics (Ftest statis-tics) andp-values.
Variables included AdjustedR2 1R Test statistics p
Dependent variable:h
Model I MS 0.135 0.135 F(1,186)=30.214 <0.001
Model II MS, IBC 0.231 0.096 F(1,186)=24.126 <0.001
Model III MS, IBC, L 0.267 0.036 F(1,184)=10.139 0.002
Model IV MS, IBC, L, S 0.323 0.056 F(14,170)=2.087 0.015
Dependent variable:π
Model I MS 0.116 0.116 F(1,181)=24.896 <0.001
Model II MS, IBC 0.213 0.097 F(1,180)=23.288 <0.001
Model III MS, IBC, L 0.269 0.053 F(1,179)=14.762 <0.001
Model IV MS, IBC, L, S 0.337 0.068 F(14,165)=2.322 0.006
Dependent variable: MNPD
Model I MS 0.111 0.058 F(1,181)=23.744 <0.001
Model II MS, IBC 0.171 0.060 F(1,180)=14.013 <0.001
Model III MS, IBC, L 0.208 0.037 F(1,179)=9.557 0.002
Model IV MS, IBC, L, S 0.267 0.059 F(14,165)=2.015 0.019
regarding ‘‘latitude,’’ southern populations exhibited higher levels of haplotype diversity and mean number of pairwise differences (meanh=0.417 ± 0.292, N =108; mean π=0.00126 ± 0.0.00119, N=104; mean MNPD=0.871 ± 0.830, N=103) than northern populations (meanh=0.302±0.308,N=80; meanπ=0.000749 ±0.000974, N =79; mean MNPD=0.570 ± 0.747,N=80), a tendency which was already evident from the diversity mapping depicted for the National Genetic Atlas (Fig. 2).
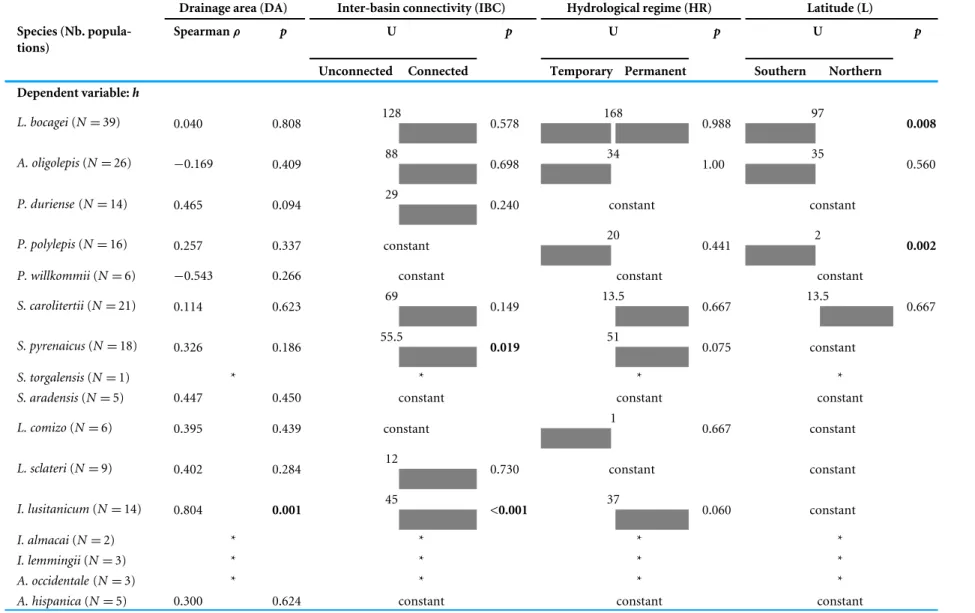
It is worth mentioning that the variable ‘‘species’’ was significantly correlated with the three genetic diversity indices (Table 3) and was included in the model which best explains the observed variance for all of the genetic diversity indices (Table 4). The inclusion of this variable in the best fit models highlights the influence of species intrinsic idiosyncrasies other than those tested explicitly herein (migratory behaviour, maximum size and range). Since it is not possible, with the present dataset, to disentangle which intrinsic traits influence genetic diversity the most, we further analysed which of the extrinsic factors (‘‘drainage area,’’ ‘‘inter-basin connectivity,’’ ‘‘latitude’’ and ‘‘hydrological regime’’) were determinant for the genetic diversity pattern observed for each species. The results presented inTable 5
show that the environmental variables tested have no influence on the genetic diversity for most of the species, except for four species (L. bocagei, P. polylepis, S. pyrenaicusandI. lusitanicum).
More specifically, all of the genetic diversity indices were significantly correlated with ‘‘inter-basin connectivity’’ forI. lusitanicumand with ‘‘latitude’’ forL. bocagei and P. polylepis(Table 5). The haplotype diversity obtained was also significantly correlated with ‘‘inter-basin connectivity’’ forS. pyrenaicusand with ‘‘drainage area’’ forI. lusitanicum (Table 5).
DISCUSSION
The sampling of a broad number of populations throughout the distribution range of cyprinid species in Portugal allowed for the publication of the first National Genetic Atlas of native cyprinid ichthyofauna (available online atwww.fishatlas.net). The analysis of the genetic diversity variation highlighted differences among populations within species and also differences between species with identical distribution areas and threat categories. In general, the percentage of private haplotypes and the average values of genetic diversity per population were higher for small sized non-migratory species of the generaAnaecypris, Achondrostoma, IberochondrostomaandSqualiusthan for the larger sized potamodromous LuciobarbusandPseudochondrostomaspecies, raising the hypothesis of species intrinsic determinants of genetic diversity. Also, the analyses of molecular variance revealed that for some species most of the variance could be attributed to differences among populations, while in others to differentiation within populations. The spatial distribution of the genetic diversity was undoubtedly distinct for co-occurring species, but what are the underlying causes of such distinct patterns?
Table 5 Non-parametric tests for all the species.Results of the non-parametric tests (Spearma’sρand Mann–Whitney’sU) conducted separately to each species to test the correlation between the genetic diversity indices (h,πand MNPD) and the independent variables ‘‘drainage area,’’ ‘‘inter-basin connectivity,’’ ‘‘hydrological regime’’ and ‘‘latitude.’’ All tests were bilateral andp-values were Bonferrori corrected for multiple comparisons. Significantp-values (p<0.005) are highlighted in bold and the direction of the Mann–Whitney’sUtests was indicated: the group (unconnected vs. connected, temporary vs permanent, and southern vs northern) with the highest me-dian was shaded in grey. Analyses were not conducted for species with less than 5 populations (marked with a ‘‘*’’ symbol). In some cases (marked as ‘‘constant’’), all the populations of a species showed the same values for a given categorical variable (e.g., all were classified as southern regarding ‘‘latitude’’).
Drainage area (DA) Inter-basin connectivity (IBC) Hydrological regime (HR) Latitude (L)
Species (Nb. popula-tions)
Spearmanρ p U p U p U p
Unconnected Connected Temporary Permanent Southern Northern Dependent variable:h
128 168 97
L. bocagei(N=39) 0.040 0.808 0.578 0.988 0.008
88 34 35
A. oligolepis(N=26) −0.169 0.409 0.698 1.00 0.560
29
P. duriense(N=14) 0.465 0.094 0.240 constant constant
20 2
P. polylepis(N=16) 0.257 0.337 constant 0.441 0.002
P. willkommii(N=6) −0.543 0.266 constant constant constant
69 13.5 13.5
S. carolitertii(N=21) 0.114 0.623 0.149 0.667 0.667
55.5 51
S. pyrenaicus(N=18) 0.326 0.186 0.019 0.075 constant
S. torgalensis(N=1) * * * *
S. aradensis(N=5) 0.447 0.450 constant constant constant
1
L. comizo(N=6) 0.395 0.439 constant 0.667 constant
12
L. sclateri(N=9) 0.402 0.284 0.730 constant constant
45 37
I. lusitanicum(N=14) 0.804 0.001 <0.001 0.060 constant
I. almacai(N=2) * * * *
I. lemmingii(N=3) * * * *
A. occidentale(N=3) * * * *
A. hispanica(N=5) 0.300 0.624 constant constant constant
Sousa-Sant
os
e
t
al.
(2016),
P
eerJ
,
DOI
Table 5(continued)
Drainage area (DA) Inter-basin connectivity (IBC) Hydrological regime (HR) Latitude (L)
Species (Nb. popula-tions)
Spearmanρ p U p U p U p
Unconnected Connected Temporary Permanent Southern Northern Dependent variable:π
133 154 94
L. bocagei(N=39) 0.074 0.074 0.462 0.670 0.006
94 33 31
A. oligolepis(N=26) −0.088 0.669 0.482 0.940 0.389
30.5
P. duriense(N=14) 0.251 0.387 0142 constant constant
18 1
P. polylepis(N=16) 0.257 0.337 constant 0.320 <0.001
P. willkommii(N=6) −0.486 0.329 constant constant constant
63 12.5 13.5
S. carolitertii(N=21) 0.226 0.338 0.183 0.700 0.667
51 49
S. pyrenaicus(N=18) 0.094 0.711 0.075 0.117 constant
S. torgalensis(N=1) * * * *
S. aradensis(N=5) 0.447 0.450 constant constant constant
1
L. comizo(N=6) 0.339 0.510 constant 0.667 constant
14
L. sclateri(N=9) 0.485 0.185 0.413 constant constant
45 30
I. lusitanicum(N=14) 0.453 0.120 <0.001 0.364 constant
I. almacai(N=2) * * * *
I. lemmingii(N=3) * * * *
A. occidentale(N=3) * * * *
A. hispanica(N=5) 0.1 0.873 constant constant constant
(continued on next page)
Sousa-Sant
os
e
t
al.
(2016),
P
eerJ
,
DOI
Table 5(continued)
Drainage area (DA) Inter-basin connectivity (IBC) Hydrological regime (HR) Latitude (L)
Species (Nb. popula-tions)
Spearmanρ p U p U p U p
Unconnected Connected Temporary Permanent Southern Northern Dependent variable:
MNPD
133 154 94
L. bocagei(N=39) 0.074 0.656 0.462 0.670 0.006
94 33 31
A. oligolepis(N=26) −0.088 0.669 0.484 0.940 0.389
30.5
P. duriense(N=14) 0.251 0.387 0.142 constant constant
18 1
P. polylepis(N=16) 0.257 0.337 constant 0.320 <0.001
P. willkommii(N=6) −0.486 0.329 constant constant constant
70 13.5 13.5
S. carolitertii(N=21) 0.185 0.422 0.128 0.667 0.667
41 51
S. pyrenaicus(N=18) −0.125 0.621 0.443 0.075 constant
S. torgalensis(N=1) * * * *
S. aradensis(N=5) 0.200 0.747 constant constant constant
1
L. comizo(N=6) 0.395 0.439 constant 0.667 constant
14 0.413
L. sclateri(N=9) 0.485 0.185 constant constant
45 30
I. lusitanicum(N=14) 0.453 0.120 <0.001 0.364 constant
I. almacai(N=2) * * * *
I. lemmingii(N=3) * * * *
A. occidentale(N=3) * * * *
A. hispanica(N=5) 0.1 0.873 constant constant constant
Sousa-Sant
os
e
t
al.
(2016),
P
eerJ
,
DOI
fecundity, dispersal ability), and (3) landscape features, including human-mediated habitat changes (e.g., damming, river dewatering, destruction of optimal habitats) (Osborne et al., 2014). Determinants of genetic variation have been, however, difficult to identify and/or disentangle (Husemann et al., 2012;Leffler et al., 2012).
Historical determinants of genetic diversity
The present study, targeting multiple co-distributed species of primary freshwater fish, assessed the relative role of historicalversuscontemporary factors affecting genetic diversity. Indeed, the origin of Iberian lineages ofAnaecypris, ex-Chondrostoma, Luciobarbusand Squaliusdates back to the Miocene, around 19–7.7 Mya (Levy, Doadrio & Almada, 2008; Gante, 2011). Speciation within these genera and subsequent diversification must have occurred through the same available connections between paleobasins until the Pleistocene-Holocene, when the current hydrographical network became established (Sousa-Santos, Collares-Pereira & Almada, 2007;Gante et al., 2009;Almada & Sousa-Santos, 2010; Sousa-Santos et al., 2014a;Sousa-Santos et al., 2014b;Mesquita et al., 2005). As such, if populations responded identically to landscape rearrangements and climatic conditions through time, one would expect the patterns of genetic diversity to be similar for co-occurring species, despite their intrinsic traits.
It is known that during the last glacial maximum (LGM, 0.018 Mya) the ice sheet reached the central part of the Portuguese territory, presumably as far as the Tagus River (Fig. 1A,Dias et al., 2000). Previous phylogenetic data, obtained with a calibrated molecular marker (cytochromeb), indicates that, at the time of the LGM, all contemporary species were already differentiated (Levy, Doadrio & Almada, 2008;Gante, 2011). Additionally, the extirpation of fish populations at northern latitudes and the persistence of Iberian fish species in southern refugia throughout the Quaternary had already been reported by several authors (e.g.,Mesquita et al., 2005;Gante et al., 2009;Almada & Sousa-Santos, 2010;Araguas et al., 2013;Sousa-Santos et al., 2014b;Perea & Doadrio, 2015). Thus, as a consequence of the LGM, species inhabiting northern river basins should exhibit similar low levels of genetic diversity. Data presented in this paper shows that although this is true forL. bocagei, it is far from being a generalized pattern among northerly distributed species. The relatively high levels of genetic diversity observed inA. oligolepis, P. duriense andS. carolitertii could be explained by posterior recolonizations of northern streams by migrants from southern refugia, as suggested for many aquatic species (e.g.,Hewitt, 2004;Gómez & Lunt, 2007;Provan & Bennett, 2008;Roselló & Morales, 2010;Oberdoff et al., 2011). However, this hypothesis is not plausible for the target species since at the time of the LGM most of the connections between river basins had already ceased (Pais et al., 2012). Since differences between species with identical distribution areas were detected for the three genetic diversity indices used, one must postulate than contemporary determinants of genetic diversity must have played a more significant role than historical ones.
Potential contemporary determinants of genetic diversity
declining population sizes and genetic diversity depletion, ultimately leading to local extinctions (Frankham, 1995;Spielman, Brook & Frankham, 2004;Ewers & Didham, 2006; Lowe & Allendorf, 2010).Husemann et al. (2012)found that frequent local extinction and re-colonization cycles in seasonal pools may even obscure historical signatures in the genetic patterns of some North American cyprinids as a result of repeated bottlenecks and population expansions. Demographic and genetic changes will impact species differently, according to their dispersal ability, life-history characteristics and habitat requirements (Faulks, Gilligan & Beheregaray, 2011).
Ecological traits such as tolerance to stagnant disconnected summer pools (Husemann et al., 2012), preference for flowing headwaters (Faulks, Gilligan & Beheregaray, 2011; Buonerba et al., 2015) or reproductive strategies (benthic vs. pelagic spawning,Osborne et al., 2014) were pointed out as determinants of genetic diversity in a vast array of freshwater fish. Our results showed that there are intrinsic characteristics (maximum size attained) and environmental characteristics (inter-basin connectivity and latitude) that are clearly determinant for genetic differences between populations. The variable ‘‘species’’ includes additional intrinsic characteristics other than those considered explicitly that could be causing the observed patterns of genetic variation. The relevance of this component is underlined by its significant correlation with genetic diversity indices and by its inclusion in the best fit model (together with ‘‘species maximum size,’’ ‘‘inter-basin connectivity’’ and ‘‘latitude’’ explained 26.7%–33.7% of the variance). The causes explaining the remaining 66.3%–73.3% of the genetic diversity variance remained currently unexplained and should ideally be addressed in future studies.
(i) Species intrinsic traits
The species maximum size was negatively correlated with genetic diversity, a feature that was already reported for several taxa (e.g.,Romiguier et al., 2014). Body size is a good predictor of maturation age and egg size (Moyle & Cech, 2004): small sized fish are precocious spawners and lay more eggs per batch (r-strategists) than larger sized fish that typically mature later and produce a smaller number of eggs (k-strategists). As a consequence, in disturbed environments that impose shorter than normal life spans, it is expected that small sized species would be favoured as they will most likely leave more progeny than larger species and will presumably be less prone to genetic depletion due to inbreeding and genetic drift (more intense in populations with small effective sizes,Gilpin & Soulé, 1986;Vrijenhoek, 1994). As argued byRomiguier et al. (2014), the demographic impact of environmental perturbations will depend on the species life-history strategy: typically genetic diversity levels will be higherr-strategists than ink-strategists irrespective of their current demography which, according to the authors, also explains whyr-strategists might be in risk of extinction without any warning genetic signal (see ‘‘Implications for conservation’’ below).
(ii) Environmental characteristics
The results show that populations occurring in sub-basins connected with other water bodies had higher genetic diversity than those occurring in unconnected river basins. As the drainage had no significant effect on the genetic diversity of the populations inhabiting them, the observed effect of the inter-basin connectivity may be related to (1) the possibility of inter-population gene exchange or (2) historical features. This later explanation relates to the fact that the colonization of Iberia by the ancestral lineages of primary freshwater fish seems to have followed a westward path (from the Pyrenees to the margins), with the major basins as vehicles for colonizers and playing a crucial role in the radiation of these species throughout the Peninsula (e.g.,Gante et al., 2009;Almada & Sousa-Santos, 2010;Perea & Doadrio, 2014). As a consequence, the unconnected river basins that showed lower levels of genetic diversity are precisely the small coastal streams from the west and southwest margins of Iberia which received their colonizers through past connections with the wider and dendritic river basins. Hence, this pattern may be a result of a decrease in genetic diversity along routes of colonization (Taberlet et al., 1998).
Future studies should also address connectivity at an intrabasin scale, by quantifying the number of unsurmountable barriers preventing gene flow. Predictions point to lower global levels of genetic diversity due to fragmentation and population declines expected to occur in highly impounded river basins (e.g.,Alò & Turner, 2005;Wofford, Gresswell & Banks, 2005;Raeymaekers et al., 2008;Blanchet et al., 2010).
Genetic diversity also seems to be related with latitude: southern populations show higher levels of haplotype diversity and mean number of pairwise differences than northern populations. This pattern may be the result of a higher impact of glaciations in northern populations, andin situsurvival in the southernmost populations, far from the glaciers (e.g.,Hoagstrom & Berry, 2006;Abellán & Svenning, 2014;Osborne et al., 2014). The successive cycles of expansion–contraction of glacial ice sheets must have played an extremely important role in shaping the distribution oftaxaand in inducing population declines and local extinctions (Rowe et al., 2004). However, if glaciations were the main driver of genetic diversity depletion in northern populations, one should expect that all those populations inhabiting northern rivers (where the effect of the LGM was more effective, as described by Dias et al., 2000) would exhibit low levels of genetic diversity independently of the species considered, which was not the case. This expectation would fail if species inhabiting northern rivers had distinct tolerances to low water temperatures and, consequently, showed differential survival during glacial periods. Additionally, the effect of temperature should not be ruled out since it is known that high water temperatures may induce genetic damage and errors in DNA replication (Gillooly et al., 2005), which may eventually promote higher levels of diversity in the populations inhabiting warmer southern rivers.
Finally, when looking to each isolated species rather than using populations as the comparison units, the results showed that environmental characteristics did not explain the genetic diversity variance for most of the species, with the exception of the potamodromous large sized L. bocagei andP. polylepisand the smaller sized non-potamodromousS. pyrenaicus andI. lusitanicum. These species showed higher genetic diversity in larger river basins (I. lusitanicum), in southern latitudes (L. bocagei and P. polylepis) and in connected sub-basins (S. pyrenaicusandI. lusitanicum). These results are in agreement with the view of Kahilainen, Puurtinen & Kotiaho (2014)regarding the differential influence of environmental characteristics on the genetic diversity of co-occurring species and highlights the need to establish specific rather than generalized management and conservation plans.
In conclusion, as multiple intrinsic and extrinsic drivers may be acting synergistically, future studies should ideally be conducted for each species separately and should adopt sampling procedures that would allow for an exhaustive collection of data concerning habitat-, landscape- and species-related variables.
Implications for conservation
Different populations of the same species exhibit not only distinct gene pools but also distinct genetic diversity levels, reinforcing the need to preserve them as individual entities and to establish Operational Conservation Units (OTU’s), as defined byDoadrio, Perdices & Machordom (1996).
there is a time lag between the action of factors causing genetic change and the change itself, i.e., changes or disturbances that impact populations may not be immediately reflected in genetic metrics (Epps & Keyghobadi, 2015). The combination of long term genetic and demographic surveys of threatened species should be the norm in conservation practices, as suggested byPaz-Vinas et al. (2013).
The dataset produced under the scope of the FISHATLAS project is available to be used by managers, decision-makers and authorities not only in the present context of hydrological resources management aiming to minimize the effects of climate changes, but also for the implementation of conservation and management plans aiming to preserve native Iberian cyprinids. More specifically, these data may allow for the definition of priorities in conservation policies, when choices have to be made concerning which populations of each species must be preserved first, a decision that must take into account the maximization of genetic diversity. Although it is widely recognized that genetic data should be taken into account to draw conservation guidelines and prioritize conservation actions (Frankham, 2010), studies on conservation genetics of Iberian cyprinids are recent (Salgueiro et al., 2003; Robalo et al., 2007;Sousa et al., 2007;Almada & Sousa-Santos, 2010;Sousa et al., 2010;Sousa-Santos et al., 2014a;Sousa-Santos et al., 2014b) and practical applications of their conclusions and suggestions are still scarce. The results presented herein constitute a comprehensive baseline dataset which, supplemented with future monitoring of the observed genetic patterns, will be crucial to support the establishment of conservation priorities, design reserves, signal target populations forex situconservation, define OUT’s, and proposeex situandin situactions to allow for the long-term survival of endangered species and preservation of their genetic integrity.
ACKNOWLEDGEMENTS
We are grateful to G Lemos, C Lima, P Coelho, L Ferreira, C Carrapato, A Albuquerque, R Rivaes, G Duarte, S Rodriguez, RA Pizarro, J Oliveira and P Pinheiro for their help in the field. We dedicate this paper to the loving memory of Vítor Almada to whom we owe much of what was done for the preservation of native freshwater fish species in Portugal.
ADDITIONAL INFORMATION AND DECLARATIONS
Funding
Grant Disclosures
The following grant information was disclosed by the authors: European Fund for Economic and Regional Development (FEDER).
National Funds: PEst-OE/MAR/UI0331/2011, PTDC/AAC-CLI/103110/2008. FCT: SFRH/BPD/29774/2006, SFRH/BD/44938/2008, SFRH/BPD/94686/2013.
Competing Interests
The authors declare there are no competing interests.
Author Contributions
• Carla Sousa-Santos and Ana M. Pereira conceived and designed the experiments, performed the experiments, analyzed the data, contributed reagents/materials/analysis tools, wrote the paper, prepared figures and/or tables, reviewed drafts of the paper. • Joana I. Robalo, Paulo Branco, José Maria Santos, Maria Teresa Ferreira, Mónica
Sousa and Ignacio Doadrio conceived and designed the experiments, performed the experiments, analyzed the data, contributed reagents/materials/analysis tools, wrote the paper, reviewed drafts of the paper.
Field Study Permissions
The following information was supplied relating to field study approvals (i.e., approving body and any reference numbers):
Permits for field work were given by ICNF (176/2010/CAPT and 53/2012/CAPT).
DNA Deposition
The following information was supplied regarding the deposition of DNA sequences: GenBank accession numbers:KU366823–KU370500.
Data Availability
The following information was supplied regarding data availability:
Besides sequencing data, raw data for the statistical analyses performed are provided in
Table S2.
Supplemental Information
Supplemental information for this article can be found online athttp://dx.doi.org/10.7717/ peerj.1694#supplemental-information.
REFERENCES
Abellán P, Svenning J-C. 2014.Refugia within refugia—patterns in endemism and ge-netic divergence are linked to Late Quaternary climate stability in the Iberian Penin-sula.Biological Journal of the Linnean Society113:13–28DOI 10.1111/bij.12309.
Almada V, Sousa-Santos C. 2010.Comparisons of the genetic structure ofSqualius populations (Pisces, Cyprinidae) from rivers with contrasting histories, drainage areas and climatic conditions.Molecular Phylogenetics and Evolution57:924–931
DOI 10.1016/j.ympev.2010.08.015.
Alò D, Turner TF. 2005.Effects of habitat fragmentation on effective population size of the endangered Rio Grande silvery minnow.Conservation Biology19:1138–1148
DOI 10.1111/j.1523-1739.2005.00081.x.
Alvarez-Cobelas M, Rojo C, Angeler DG. 2005.Mediterranean limnology: current status, gaps and the future.Journal of Limnology64:13–29DOI 10.4081/jlimnol.2005.13.
Araguas RM, Vidal O, Pla C, Sanz N. 2013.High genetic diversity of the endangered Iberian three-spined stickleback (Gasterosteus aculeatus) at the Mediterranean edge of its range.Freshwater Biology57:143–154.
Blanchet S, Rey O, Etienne R, Lek S, Loot G. 2010.Species-specific responses to landscape fragmentation: implications for management strategies.Evolutionary Applications3:291–304DOI 10.1111/j.1752-4571.2009.00110.x.
Blomqvist D, Pauliny A, Larsson M, Flodin LA. 2010.Trapped in the extinction vortex? Strong genetic effects in a declining vertebrate population.BMC Evolutionary Biology
10:33DOI 10.1186/1471-2148-10-33.
Brito RM, Briolay J, Galtier N, Bouvet Y, Coelho MM. 1997.Phylogenetic relationships within genusLeuciscus(Pisces, Cyprinidae) in Portuguese freshwaters, based on mitochondrial cytochromebsequences.Molecular Phylogenetics and Evolution
8:435–442DOI 10.1006/mpev.1997.0429.
Buonerba L, Zaccara S, Delmastro GB, Lorenzoni M, Salzburger W, Gante HF. 2015.Intrinsic and extrinsic factors act at different spatial and temporal scales to shape population structure, distribution and speciation in ItalianBarbus (Osteichthyes: Cyprinidae).Molecular Phylogenetics and Evolution89:115–129
DOI 10.1016/j.ympev.2015.03.024.
Cabral MJ, Almeida J, Almeida PR, Dellinger TR, Ferrand de Almeida N, Oliveira ME, Palmeirim JM, Queiroz AI, Rogado L, Santos-Reis M. 2005.Livro Vermelho dos Vertebrados de Portugal. Lisboa: Instituto da Conservação da Natureza.
CEN (Comité Européen de Normaliation). 2003.Water quality: sampling of fish with electricity. Brussels: CEN, European Standard EN 14011, European Committee for Standardization.
Clavero M, Blanco-Garrido F, Prenda J. 2004.Fish fauna in Iberian Mediterranean river basins: biodiversity, introduced species and damming impacts.Aquatic Conservation: Marine and Freshwater Ecosystems14:575–585DOI 10.1002/aqc.636.
Dekar MP, Magoulick DD. 2007.Factors affecting fish assemblage structure during seasonal stream drying.Ecology of Freshwater Fish16:335–342
DOI 10.1111/j.1600-0633.2006.00226.x.
Dias JMA, Boski T, Rodrigues A, Magalhães F. 2000.Coast line evolution in Portu-gal since the Last Glacial Maximum until present—a synthesis.Marine Geology
Doadrio I, Perdices A, Machordom A. 1996.Allozymic variation of the endangered killifishAphanius iberusand its application to conservation.Environmental Biology of Fishes45:259–271 DOI 10.1007/BF00003094.
Doadrio I, Perea S, Garzón-Heydt P, González JL. 2011.Ictiofauna Continental Española. Bases para su seguimiento. Dirección General Medio Natural y Política Forestal, Ministerio de Medio Ambiente y Medio Rural y Marino, Madrid.
Epps CW, Keyghobadi N. 2015.Landscape genetics in a changing world: disentangling historical and contemporary influences and inferring change.Molecular Ecology
24:6021–6040DOI 10.1111/mec.13454.
Ewers RM, Didham RK. 2006.Confounding factors in the detection of species responses to habitat fragmentation.Biological Reviews81:117–142.
Excoffier L, Lischer H. 2010.Arlequin suite ver 3.5: a new series of programs to perform population genetics analyses under Linux and Windows.Molecular Ecology Resources
10:564–567DOI 10.1111/j.1755-0998.2010.02847.x.
Faulks LK, Gilligan DM, Beheregaray LB. 2011.The role of anthropogenic vs. natural in-stream structures in determining connectivity and genetic diversity in an
endangered freshwater fish, Macquarie perch (Macquaria australasica).Evolutionary Applications4:589–601DOI 10.1111/j.1752-4571.2011.00183.x.
Filipe AF, Lawrence JE, Bonada N. 2013.Vulnerability of stream biota to climate change in mediterranean climate regions: a synthesis of ecological responses and conservation challenges.Hydrobiologia719:331–351.
Frankham R. 2010.Challenges and opportunities of genetic approaches to biological conservation.Biological Conservation143:1919–1927
DOI 10.1016/j.biocon.2010.05.011.
Frankham R. 1995.Conservation genetics.Annual Review of Genetics29:305–327
DOI 10.1146/annurev.ge.29.120195.001513.
Füssel H, Jol A, Kurnik B, Hemming D. 2012.Climate change, impacts and vulnerability in Europe 2012: an indicator-based report. EEA Report 304.
Gante HF. 2011. Diversification of circum-mediterranean barbels. In: Grillo O, Venora G, eds.Changing diversity in changing environment. Rijeka: InTech, 283–298.
Gante HF, Doadrio I, Alves MJ, Dowling T. 2015.Semi-permeable boundaries in Iberian barbels (BarbusandLuciobarbus, Cyprinidae).BMC Evolutionary Biology15:111
DOI 10.1186/s12862-015-0392-3.
Gante HF, Micael J, Oliva-Paterna FJ, Doadrio I, Dowling TE, Alves MJ. 2009. Diversifi-cation within glacial refugia: tempo and mode of evolution of the polytypic fish Bar-bus sclateri.Molecular Ecology 18:3240–3255DOI 10.1111/j.1365-294X.2009.04264.x.
Gasith A, Resh VH. 1999.Streams in Mediterranean climate regions: abiotic influences and biotic responses to predictable seasonal events.Annual Review of Ecology and Systematics30:51–81DOI 10.1146/annurev.ecolsys.30.1.51.
Gillooly JF, Allen AP, West GB, Brown JH. 2005.The rate of DNA evolution: ef-fects of body size and temperature on the molecular clock.Proceedings of the National Academy of Sciences of the United States of America102:140–145
Gilpin ME, Soulé ME. 1986. Minimum viable populations: processes of species ex-tinction. In: Soulé ME, ed.Conservation biology: the science of scarcity and diversity. Sunderland: Sinauer, 19–34.
Gómez A, Lunt DH. 2007. Refugia within refugia: patterns of phylogeographic con-cordance in the Iberian Peninsula. In: Weiss S, Ferrand D, eds.Phylogeography of southern European refugia. Dordrecht: Springer, 155–188.
Henriques R, Sousa V, Coelho MM. 2010.Migration patterns counteract seasonal isolation ofSqualius torgalensis, a critically endangered freshwater fish inhabiting a typical Circum-Mediterranean small drainage.Conservation Genetics11:1859–1870
DOI 10.1007/s10592-010-0078-8.
Hewitt GM. 2004.Genetic consequences of climatic oscillations in the Quaternary. Philosophical Transactions of the Royal Society of London B: Biological Sciences
359:183–195DOI 10.1098/rstb.2003.1388.
Hoagstrom CW, Berry CR. 2006.Island biogeography of native fish faunas among Great Plains drainage basins: basin scale features influence composition.American Fisheries Society Symposium48:221–264.
Husemann M, Ray JW, King RS, Hooser EA, Danley PD. 2012.Comparative biogeogra-phy reveals differences in population genetic structure of five species of stream fishes. Biological Journal of the Linnean Society 107:867–885
DOI 10.1111/j.1095-8312.2012.01973.x.
IBM Corporation. 2013.IBM SPSS statistics for Windows. Version 21.0. Armonk, New York.
Jenkins M. 2003.Prospects for biodiversity.Science302:1175–1177
DOI 10.1126/science.1088666.
Jesus TF, Inácio MA, Coelho MM. 2013.Different levels of hsp70 and hsc70 mRNA expression in Iberian fish exposed to distinct river conditions.Genetics and Molecular Biology36:61–69DOI 10.1590/S1415-47572013000100009.
Kahilainen A, Puurtinen M, Kotiaho JS. 2014.Conservation implications of species-genetic diversity.Global Ecology and Conservation2:315–323
DOI 10.1016/j.gecco.2014.10.013.
Leffler EM, Bullaughey K, Matute DR, Meyer WK, Ségurel L, Venkat A, Andolfatto P, Przeworski M. 2012.Revisiting an old riddle: what determines genetic diversity levels within species?PLoS Biology10:e1001388DOI 10.1371/journal.pbio.1001388.
Levy A, Doadrio I, Almada VC. 2008.Historical biogeography of European leuciscins (Cyprinidae): evaluating the Lago Mare dispersal hypothesis.Journal of Biogeography
36:55–65.
Lopez-Cunha M, Aboim MA, Mesquita N, Alves MJ, Doadrio I, Coelho MM. 2012.Population genetic structure in the Iberian cyprinid fish Iberochondros-toma lemmingii(Steindachner, 1866): disentangling species fragmentation and colonization processes.Biological Journal of the Linnean Society105:559–572
DOI 10.1111/j.1095-8312.2011.01827.x.
Macedo-Veiga A. 2013.Towards the conservation of freshwater fish: Iberian Rivers as an example of threats and management practices.Reviews in Fish Biology and Fisheries
23:1–22DOI 10.1007/s11160-012-9275-5.
Magalhães MF, Beja P, Canas C, Collares-Pereira MJ. 2002.Functional heterogeneity of dryseason refugia across a Mediterranean catchment: the role of habitat and predation.Freshwater Biology47:1919–1934DOI 10.1046/j.1365-2427.2002.00941.x.
Magalhães MF, Schlosser IJ, Collares-Pereira MJ. 2003.The role of life history in the relationship between population dynamics and environmental variabil-ity in two Mediterranean stream fishes.Journal of Fish Biology63:300–317
DOI 10.1046/j.1095-8649.2003.00148.x.
Magoulick DD, Kobza RM. 2003.The role of refugia for fishes during drought: a review and synthesis.Freshwater Biology48:1186–1198
DOI 10.1046/j.1365-2427.2003.01089.x.
McCusker MR, Bentzen P. 2013.Positive relationships between genetic diversity and abundance in fishes.Molecular Ecology19:4852–4862.
Mesquita N, Hänfling B, Carvalho GR, Coelho MM. 2005.Phylogeography of the cyprinidSqualius aradensisand implications for conservation of the en-demic freshwater fauna of southern Portugal.Molecular Ecology 14:1939–1954
DOI 10.1111/j.1365-294X.2005.02569.x.
Moyle PB, Cech JJ. 2004.Fishes, an introduction to ichthyology. New Jersey: Prentice Hall.
Myers N, Mittermeier RA, Mittermeier CG, Fonseca GAB, Kent J. 2000.Biodiversity hotspots for conservation priorities.Nature403:853–858DOI 10.1038/35002501.
Oberdoff T, Tedesco PA, Hugueny B, Leprieur F, Beauchard O, Brosse S, Dürr HH. 2011.Global and regional patterns in riverine fish species richness: a review. International Journal of Ecology2011:Article 967631.
Osborne MJ, Perkin JS, Gido KB, Turner TF. 2014.Comparative riverscape genetics reveals reservoirs of genetic diversity for conservation and restoration of Great Plains fishes.Molecular Ecology 23:5663–5679DOI 10.1111/mec.12970.
Pais J, Cunha PP, Pereira D, Legoinha P, Dias R, Moura D, Brum da Silveira A, Kullberg JC, González-Delgado JA. 2012.The Paleogene and Neogene of Western Iberia (Portugal). A Cenozoic record in the European Atlantic domain. Berlin: Springer Briefs in Earth Sciences, Springer.
Paz-Vinas I, Comte L, Chevalier M, Dubut V, Veyssiere C, Grenouillet G, Loot G, Blanchet S. 2013.Combining genetic and demographic data for prioritizing conservations actions: insights from a threatened fish species.Ecology and Evolution
3:2696–2710DOI 10.1002/ece3.645.
Perea S, Doadrio I. 2014.Phylogeography, historical demography and habitat suitability modelling of freshwater fishes inhabiting seasonaly fluctuating Mediterranean river systems: a case study using the Iberian cyprinidSqualius valentinus.Molecular Ecology 24:3706–3722.
systems: a study using the Iberian cyprinidSqualius valentinus.Molecular Ecology
24:3706–3722.
Pires AM, Cowx IG, Coelho MM. 1999.Seasonal changes in fish community structure of intermittent streams in the middle reaches of the Guadiana basin, Portugal.Journal of Fish Biology54:235–249.
Prenda J, Gallardo A. 1996.Self-purification, temporal variability and the macroinverte-brate community in small lowland Mediterranean streams receiving crude domestic sewage effluents.Archiv fur Hydrobiologie136:159–170.
Provan J, Bennett KD. 2008.Phylogeographic insights into cryptic glacial refugia.Trends in Ecology and Evolution23:564–571DOI 10.1016/j.tree.2008.06.010.
Raeymaekers JAM, Maes GE, Geldof S, Hontis I, Nackaerts K, Volckaert FAM. 2008.
Modeling genetic connectivity in sticklebacks as a guide for river restoration. Evolutionary Applications1:475–488DOI 10.1111/j.1752-4571.2008.00019.x.
Reyjol Y, Hugueny B, Pont D, Bianco PG, Beier U, Caiola N, Casals F, Cowx IG, Economou A, Ferreira MT, Haidvogl G, Noble R, De Sostoa T, Vigneron T, Virbickas T. 2007.Patterns in species richness and endemism of European fresh-water fish.Global Ecology and Biogeography16:65–75
DOI 10.1111/j.1466-8238.2006.00264.x.
Ribeiro F, Beldade R, Dix M, Bochechas J. 2007.Carta Piscícola Nacional [National Fish Atlas]. Direcção Geral dos Recursos Florestais—Fluviatilis, Lda.Available at
http:// www.cartapiscicola.org (accessed 20 December 2015).
Robalo JI, Doadrio I, Valente A, Almada VC. 2007.Identification of ESUs in the criti-cally endangered Portuguese minnowChondrostoma lusitanicum(Collares-Pereira 1980) based on a phylogeographical analysis.Conservation Genetics8:1225–1229
DOI 10.1007/s10592-006-9275-x.
Robalo JI, Sousa-Santos C, Almada VC, Doadrio I. 2006.Paleobiogeography of two Iberian endemic cyprinid fishes (Chondrostoma arcasii-Chondrostoma macrolepi-dotus) inferred from mitochondrial sequence data.Journal of Heredity97:143–149
DOI 10.1093/jhered/esj025.
Romiguier J, Gayral P, Ballenghien M, Bernard A, Cahais V, Chenuil A, Chiari Y, Der-nat R, Duret L, Faivre N, Loire E, Lourenço JM, Nabholz B, Roux C, Tsagkogeorga G, Weber AA-T, Weinert LA, Belkhir K, Bierne N, Glémin S, Galtier N. 2014.
Comparative populations genomics in animals uncovers the determinants of genetic diversity.Nature515:261–263DOI 10.1038/nature13685.
Roselló E, Morales A. 2010. Lapa dos Coelhos: informe sobre los restos de peces. In: Mata E, ed.Homenaje a Francisco Giles Pacheco. Sevilla: Publicaciones Junta de Andalucia, 261–276.
Rowe KC, Heske EJ, Brown PW, Paige KN. 2004.Surviving the ice: Northern refugia and postglacial colonization.Proceedings of the National Academy of Sciences of the United States of America101:10355–10359DOI 10.1073/pnas.0401338101.
in Portugal: implications for conservation.Biological Conservation109:47–56
DOI 10.1016/S0006-3207(02)00132-5.
Schmidt TR, Gold JR. 1993.Complete sequence of the mitochondrial cytochromeb gene in the Cherryfin Shinner,Liturus roseipinnis(Teleostei: Cyprinidae).Copeia
3:880–883.
Schröter D, Cramer W, Leemans R, Prentice IC, Araújo MB, Arnell NW, Bondeau A, Bugmann H, Carter TR, Gracia CA, De la Vega-Leinert AC, Erhard M, Ewert F, Glendining M, House JI, Kankaanpää S, Klein RJT, Lavorel S, Lindner M, Metzger MJ, Meyer J, Mitchell TD, Reginster I, Rounsevell M, Sabaté S, Sitch S, Smith B, Smith J, Smith P, Sykes MT, Thonicke K, Thuiller W, Tuck G, Zaehle S, Zierl B. 2005.Ecology: ecosystem service supply and vulnerability to global change in Europe.Science310:1333–1337DOI 10.1126/science.1115233.
Sousa V, Penha F, Collares-Pereira MJ, Chikhi L, Coelho MM. 2007.Genetic structure and signature of population decrease in the critically endangered freshwater cyprinid Chondrostoma lusitanicum.Conservation Genetics9:791–805.
Sousa V, Penha F, Pala I, Chikhi L, Coelho MM. 2010.Conservation genetics of a criti-cally endangered Iberian minnow: evidence of population decline and extirpations. Conservation Genetics13:162–171.
Sousa-Santos C, Collares-Pereira MJ, Almada VC. 2007.Reading the history of a hybrid fish complex from its molecular record.Molecular Phylogenetics and Evolution
45:981–996DOI 10.1016/j.ympev.2007.05.011.
Sousa-Santos C, Gante HF, Robalo J, Proença Cunha P, Martins A, Arruda M, Alves MJ, Almada V. 2014a.Evolutionary history and population genetics of a cyprinid fish (Iberochondrostoma olisiponensis) endangered by intro-gression from a more abundant relative.Conservation Genetics15:665–677
DOI 10.1007/s10592-014-0568-1.
Sousa-Santos C, Robalo JI, Francisco SM, Carrapato C, Cardoso AC, Doadrio I. 2014b.Metapopulations in temporary streams—the role of drought-flood cycles in promoting high genetic diversity in a critically endangered freshwater fish and its consequences for the future.Molecular Phylogenetics and Evolution80:281–296.
Sousa-Santos C, Robalo J, Santos JM, Branco P, Ferreira T, Sousa M, Ramos A, Castilho R, Doadrio I, Almada V. 2013.Atlas Genético Nacional dos peixes ciprinídeos nativos. (in Portuguese).Available athttp:// www.fishatlas.net.
Spielman D, Brook B, Frankham R. 2004.Most species are not driven to extinction before genetic factors impact them.Proceedings of the National Academy of Sciences of the United States of America101:15261–15264DOI 10.1073/pnas.0403809101.
Taberlet P, Fumagalli L, Wust-Saucy A-G, Cosson J-F. 1998.Comparative phylogeogr-pahy and postglacial colonization routes in Europe.Molecular Ecology7:453–464
DOI 10.1046/j.1365-294x.1998.00289.x.
Van Noordwijk AJ. 1994.The interaction of inbreeding depression and environmental stochasticity in the risk of extinction of small populations.Conservation Genetics
Vrijenhoek RC. 1994. Genetic diversity and fitness in small population. In: Loeschcke V, Tomiuk J, Jain SK, eds.Conservation genetics. Basel: Birkhäuser Verlag, 38–53.
Wofford JEB, Gresswell RE, Banks MA. 2005.Influence of barriers to movement on within-watershed genetic variation of coastal cutthroat trout.Ecological Applications
15:628–637DOI 10.1890/04-0095.
Xenopoulos MA, Lodge DM, Alcamo J, Märker M, Schulze K, Van Vuuren DP. 2005.