www.atmos-chem-phys.org/acp/5/1423/ SRef-ID: 1680-7324/acp/2005-5-1423 European Geosciences Union
Chemistry
and Physics
Ozone loss derived from balloon-borne tracer measurements in the
1999/2000 Arctic winter
A. D. Robinson1, G. A. Millard1, F. Danis1, M. Guirlet1, N. R. P. Harris1, A. M. Lee1, J. D. McIntyre1, J. A. Pyle1,2, J. Arvelius3, S. Dagnesjo3, S. Kirkwood3, H. Nilsson3, D. W. Toohey4, T. Deshler5, F. Goutail6, J.-P. Pommereau6, J. W. Elkins7, F. Moore7, E. Ray7, U. Schmidt8, A. Engel8, and M. M ¨uller8
1Centre for Atmospheric Science, Department of Chemistry, Cambridge University, Cambridge CB2 1EW, UK 2NCAS-ACMSU, Department of Chemistry, Cambridge University, Cambridge CB2 1EW, UK
3Swedish Institute of Space Physics (IRF), Kiruna Division, Box 812, SE-981 28 Kiruna, Sweden
4Program in Atmospheric and Oceanic Sciences, 311 UCB, University of Colorado, Boulder, CO 80309-0311, USA 5Department of Atmospheric Science, University of Wyoming, P.O. Box 3038, Laramie, WY 82071, USA
6Service d’Aeronomie, CNRS, Verri`eres le Buisson, France
7Climate Monitoring and Diagnostics Laboratory, NOAA, Boulder, Colorado, USA
8Univ. of Frankfurt, Institut f¨ur Atmosph¨are und Umwelt, Georg Voigt Str. 14/Robert Mayer Str. 1, 60325 Frankfurt, Germany Received: 16 August 2004 – Published in Atmos. Chem. Phys. Discuss.: 3 November 2004
Revised: 10 May 2005 – Accepted: 12 May 2005 – Published: 14 June 2005
Abstract. Balloon-borne measurements of CFC11 (from the DIRAC in situ gas chromatograph and the DESCARTES grab sampler), ClO and O3were made during the 1999/2000 Arctic winter as part of the SOLVE-THESEO 2000 cam-paign, based in Kiruna (Sweden). Here we present the CFC-11 data from nine flights and compare them first with data from other instruments which flew during the campaign and then with the vertical distributions calculated by the SLIM-CAT 3D CTM. We calculate ozone loss inside the Arctic vor-tex between late January and early March using the relation between CFC11 and O3measured on the flights. The peak ozone loss (∼1200 ppbv) occurs in the 440–470 K region in
early March in reasonable agreement with other published empirical estimates. There is also a good agreement between ozone losses derived from three balloon tracer data sets used here. The magnitude and vertical distribution of the loss derived from the measurements is in good agreement with the loss calculated from SLIMCAT over Kiruna for the same days.
1 Introduction
Measurements of long-lived tracers such as N2O, CH4 and CFC11 can be used to study a number of aspects of strato-spheric transport and chemistry. In the Arctic region, these Correspondence to:A. D. Robinson
(adr22@cam.ac.uk)
include the descent of air in the polar vortices (Schoeberl et al., 1990; Bauer et al., 1994) and mixing processes both at the vortex edge (Waugh et al., 1997; Pyle et al., 1994) and in the lowermost stratosphere (Bregman et al., 2000). Further, changes in the observed compact relations between long-lived tracers and ozone have been used to estimate the magnitude of chemical ozone loss in the Arctic vortex (Prof-fitt et al., 1990, 1993; M¨uller et al., 2001 and references therein); this technique is used here with data from two new in situ instruments. Other studies of ozone loss use different techniques (Rex et al., 1999; Goutail et al., 1999; Manney et al., 1997; Knudsen et al., 1998; Lucic et al., 1999 and references therein). Brief descriptions of these techniques, including the tracer relation approach, can be found in Harris et al. (2002), together with a comparison of some of their re-sults. A discussion of the results obtained in this study with other estimates of ozone loss in the 1999/2000 winter is pre-sented in Sect. 5.
Table 1.Balloon flights in the 1999/2000 winter from Esrange, Kiruna (67.9 N, 21.1 E) which carried the DIRAC/DESCARTES instruments featured in this work.
Date Launch hour (UTC) Guest instrument Host payload
3 Dec 1999 10 DESCARTES OMS remote∗
15 Dec 1999 11 DESCARTES SKERRIES†
19 Jan 2000 11 DIRAC HALOZ (ClO)∗
27 Jan 2000 12 DIRAC HALOZ (ClO)∗
28 Jan 2000 11 DESCARTES SAOZ†
1 Mar 2000 10 DESCARTES HALOZ (ClO)∗
5 Mar 2000 15 DIRAC, DESCARTES OMS in situ∗
7 Mar 2000 14 DESCARTES SAOZ†
8 Mar 2000 12 DIRAC HALOZ (ClO)∗
∗ECC ozonesonde flown as part of the main payload.
†ECC ozonesonde flown soon after the main balloon.
during the SOLVE-THESEO 1999/2000 campaign (Newman et al., 2002) with other lightweight instruments including the SAOZ experiment (Pommereau and Piquard, 1994) or as part of the HALOZ project to measure ClO and related species (V¨omel et al., 2001). In this paper we present results from nine balloon flights of these instruments made during SOLVE-THESEO 2000: four flights of the DIRAC in situ gas chromatograph and five flights of the DESCARTES grab sampler.
In the first part of the paper, the instruments and the model are described. The next part presents the measured vertical profiles of CFC11 and ozone (measured by electrochemical concentration cell (ECC) ozonesondes). The vertical profiles are then compared both with data from other instruments which flew during the campaign and to profiles calculated by the SLIMCAT 3D chemical transport model (CTM), used to study ozone loss in previous Arctic winters (e.g. Guirlet et al., 2000). Measurements of ClO made using a resonance fluorescence instrument (Pierson et al., 1999) on some of the flights are also compared with the ClO profiles calculated in SLIMCAT (8 Mar 2000 comparison shown here). Changes in the CFC11 and ozone correlations during the winter are then used to make estimates of the ozone loss that occurred in the vortex during 1999/2000. Finally, we compare the mea-surement based estimates with the ozone loss calculated us-ing the ozone and CFC11 correlations above Kiruna for the same days, as calculated by SLIMCAT, in order to assess the representativeness of the balloon observations.
2 Measurements
The measurements featured in this study were made by three instruments flown on balloons from Kiruna during the SOLVE-THESEO 2000 campaign. The balloon flight details are given in Table 1. The instruments are now briefly de-scribed.
2.1 Halocarbons
DIRAC (Determination In situ by Rapid Analytical Chro-matography) is a lightweight gas chromatograph for use on stratospheric balloons developed by the University of Cam-bridge. The operation and performance of DIRAC are de-scribed by Robinson et al. (2000). The instrument weighed 21 or 24 kg, depending on configuration (although recent in-struments with superior performance now weigh <10 kg). A range of halocarbons is detected and can be measured quantitatively. The measurement with the highest preci-sion is CFC11, measured with a time resolution of about 2 min. DIRAC uses a Carboxen adsorbent to preconcentrate samples of known volume before injection onto a separa-tion column and electron capture detector. The accuracy for CFC11 measurements below 400 K, based on the un-certainty of the calibration gas used during the campaign is estimated to be 2.5%. This calibration gas is linked to NOAA-CMDL working standards by comparison to an Ac-ulife treated cylinder containing Niwot Ridge air (calibrated by NOAA-CMDL in July/August 2000). For measurements made at higher altitudes there is a positive instrument bias effect on measurement accuracy which is discussed in the Appendix. The positive bias is low (<10%) below 400 K and rises to around 200% (factor of 3 higher than reality) at 475 K, where DIRAC reaches its limit of detection for CFC-11. All the DIRAC data presented in this work have been corrected for this altitude dependent bias as described in the Appendix.
(be-low 400 K) where CFC11 mixing ratios are high and sample volumes are large, the precision is typically 5–8 pptv (corre-sponding to a typical sample mass in the range 10 to 20 pg of CFC11). However, at higher altitudes (above 400 K), where both the sample volumes and CFC11 mixing ratios are low, the precision is degraded (at 460 K the estimated precision is 15–20 pptv, corresponding to a sample mass of 1.4 pg of CFC-11). Note that the detection limit of 1 pg of CFC-11 was typically reached at∼475 K during this campaign. The
mea-surements are analysed here from four flights of DIRAC dur-ing SOLVE-THESEO 2000 (Table 1). Three of these (19 Jan, 27 Jan and 8 Mar 2000) were made as part of the HALOZ project (V¨omel et al., 2001) and the other was part of the OMS in situ flight (5 Mar 2000). All DIRAC data presented here were taken during the balloon ascent. A fifth DIRAC flight was made in late March, but unfortunately the balloon and payload flew astray over Finland and were not recovered. We have no data for this flight as DIRAC was flying without telemetry.
DESCARTES (D´etermination et S´eparation par Chro-matographie lors de l’Analyse des R´esultats des Traceurs Echantillonn´es dans la Stratosph`ere) is a lightweight (17 kg) balloon-borne grab sampling instrument developed by the University of Cambridge in which known volumes of strato-spheric air are trapped on sample tubes containing Carboxen. A range of trapped halocarbons is subsequently measured in the laboratory using a gas chromatograph and electron capture detector. For a detailed discussion see Danis et al. (2000). The precision (1 sigma) of the CFC11 measure-ments made by DESCARTES during this campaign was typ-ically<15 pptv for samples taken below 400 K and typically 5–20 pptv for samples above 400 K. The accuracy is esti-mated to be about 4% for CFC11 based on the uncertainty of the calibration gas. All measurements from DESCARTES presented here were analysed by IRF, Kiruna, enabling data to be obtained soon after instrument recovery. A total of 10 DESCARTES flights (including vortex edge flights) were made during the 1999/2000 winter. In this paper, measure-ments are analysed from the five vortex core flights of the instrument, made with a range of host payloads (Table 1). As with DIRAC, all the DESCARTES CFC11 data presented here were taken during the balloon ascent.
2.2 ClO
The ClO measurements used in this paper were made using an instrument based on the technique of chemical conver-sion/resonance fluorescence (Pierson et al., 1999). The bal-loon flights were made in the HALOZ project whose aim was to investigate ozone loss in the Arctic winter 1999/2000 (V¨omel et al., 2001). A total of five balloon flights of the ClO instrument were made during the 1999/2000 winter. In this paper, measurements are presented from the HALOZ flight on 8 March 2000 (Table 1).
CFC-11 peak area, detector ADCcount seconds
0 100000 200000 300000 400000 500000 600000 700000
C
F
C
-11, pg
0 5 10 15 20 25 30
19 Jan ground
5 Mar ground 27 Jan ground
8 Mar ground 19 Jan float 27 Jan float 5 Mar float 8 Mar float
Fig. 1.DIRAC in-flight CFC11 response curves for 19 January, 27
January, 5 March and 8 March used to calibrate the in situ CFC11 measurements. The x-axis is peak area expressed in units of detec-tor ADCcount seconds, the y-axis is mass of CFC-11 measured in the calibration gas, expressed in pg of CFC-11.
2.3 Ozone
The ozonesonde observations for all the flights used in this study (including those associated with the OMS in situ and Bonbon flights) were made by ECC sondes operated by the University of Wyoming and Esrange.
3 SLIMCAT 3 dimensional chemical transport model
The SLIMCAT 3D CTM (Chipperfield et al., 1996; Chipper-field, 1999; Guirlet et al., 2000) is an off-line model driven here with daily U.K. Met. Office winds and temperatures (Swinbank and O’Neill, 1994) on 12 isentropic potential temperature surfaces from 335 K to 2700 K at a resolution of 3.75◦ latitude by 3.75◦ longitude. The model uses the
CFC-11, pptv
0 50 100 150 200 250 300
P
o
te
nt
ia
l t
em
pe
ra
tu
re
,
K
250 300 350 400 450 500 550 600
CFC-11, pptv
0 50 100 150 200 250 300
P
o
te
nt
ia
l t
em
pe
ra
tu
re
,
K
250 300 350 400 450 500 550 600
O3, ppbv
0 500 1000 1500 2000 2500 3000 3500 4000
P
ot
ent
ia
l t
em
pe
ra
tur
e, K
250 300 350 400 450 500 550 600
O3, ppbv
0 500 1000 1500 2000 2500 3000 3500 4000
P
ot
ent
ia
l t
em
pe
ra
tur
e, K
250 300 350 400 450 500 550 600
Bonbon 27 Jan 00 LACE 5 Mar 00 LACE 19 Nov 99
Bonbon 1 Mar 00 DIRAC
19 Jan 00 27 Jan 00 5 Mar 00 8 Mar 00
d
(symbols as panel b)c
(symbols as panel a)b
a
DESCARTES3 Dec 99 15 Dec 99 28 Jan 00 1 Mar 00 7 Mar 00
Bonbon 27 Jan 00 LACE 5 Mar 00 LACE 19 Nov 99
Bonbon 1 Mar 00
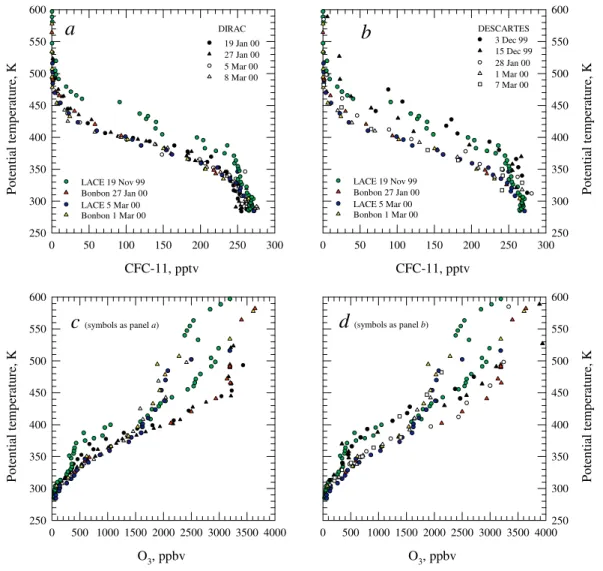
Fig. 2. Vertical profiles of: CFC11 mixing ratio (bias-corrected) from the DIRAC flights (panela); CFC11 from the DESCARTES flights
(panelb); ozone mixing ratio from ECC sondes for the DIRAC flights (panelc); and the DESCARTES flights (paneld) used as a basis for
the ozone loss estimates.
nitric acid trihydrate (NAT) and ice particles. This particu-lar version of the model has been used in studies of Arctic ozone loss in three other cold winters in the late 1990s (Guir-let et al., 2000) and in a detailed comparison to ozone loss rates derived by the Match technique. The winter 1999/2000 simulation was initialised on 30 November 1999 from a low resolution multiannual simulation provided by Chipperfield (1999) with a total chlorine loading of 3.6 ppbv and a to-tal bromine loading of 20 pptv. The winter simulation was run until May 2000 with daily output of the chemical fields. Sinnhuber et al. (2000) have already discussed ozone loss in the 1999/2000 winter as calculated by this version of SLIM-CAT. The model reproduced observed loss extremely well (see, e.g., a comparison between the model and the observed decline in lower stratospheric ozone at Ny- ˚Alesund in Fig. 2 from that paper, reproduced as Fig. 3–37 in WMO (2002)) and the model-derived ozone loss is in the centre of the range of estimates discussed in section 3.3.3 of WMO (2002).
Our main purpose in using the model is to give an indepen-dent estimate of the 1999/2000 loss against which to compare the loss derived using our data. In addition, we compare the directly calculated model ozone loss with that derived from the model using the CFC-11 vs ozone correlation.
4 Results
level (approximating to the lower boundary of the vortex). A change in the relation between CFC11 and ozone over the winter below this level is unlikely to be the result of chemi-cal ozone loss. A good agreement between the instruments, above the 360 K potential temperature level, would justify merging the two data sets in order to improve the estimate of ozone loss within the vortex core.
In the second part of this section the measurements from DIRAC and DESCARTES as well as the ClO and O3 mea-surements are compared with the output of the SLIMCAT model. This is achieved by making direct comparisons of the measured vertical profiles of CFC11, O3and ClO with those from the model. In order to make these comparsions, the model vertical profiles are linearly interpolated from model grid points and times to those of the balloon flight track and time.
In the third and last part of this section the relation between measured CFC11 and ozone is compared with the equiva-lent relation from the model. We also compare the measured O3/CFC11 relations from our instruments with those from Bonbon and LACE. Estimates of ozone loss in the vortex can be derived from the change in the measured O3/CFC-11 relation through the winter using the approach of Proffitt et al. (1990, 1993) and M¨uller et al. (2001 and references therein). A compact correlation between two tracers, such as exists between O3 and CFC11 at the start of the winter, should be maintained if it is assumed that there is no mixing or chemistry operating on the tracers. Changes in the corre-lation indicate that this assumption is not valid. Within the polar vortex, mixing is usually small and any change in the correlation is most likely due to chemistry. For the specific case of O3 and CFC11, the chemistry of the latter is very slow with small seasonal changes and the effect of mixing would be small since the relationship between O3and CFC-11 was effectively linear in this winter (M¨uller et al., 2003) so that changes in the expected correlation can be directly attributed to ozone destruction. Later in this section we use the measurements to estimate ozone loss by this method. Fi-nally, the ozone loss estimates based on the measurements are compared to the losses derived using exactly the same methodology from the change in the O3/CFC11 correlations in the model.
4.1 Measurement comparison
Here we first compare our CFC11 measurements with those from the Bonbon and LACE instruments and relate them to the vortex situation. Figures 2a and b respectively show the vertical profiles of CFC11 from the four DIRAC flights (bias-corrected data) and the five DESCARTES flights, together with CFC-11 data from the LACE flights of 19 November and 5 March and the Bonbon flights of 27 January and 1 March. The bias-correction applied to the DIRAC data does not significantly change the data below 400 K. Figures 2c and d show the O3 profiles collected for the same flights
as depicted in panels a and b respectively. Potential vortic-ity (PV) maps from UKMO and the T21 MIMOSA model (Hauchecorne et al., 2002) indicate that the polar vortex be-tween 19 November (LACE flight) and 3 and 15 December (DESCARTES flights) was well formed above 450 K. Be-low 450 K it strengthened significantly but is still best clas-sified as a weak vortex. This can explain much of the struc-ture apparent in both CFC11 and O3on these flights particu-larly below 450 K. On the DESCARTES flight of 3 Decem-ber (Fig. 2b) there was an elongated area of lower PV air above Kiruna at 475 K which could explain the higher CFC-11 values found at this level in the data. Maps of PV from MIMOSA show that all other flights featured here were es-sentially inside the Arctic vortex over the altitude range sam-pled (taking the vortex edge to be the zone of maximum PV gradient) and the CFC11 profiles show the expected rapid decrease with altitude. The change in the profiles suggests that considerable descent across potential temperature sur-faces occurred throughout the winter, particularly between early December and late January. On 19 January a notch in the DIRAC CFC11 profile at 360 K (Fig. 2a) is anticorrelated with the O3profile (Fig. 2c) which suggests a dynamical fea-ture; air at this potential temperature level is likely to be at or below the base of the vortex where such dynamical features are to be expected.
On 27 January DIRAC flew from the same launch site about 2 h after the Bonbon whole air cryo-sampler. As-suming that the two instruments flew through essentially the same air mass this provided an opportunity for compari-son. CFC11 measurements from DIRAC and Bonbon agree well within uncertainty limits, giving confidence in our bias-correction.
There were two occasions during SOLVE-THESEO 2000 on which DESCARTES flew within 24 h of Bonbon. On 27 January, Bonbon flew first with DESCARTES following 24 h later and on 1 March Bonbon flew just 5 h earlier than DESCARTES. All four of these flights were into the vortex core. Examination of the vertical profiles of CFC11 for these flights reveals that the DESCARTES measurements are sys-tematically higher than those from Bonbon at any given alti-tude. At low altitude (300 to 350 K) the DESCARTES mix-ing ratios are typically 20 pptv higher than those from Bon-bon and at higher altitude (>400 K) mixing ratios are typ-ically 10–20 pptv higher than Bonbon. Examination of the O3/CFC11relation for the comparison flights shows that for any given O3mixing ratio the corresponding DESCARTES CFC11 value is higher than that from Bonbon. However, this difference is within uncertainty limits for high O3mixing ra-tios (>2000 ppbv).
y = 4.25 + 1.116x, r2 = 0.9985
y = 19.02 + 0.955x, r2 = 0.9951
DESCARTES 28 Jan CFC-11, pptv 0 50 100 150 200 250 300
In
te
rpol
at
ed D
IR
A
C
/
B
onbo
n C
F
C
-11, ppt
v
0 50 100 150 200 250 300
DESCARTES 7 Mar CFC-11, pptv 0 50 100 150 200 250 300
Int
er
pol
at
ed
D
IR
A
C
/
L
A
C
E
5 M
ar
C
F
C
-1
1,
p
pt
v
0 50 100 150 200 250 300
a
b
DIRAC 27 Jan Bonbon 27 Jan
y = x y = x
DIRAC 5 Mar LACE 5 Mar
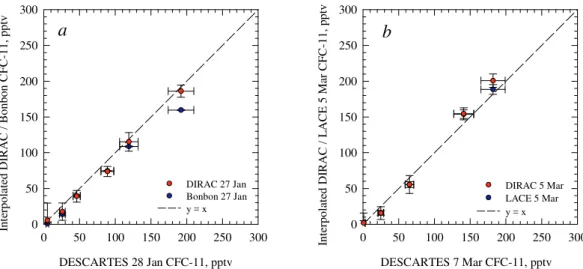
Fig. 3. Plots comparing DIRAC (bias-corrected) and DESCARTES CFC-11 (mixing ratio) measurements from late January (panela) and
early March (panelb). The data from both instruments are merged into a single data set on the basis of this agreement for measurements
made above 360 K. Bonbon and LACE measurements interpolated to the potential temperature of the DESCARTES measurements are shown for comparison.
temperature levels of the DESCARTES data. Only those data collected above 360 K are used in the assessment which approximates to the lowermost extent of the vortex circula-tion system. For both the January and March DIRAC and DESCARTES flight pairs there were only small differences beyond measurement uncertainties between the data points and the line y=x (a 1:1 agreement) and so a merged data set was produced, based on the DIRAC and DESCARTES measurements, to estimate ozone loss using the tracer ozone relation technique.
4.2 Measurement and model agreement
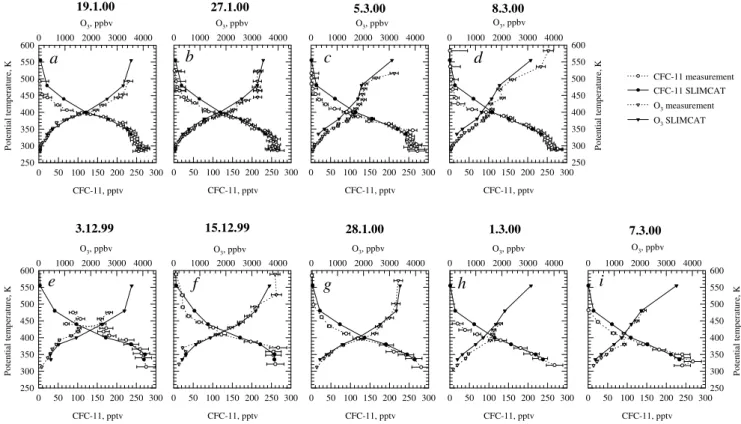
Here we compare our measurements of CFC11, O3and ClO directly with the SLIMCAT model output data. Comparisons between the measured CFC11 profiles and those calculated by the SLIMCAT 3D CTM for the same location and day are shown in Fig. 4. At altitudes below CFC-11 values of 100 pptv (approximately 400 K) there is excellent agreement. Above this level, while the broad structure of the profiles are similar, the model values tend to substantially overestimate the observations, presumably due to too weak descent. Note that this does not significantly affect our subsequent analysis. In this region the CFC-11 values are already very low and the vast majority of chlorine is in inorganic forms; an overesti-mation of CFC-11 will have only a very small impact on the chlorine available for activation (and, hence, on calculated ozone loss). We will also use the model O3/CFC-11 correla-tion to calculate ozone loss; overestimacorrela-tion of CFC-11 does not affect how that correlation changes with time and hence does not affect the loss derived in this way. There is also good agreement between O3 measured by the ECC sondes and the O3calculated in SLIMCAT although the model gen-erally underestimates the amount of ozone during March by
about 200 ppbv. On certain flights, structure in the CFC11 measurements, whilst not picked up by the model at this res-olution, is seen anticorrelated in the ozonesonde data (e.g. 3 Dec 1999, 27 Jan and 8 Mar 2000) confirming that the in-struments are able to capture these dynamical features.
To allow ClO observations to be compared directly with model calculations at the measurement times, the output from the SLIMCAT simulation of the 1999–2000 northern hemisphere winter (only stored daily at 12:00 UT) was used to initialise a set of stacked photochemical box models. The stacked box models were then integrated over a diurnal cycle for comparison with the observations, following the method used by Solomon et al. (2000). The stacked box models used an identical chemistry scheme to the full 3-D model except that all 49 chemical species in the model were integrated sep-arately with a 1 min time step; no family or photochemical steady-state assumptions were made.
8.3.00
O3, ppbv
0 1000 2000 3000 4000
P o te n ti al t em p er at u re , K 250 300 350 400 450 500 550 600 CFC-11, pptv
0 50 100 150 200 250 300
5.3.00
O3, ppbv
0 1000 2000 3000 4000
CFC-11, pptv
0 50 100 150 200 250 300
27.1.00
O3, ppbv
0 1000 2000 3000 4000
CFC-11, pptv
0 50 100 150 200 250 300
19.1.00
O3, ppbv
0 1000 2000 3000 4000
P o te n ti al t em p er at u re , K 250 300 350 400 450 500 550 600 CFC-11, pptv
0 50 100 150 200 250 300
3.12.99
O3, ppbv
0 1000 2000 3000 4000
P o te n ti al t em p er at u re , K 250 300 350 400 450 500 550 600 CFC-11, pptv
0 50 100 150 200 250 300
15.12.99
O3, ppbv
0 1000 2000 3000 4000
CFC-11, pptv
0 50 100 150 200 250 300
28.1.00
O3, ppbv
0 1000 2000 3000 4000
CFC-11, pptv
0 50 100 150 200 250 300
1.3.00
O3, ppbv
0 1000 2000 3000 4000
CFC-11, pptv
0 50 100 150 200 250 300
7.3.00
O3, ppbv
0 1000 2000 3000 4000
P o te n ti al t em p er at u re , K 250 300 350 400 450 500 550 600 CFC-11, pptv
0 50 100 150 200 250 300
a
b
c
d
e
f
g
h
i
O3 measurement O3 SLIMCAT CFC-11 measurement CFC-11 SLIMCAT
Fig. 4.Comparisons between measured and modelled (SLIMCAT) mixing ratio vertical profiles for CFC11 and ozone (panelsatod: DIRAC
flights (bias-corrected); panelsetoi: DESCARTES flights).
All the flights considered were inside the polar vortex where the model performance is good; we caution however that there may be regions, especially at the vortex edge, where detailed comparisons between model and observations are less satisfactory.
4.3 Estimated ozone loss in the vortex
Chemical ozone loss can be estimated from changes in the relation between the mixing ratios of O3 and a long-lived tracer. In any particular winter, this approach requires that (a) a representative early winter reference can be established; and (b) transport process (e.g. mixing of extra-vortex air into the vortex) do not significantly change the initial relationship. These two points are now discussed in turn.
In late 1999 the Arctic vortex was isolated and well-mixed (Kawa et al., 2002). The only odd feature was a notch of lower ozone around 30 hPa observed during the OMS in situ balloon flight on 19 November, which was attributed as be-ing a dynamical feature which developed durbe-ing the vortex formation (Salawitch et al., 2002). However, analysis of the available satellite data indicates that ozone variability in-side the vortex was low and that this feature was anomalous (Kawa et al., 2002). Accordingly, early winter ozone/tracer relations have been calculated from balloon profiles, whose estimated uncertainties reflect the variability in the O3/tracer
instrument ascent instrument descent SLIMCAT ascent SLIMCAT descent
ClO, pptv
0 400 800 1200 1600
P ot en ti al t em pe ra tu re , K 300 350 400 450 500 550 600 650 700 instrument ascent SLIMCAT ascent
Fig. 5. Comparison between the vertical profile from the ClO
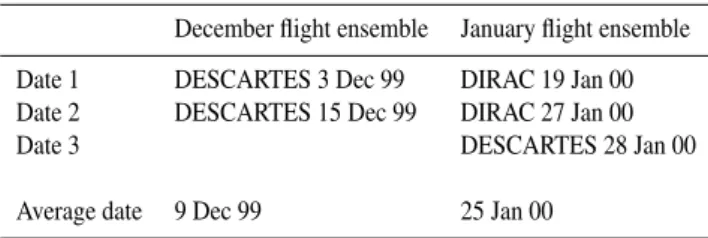
Table 2.Grouped DIRAC and DESCARTES flight ensembles used to examine ozone change from December to January (a) and from January to March (b) in the 1999/2000 Arctic winter.
a: Ozone change: early December to late January
December flight ensemble January flight ensemble
Date 1 DESCARTES 3 Dec 99 DIRAC 19 Jan 00
Date 2 DESCARTES 15 Dec 99 DIRAC 27 Jan 00
Date 3 DESCARTES 28 Jan 00
Average date 9 Dec 99 25 Jan 00
b: Ozone change: late January to early March
January flight ensemble March flight ensemble
Date 1 DIRAC 19 Jan 00 DESCARTES 1 Mar 00
Date 2 DIRAC 27 Jan 00 DIRAC 5 Mar 00
Date 3 DESCARTES 28 Jan 00 DESCARTES 7 Mar 00
Date 4 DIRAC 8 Mar 00
Average date 25 Jan 00 5 Mar 00
relation at that time (M¨uller et al., 2003; Salawitch et al., 2002).
Salawitch et al. (2002) further conclude that transport pro-cesses did not significantly affect the O3/N2O relationship in the vortex core between November 1999 and early March 2000. This finding is supported by the analyses of other tracer data sets in SOLVE-THESEO 2000 that there was lit-tle mixing into the vortex between the second half of January and early March 2000 (Rex et al., 2002; Ray et al., 2002; Richard et al., 2001).
Here, we merge the measurements of CFC11 and ozone (for measurements made above 360 K) from the DIRAC (bias-corrected CFC-11) and DESCARTES flights and use this merged data set to estimate ozone loss. First, the ob-served O3/CFC11 relations from the merged DIRAC and DESCARTES flights are compared with relations from the Bonbon and LACE flights and also the equivalent relations from the SLIMCAT model. Secondly, these relations, for both the merged measurements and the model, are used to estimate ozone loss as a function of altitude in the vortex for two periods through the winter. Because the data quality and the absolute CFC-11 concentrations decrease with altitude, our analysis of loss is confined to potential temperatures be-low 480 K.
To examine the changes in the vertical distribution of ozone throughout the winter, flights made within a few days of each other are treated as a merged ensemble (Table 2). CFC11 data for each flight within each ensemble are inter-polated to the potential temperature measurement levels of
Table 3. Linear regression parameters (y=a+bx) for the measured
(a) and modelled (b) O3/CFC-11 relations for the merged flight
en-sembles, where: x=CFC-11 mixing ratio; y=O3mixing ratio.
a: Regression parameters for the measured O3/CFC-11 relations
a b r2
early (9) Dec 1999 3658 −13.11 0.956
late (25) Jan 2000 3272 −11.65 0.991
early (5) Mar 2000 2001 −4.65 0.923
b: Regression parameters for the modelled O3/CFC-11relations
a b r2
early (9) Dec 1999 3688 −12.53 0.996
late (25) Jan 2000 3475 −12.77 0.999
early (5) Mar 2000 2122 −7.21 0.998
the later flight of the ensemble. The CFC11 data at each po-tential temperature level are then averaged to obtain a single CFC11 profile. The uncertainty for each averaged CFC11 measurement is the average of the quadrature addition of the fractional uncertainties of each individual measurement used in that average. An average ozone profile is then generated in exactly the same way as the CFC11 average profile for each ensemble. The date of each averaged ensemble is taken as the average of all the individual flight dates used to generate the ensemble. The ozone change is finally obtained by taking the difference in ozone on equivalent CFC11 levels between paired ensembles.
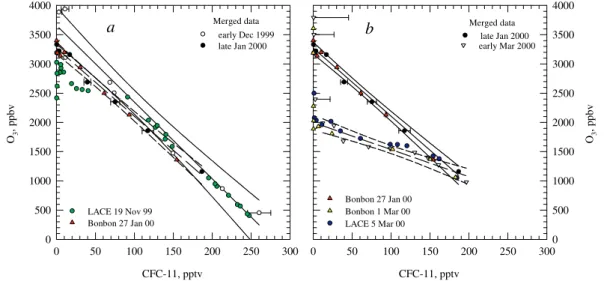
Figure 6a and Table 3a show the relations between CFC11 and O3 for the merged DIRAC and DESCARTES data be-tween the early December and late January flight ensembles. There is little difference in the relation between the Decem-ber and January data (average dates 9 Dec and 25 Jan respec-tively, 47 days separation), suggesting little loss during this period (but see below). Figure 6a also shows the O3 /CFC-11 relations for the LACE flight on 19 November and the Bonbon flight on 27 January. There is a good agreement between the merged early December data and the LACE November data for all values of ozone apart from the region between 2600 and 3300 ppbv where the LACE data shows lower ozone for a given CFC11 value by up to 500 ppbv.
CFC-11, pptv
0 50 100 150 200 250 300
O3
,
p
pbv
0 500 1000 1500 2000 2500 3000 3500 4000
CFC-11, pptv
0 50 100 150 200 250 300
O3
,
p
pbv
0 500 1000 1500 2000 2500 3000 3500 4000
LACE 19 Nov 99 Bonbon 27 Jan 00
Bonbon 27 Jan 00 Bonbon 1 Mar 00 LACE 5 Mar 00
a
early Dec 1999b
late Jan 2000
Merged data Merged data
late Jan 2000 early Mar 2000
Fig. 6. The relationship between CFC11 and ozone mixing ratios for the DIRAC/DESCARTES (DIRAC CFC-11 bias-corrected) merged
flight ensembles with data from Bonbon and LACE shown for comparison. Panela: early winter, the solid line is a 1st order regression fit
to the early December ensemble, the dashed line is a 1st order regression fit to the late January ensemble (dotted lines are 95% confidence
limits). Panelb: late winter, the solid line is a 1st order regression fit to the late January ensemble, the dashed line is a 1st order regression
fit to the early March ensemble.
From the merged data we diagnose ozone loss throughout the profile for CFC11 mixing ratios less than about 175 pptv (corresponding to about 370 K). There is a 1100 ppbv change in ozone at a CFC11 mixing ratio of 50 pptv (about 430 K), a 700 ppbv ozone change for 100 pptv CFC11 (about 405 K) and a 300 ppbv O3 change for 150 pptv of CFC11 (about 385 K). Note that the bias-correction in the DIRAC data is independent of time during the campaign and so makes no difference to the ozone loss calculation (see Appendix). Also evident from Fig. 6b is the excellent agreement in early March between the O3/CFC11 relation for the merged data and that from the 1 March Bonbon flight and the 5 March LACE flight.
A SLIMCAT calculation was performed for this winter (1999/2000) and the ozone evolution agreed well with data (Sinnhuber et al., 2000). To investigate ozone change based on SLIMCAT, we calculated ozone loss in several ways. The net ozone loss can be found by summing all the production and loss terms. The loss calculated this way agrees extremely well with loss calculated as the difference between a passive ozone tracer and the modelled ozone (Millard et al., 2002). In addition, for this study we have also calculated the ozone loss by using the O3/CFC-11 tracer relationship calculated in the model. Thus, the model data for each flight date are grouped into ensembles and treated in the same way as the measurements. For our region of interest at potential temper-atures below 500 K, the ozone loss derived in this way from the model fields also agrees extremely well with the loss de-rived directly by the two other methods described above. In-vestigations into the possible impact of vortex inhomogene-ity on model ozone loss calculations show that the
maxi-mum variability in ozone loss along 5◦ PV equivalent
lati-tude bands reached 27% in mid January 2000. This ozone loss variability then remained below 18% from the begin-ning of February onward, between 440 K and 500 K poten-tial temperature (Millard et al., 2002). The low variability in vortex ozone loss makes the use of balloon based mea-surements as indicators of vortex average ozone loss partic-ularly relevant in this winter. SLIMCAT diagnosed ozone loss rates in 1999/2000 agree well with “Match” diagnosed ozone loss until March 2000. Thereafter, SLIMCAT underes-timates the rate of ozone loss by∼2 ppbv per sunlit hour due
CFC-11, pptv
0 50 100 150 200 250 300
O3
,
p
pbv
-500 0 500 1000 1500 2000 2500 3000 3500 4000
CFC-11, pptv
0 50 100 150 200 250 300
O3
,
p
pbv
-500 0 500 1000 1500 2000 2500 3000 3500 4000
a
early Dec 1999b
late Jan 2000 early Mar 00
late Jan 00
Fig. 7.The relationship between SLIMCAT CFC11 and ozone for the DIRAC/DESCARTES merged flight dates (panela: early December
and late January; panelb: late January and early March). Solid lines are 1st order regression fits to the earlier ensemble in each panel, dashed
lines are 1st order regression fits to the later ensemble in each panel. Note: two regression lines are used for the early March ensemble in panel b, one through all the points where we diagnose ozone loss and another from the highest ozone loss point to the top of the ozone depleted zone.
O3, ppbv
-1600 -1200 -800 -400 0
P
o
te
nt
ia
l t
em
pe
ra
tur
e, K
250 300 350 400 450 500 550 600
mid Dec to late Jan late Jan to early Mar DIRAC/DESCARTES
27 Jan to 5 Mar (Bonbon/LACE) SLIMCAT Dec to Jan
SLIMCAT Jan to Mar
Fig. 8. The vertical distribution of ozone change from early
De-cember to late January and from late January to early March derived from the relationships between CFC11 and ozone for the merged DIRAC/DESCARTES flights (DIRAC CFC-11 bias-corrected). Also shown is the profile of ozone change between 27 January and 5 March based on the Bonbon and LACE data. The SLIMCAT vertical ozone change (calculated from the model
O3/CFC-11 correlations) is shown for the same periods as the
merged DIRAC/DESCARTES ozone change plots.
by horizontal bars) are the addition in quadrature of the stan-dard errors for the ozone mixing ratios in the regressions defining the O3/CFC11 relations (shown in Fig. 6). The mea-surements show only a small ozone loss in the 400–450 K re-gion between December and January. We caution that the er-ror bars on this derived loss are large and preclude any more definitive conclusions regarding the January ozone loss. Also shown in Fig. 8 is the altitudinal ozone change for the pe-riod from 25 January to 5 March obtained by plotting the ozone difference for fixed CFC11 values against the poten-tial temperatures for the 5 March flight ensemble. During this period there was substantial ozone loss with a maximum of about 1200 ppbv in the 440–470 K region with ozone loss to a lesser extent down to about 370 K. Figure 8 also shows the altitude distribution of ozone change using the Bonbon and LACE data for the period 27 January to 5 March calcu-lated using the same methodology as with the DIRAC and DESCARTES data. There is an excellent agreement in both the magnitude and position of the ozone loss maximum and both data sets show ozone loss extending down to the 370– 380 K region.
to late January period. This is reminiscent of the change based on our observations discussed above, but we must em-phasise again that the errors here are significant. The model shows a maximum ozone loss of 1300 ppbv at 480 K for the late January to early March period, very similar to the loss derived from the measurements.
5 Conclusions
The ascent data from DIRAC and DESCARTES provide a set of CFC11 profiles from a total of nine balloon flights made during the 1999/2000 Arctic winter. These vertical profiles compare well qualitatively with SLIMCAT CFC11 profiles for the same dates and location. There is good quantitative agreement below 400 K; above this level the model has too weak descent. Observations of ClO on the 8 March flight are in good agreement with ClO output for the SLIMCAT model in the region where we derive ozone loss below about 500 K, adding confidence to the model’s derived ozone loss in the vortex.
Using ECC ozonesonde data from the balloon flights in-side the vortex (or from small balloons launched soon after) changes in the O3/CFC11 relationship are observed through-out the winter. Grouping the flights into ensembles and merg-ing the DIRAC and DESCARTES data provides a means of estimating the vertical change in ozone concentration from early December to late January and from late January to early March. SLIMCAT ozone and CFC-11 data generated for the same dates and location as the measurements are grouped into the same ensembles and treated identically to the mea-surement data. The merged flight ensembles show a very small ozone loss, with large uncertainty, between early De-cember and late January, the model shows slight ozone loss (<300 ppbv in the 450–550 K region). Between late January and early March the merged measurements show a maximum ozone loss of 1200 ppbv in the 440–470 K region which com-pares excellently with the maximum loss calculated by the model (1300 ppbv at 480 K).
A thorough comparison of ozone loss rates requires a de-tailed examination of the conditions (period, altitude, loca-tion) over which the ozone loss occurs (Harris et al., 2002) and is beyond the scope of this study. However simple com-parisons with the other studies in the 1999/2000 winter (Hop-pel et al., 2002; Klein et al., 2002; M¨uller et al., 2003 and dis-cussion therein; Rex et al., 2002; Richard et al., 2001; Salaw-itch et al., 2002; Schoeberl et al., 2002; summary in Table 8 of Newman et al., 2002) show good agreement. We find that the peak loss occurred in the 440–470 K region, which is the same as M¨uller et al. (2003), at the low end of the range. Our peak loss of 1200 ppbv is less than those of some other studies (e.g. 2000 ppbv of Rex et al. (2002) and 1800 ppbv of Richard et al. (2001)), but this is at least partly related to the earlier end to the period we consider. The cumulative ozone loss reported by Match on about March 5 (the average
date of our March flights) is about 1500 ppbv (Fig. 6 in Rex et al., 2002), within the estimated uncertainties of the two techniques.
Finally, the study shows that in winters when the polar vor-tex is relatively undisturbed, tracer ozone relationships mea-sured from a single location (and model output also) can be used to provide ozone loss estimates which are in good agree-ment with the modelled ozone loss for the vortex core as a whole.
6 Appendix: DIRAC measurement quality
Here follows a discussion in more detail on the performance of DIRAC during the campaign with particular emphasis on the factors which effect the accuracy, precision and measure-ment bias. First are listed the effects for which a correction has been applied, followed by a list of effects which cannot be corrected with the housekeeping data available (the instru-ment which made the flights was lost on a stray balloon on its fifth flight of the campaign and so post-campaign tests could not be performed). At the end of the Appendix is a discussion on the bias correction which we apply to the DIRAC data for the four flights made during this campaign.
6.1 Instrument effects: data correction applied
In-flight calibration. All data during the flights were cali-brated using in-flight instrument response curves which were generated on the launch pad and also at float. There was al-most no significant difference between instrument sensitivity between the launch pad and float calibrations (Fig. 1 of the text) which demonstrates high instrument stability. No inter-mediate calibrations were performed between ascent samples leading to the assumption that any change in instrument sen-sitivity was linear with time between the launch pad and float calibrations.
Post campaign calibration. In August 2000 (4 to 5 months after the campaign) we received a NOAA-CMDL calibrated cylinder of Niwot Ridge air. This was compared in our labo-ratory (using another GC-ECD instrument) to the calibration cylinder which was used to fill the DIRAC onboard calibra-tion gas bottle during the campaign (a synthetic CFC mixture in a nitrogen balance with a nominal CFC-11 mixing ratio of 250 pptv). This provided a link to the NOAA-CMDL calibra-tion scale for CFC-11. The estimated uncertainty for CFC-11 in the NOAA-CMDL sample was 1%, and additional uncer-tainties incurred in comparing this to our working calibration mixture for the campaign brings the measurement accuracy estimate to 2.5%. An assumption here is that that was no change in the mixing ratio of CFC-11 in our campaign cal-ibration gas between its use for the DIRAC flights and the comparison with the NOAA-CMDL cylinder.
previous DIRAC flights as a result of a new switching valve with an unexpectedly high flow resistance which could not be changed during the campaign. Owing to this lower than ex-pected sample flow, a time correction was applied to account for the time taken for sample air to pass through the inlet manifold to the adsorbent trap. This correction was based on the measured mass flow logged during each sampling phase and an estimate of the total volume of the inlet manifold up-stream from the adsorbent trap. Time corrections for samples above 400 K ranged from 20 to 60 s. An assumption here is that sample air is flushed through the inlet manifold as plug flow (i.e. with no mixing in the sampling line).
6.2 Instrument effects: no data correction applied
Non-plug flow effects. As mentioned earlier, the sample time stamps were corrected for the time delay in air enter-ing the inlet and arriventer-ing at the adsorbent bed. However, this assumed plug flow and no corrections are made for non-plug flow effects. We think that this problem was encountered during this campaign and was likely caused by dead volume in the system (e.g. in the pump chambers). Low pressure tests with DIRAC-B show that at low sample flow a small but significant fraction of air from lower altitude remains in the dead volume of the sample pathway (DIRAC-A made the SOLVE-THESEO 2000 measurements but was lost on a later flight in the campaign). This impacts on the measure-ments above 400 K, causing a systematic bias toward higher reported CFC11 values. The implementation of a new pump-ing system has since minimised this problem on the instru-ment.
6.3 Bias corrected DIRAC dataset
To fully investigate the bias in the DIRAC data from the campaign the CFC-11 measurements were compared to those from the LACE instrument on the 5 March 2000 flight (which flew on the same gondola as DIRAC). The LACE measure-ments were first interpolated to the DIRAC sampling levels so that a difference plot could be constructed. At altitudes below 400 K the DIRAC measurements were less than 10% higher than those from LACE. At 450 K the DIRAC mea-surements were a factor 2 higher than LACE and by 475 K there was a factor 3 difference. A 3rd degree polynomial fit through the difference plot was then used to make a bias cor-rection for the other three DIRAC flights made during the campaign. As a check on the consistency of the bias cor-rection the bias-corrected DIRAC profile from the 27 Jan-uary 2000 flight was compared to the data from Bonbon on the same day (this instrument flew∼2 h before DIRAC). The
bias-corrected data was in excellent agreement with that from Bonbon up to 470 K. Note that this bias-corrected DIRAC dataset is used in all figures and for the ozone loss estimates based on the change in the O3/CFC-11 relations.
In order to examine the effect of the bias in the DIRAC data on the ozone loss estimates we recalculated the ozone change for the two periods of the study using the bias cor-rected DIRAC data merged with the DESCARTES data. The difference in the profiles of ozone change between the biased and bias-corrected dataset was small (<150 ppb O3)and well within the error of the estimates, so the bias-correction does not influence our estimated ozone loss.
Acknowledgements. We gratefully acknowledge the following for their financial support: the Research DG of the European
Commission through the THESEO O3 loss (ENV4-CT97-0510),
THESEO-EuroSOLVE (EVK2-CT-1999-00047) and CRUSOE (EVK2-1999-00252, EVK2-CT-2001-20012) projects; the UK Natural Environment Research Council through its UTLS Ozone programme; the NERC UK Universities Global Atmospheric Modelling Programme (UGAMP) and the NERC Centre of At-mospheric Science (NCAS); the UK Department of Environment, Transport and Regions through its Global Atmospheres Division (EPG 1/1/83); and US National Science Foundation. We would also like to acknowledge CNES, Esrange and NASA for provision of the flights we had during SOLVE-THESEO 2000 and W. Brune for his assistance during the OMS in situ flight. Genevieve Millard thanks the EPSRC for a studentship. We thank A. Hauchecorne for provision of MIMOSA PV maps.
Edited by: V. Fomichev
References
Bauer, R., Engel A., Franken H., Klein, E., Kulessa, G., Schiller, C., Schmidt, U., Borchers, R. and Lee, J.: Monitoring the vertical structure of the arctic polar vortex over northern Scandinavia
dur-ing EASOE – regular N2O profile observations, Geophys. Res.
Lett., 21, 1211–1214, 1994.
Bregman, A., Lelieveld, J., van den Broek, M. M. P., Siegmund, P.
C., Fischer, H., and Bujok, O.: N2O and O3relationship in the
lowermost stratosphere: A diagnostic for mixing processes as represented by a three-dimensional chemistry-transport model, J. Geophys. Res., 105, 17 279–17 290, 2000.
Chipperfield, M. P., Lee, A. M., and Pyle, J. A.: Model calcula-tions of ozone depletion in the Arctic polar vortex for 1991/92 to 1994/95, Geophys. Res. Lett., 23, 559–562, 1996.
Chipperfield, M. P.: Multi-annual simulations with a
three-dimensional chemical transport model, J. Geophys. Res., 104, 1781–1805, 1999.
Danis, F., Harris, N. R. P., Taylor, W. H., McIntyre, J. D., Sim-monds, P. G., and Pyle, J. A.: DESCARTES: A novel lightweight balloon-borne instrument for measurement of halocarbons, Rev. Sci. Instr., 70, 271–280, 2000.
DeMore, W. B., Sander, S. P., Golden, D. M., Hampson, R. F., Kurylo, M. J., Howard, C. J., Ravishankara, A. R., Kolb, C. E., and Molina, M. J.: Chemical kinetics and photochemical data for use in stratospheric modelling, Evaluation 12, JPL Publ., 97-4, 1997.
and Khattatov, V.: Depletion of column ozone in the Arctic dur-ing the winters 1993–94 and 1994–95, J. Atmos. Chem., 32, 1– 34, 1999.
Guirlet, M., Chipperfield, M. P., Pyle, J. A., Goutail, F., Pom-mereau, J.-P., and Kyr¨o, E.: Modelled Arctic ozone depletion in winter 1997/1998 and comparison with previous winters, J. Geophys. Res., 105, 22 185–22 200, 2000.
Harris, N. R. P., Rex, M., Goutail, F., Knudsen, B. M., Manney, G. L., M¨uller, R., and von der Gathen, P.: Comparison of empiri-cally derived ozone losses in the Arctic vortex, J. Geophys Res., 107 (D20), 8264, doi:10.1029/2001JD000482, 2002.
Hauchecorne, A., Godin, S., Marchand, M., Heese, B., and Souprayen, C.: Quantification of the transport of chemical constituents from the polar vortex to middle latitudes in the lower stratosphere using the high-resolution advection model MIMOSA and effective diffusivity, J. Geophys. Res., 107 (D20), 8289, doi:10.1029/2001JD000491, 2002.
Hoppel, K., Bevilacqua, R., Nedoluha, G., Deniel, C., Lef`evre, F., Lumpe, J., Fromm, M., Randall, C., Rosenfield, J., and Rex, M.: POAM III observations of Arctic ozone loss for the 1999/2000 winter, J. Geophys. Res., 107 (D20), 8262, doi:10.1029/2001JD000476, 2002.
Kawa, S. R., Bevilacqua, R. M., Margitan, J. J., Douglass, A. R., Schoeberl, M. R., Hoppel, K. W., and Sen, B.: Interaction be-tween dynamics and chemistry of ozone in the setup phase of the Northern Hemisphere polar vortex, J. Geophys. Res., 108 (D5), pp. SOL 53-1, CiteID 8310, doi:10.1029/2001JD001527, 2002. Klein, U., Wohltmann, I., Lindner, K., and K¨unzi, K. F.: Ozone
de-pletion and chlorine activation in the Arctic winter 1999/2000
observed in Ny- ˚Alesund, J. Geophys. Res., 107 (D20), 8288,
doi:10.1029/2001JD000543, 2002.
Knudsen, B. M., Larsen, N., Mikkelsen, I. S., Morcrette, J.-J., Braa-then, G. O., Kyr¨o, E., Fast, H., Gernandt, H., Kanzawa, H., Nakane, H., Dorokhov, V., Yushkov, V., Hansen, G., Gil, M., and Shearman, R. J.: Ozone depletion in and below the Arctic vortex for 1997, Geophys. Res. Lett., 25, 627–630, 1998. Lary, D. J. and Pyle, J. A.: Diffuse radiation, twilight and
photo-chemistry, J. Atmos. Chem., 13, 373–392, 1991.
Lucic, D., Harris, N. R. P., Pyle, J. A., and Jones, R. L.: A technique for estimating polar ozone loss: results for the northern 1991/92 winter using EASOE data, J. Atmos. Chem., 34, 365–383, 1999. Manney, G. L., Froidevaux, L., Santee, M. L., and Waters, J. W.: MLS observations of Arctic ozone loss in 1996/97, Geophys. Res. Lett., 24, 2697–2700, 1997.
Millard, G. A.: Numerical modelling of polar and middle latitude ozone loss, PhD. thesis, University of Cambridge, UK, 2002. Millard, G. A., Lee, A. M., and Pyle, J. A.: A model study of
the connection between polar and mid-latitude ozone loss in the northern hemisphere lower stratosphere, J. Geophys Res., 108, 8323, doi:10.1029/2001JD000899, 2002.
Moore, F. L., Elkins, J. W., Ray, E. A., Dutton, G. S., Dunn, R. E., Fahey, D. W., McLaughlin, R. J., Thompson, T. L., Ro-mashkin, P. A., Hurst, D. F., and Wamsley, P. R.: Balloon-borne in situ gas chromatograph for measurements in the tro-posphere and stratosphere, J. Geophys Res., 103 (D5), 8330, doi:10.1029/2001JD000891, 2003.
M¨uller, R., Schmidt, U., Engel, A., McKenna, D. S., and Proffitt, M.
H.: The O3/N2O relation from balloon-borne observations as a
measure of Arctic ozone loss in 1991/92, Q. J. R. Meterol. Soc.,
127, 1389–1412, 2001.
M¨uller, R., Tilmes, S., Grooß, J.-U., McKenna, D. S., M¨uller, M., Schmidt, U., Toon, G. C., Stachnik, R. A., Margitan, J. J., Elkins, J. W., Arvelius, J., and Russell III, J.M.: Chlorine acti-vation and chemical ozone loss deduced from HALOE and bal-loon measurements in the Arctic during the winter of 1999–2000, J. Geophys. Res., 107, 8302, doi:10.1029/2001JD001423, 2002. [printed 108 (D5), 2003].
Newman, P. A., Harris, N. R. P., Adriani, A., Amanatidis, G. T., Anderson, J. G., Braathen, G. O., Brune, W. H., Carslaw, K. S., Craig, M. S., DeCola, P. L., Guirlet, M., Hipskind, R. S., Kurylo, M. J., Kullmann, H., Larsen, N., Megie, G. J., Pommereau, J.-P., Poole, L. R., Schoeberl, M. R., Stroh, F., Toon, O. B., Trepte, C. R., and van Roozendael, M.: An Overview of the SOLVE-THESEO 2000 Campaign, J. Geophys Res., 107 (D20), 8259, doi:10.1029/2001JD001303, 2002.
Pierson, J. M., McKinney, K. A., Toohey, D. W., Margitan, J., Schmidt, U., Engel, A., and Newman, P. A.: An investigation of C1O photochemistry in the chemically perturbed Arctic vortex, J. Atmos. Chem., 32, 61–81, 1999.
Pommereau, J.-P. and Piquard, J.: Ozone, nitrogen dioxide and aerosol vertical distributions by UV-visible solar occultation from balloons, Geophys. Res. Lett., 21, 1227–1230, 1994. Prather, M. J.: Numerical advection by conservation of
second-order moments, J. Geophys. Res., 104, 6671–6681, 1986. Proffitt, M. H., Margitan, J. J., Kelly, K. K, Lowenstein, M.,
Podolske, J. R., and Chan, K.: Ozone loss in the Arctic polar vortex inferred from high-altitude aircraft measurements, Nature, 347, 31–36, 1990.
Proffitt, M. H., Aikin, K., Margitan, J. J., Lowenstein, M., Podolske, J. R., Weaver, A., Chan, K. R., Fast, H., and Elkins, J. W.: Ozone loss inside the northern polar vortex during the 1991–1992 win-ter, Science, 261, 1150–1154, 1993.
Pyle, J. A., Carver, G. D., and Schmidt, U.: Some case studies of chlorine activation during the EASOE campaigns, Geophys. Res. Lett., 21, 1431–1434, 1994.
Ray, E. A., Moore, F. L., Elkins, J. W., Dutton, G. S., Fahey, D. W., V¨omel, H., Oltmans, S. J., and Rosenlof, K. H.: Transport into the NH lowermost stratosphere revealed by in situ tracer mea-surements, J. Geophys. Res., 104, 26 565–26 580, 1999. Ray, E. A., Moore, F. L., Elkins, J. W., Hurst, D. F., Romashkin,
P. A., Dutton, G. S., and Fahey, D. W.: Descent and mix-ing in the 1999–2000 northern polar vortex inferred from in situ tracer measurements, J. Geophys. Res., 107 (D20), 8285, doi:10.1029/2001JD000961, 2002.
Rex, M., von der Gathen, P., Braathen, G. O., Reid, S. J., Harris, N. R. P., Chipperfield, M., Reimer, E., Beck, A., Alfier, R., Kruger-Carstensen, R., De Backer, H., Balis, D., Zerefos, C., O’Connor, F., Dier, H., Dorokhov, V., Fast, H., Gamma, A., Gil, M., Kyr¨o, E., Rummukainen, M., Litynska, Z., Mikkelsen, I. S., Molyneux, M., and Murphy, G.: Chemical ozone loss in the Arctic winter 1994/95 as determined by the match technique, J. Atmos. Chem., 32, 35–39, 1999.
Loewen-stein, M., Podolske, J. R., Webster, C. R., Flesch, G. J., Scott, D. C., Herman, R. L., Elkins, J. W., Ray, E. A., Moore, F. L., Hurst, D. F., Romashkin, P., Toon, G. C., Sen, B., Margitan, J. J., Wennberg, P., Neuber, R., Allart, M., Bojkov, B. R., Claude, H., Davies, J., Davies, W., De Backer, H., Dier, H., Dorokhov, V., Fast, H., Kondo, Y., Kyr¨o, E., Litynska, Z., Mikkelsen, I. S., Molyneux, M. J., Moran, E., Nagai, T., Nakane, H., Parrondo, C., Ravegnani, F., Skrivankova, P., Viatte, P., and Yushkov, V.: Chemical depletion of Arctic ozone in winter 1999/2000, J. Geo-phys Res., 107 (D20), 8276, doi:10.1029/2001JD000533, 2002. Richard, E. C., Aikin, K., Andrews, A. E., Daube Jr., B. C., Gerbig,
C., Wofsy, S. C., Romanshkin, P. A., Hurst, D. F., Ray, E. A., Moore, F. L., Elkins, J. W., Deshler, T., and Toon, G. C.: Se-vere chemical ozone loss inside the Arctic polar vortex during winter 1999–2000 inferred from in situ airborne measurements, Geophys. Res. Lett., 28, 2197–2200, 2001.
Robinson, A. D., McIntyre, J., Harris, N. R. P., Pyle, J. A., Sim-monds, P. G., and Danis, F.: A lightweight balloon-borne gas chromatograph for in situ measurements of atmospheric halocar-bons, Rev. Sci. Instr., 71, 4553–4560, 2000.
Salawitch, R. J., Margitan, J. J., Sen, B., Toon, G. C., Osterman, G. B., Rex, M., Elkins, J. W., Ray, E. A., Moore, F. L., Hurst, D. F., Romashkin, P. A., Bevilacqua, R. M., Hoppel, K. W., Richard, E. C., and Bui, T. P.: Chemical Loss of Ozone dur-ing the Arctic Winter of 1999–2000: An Analysis Based on Balloon-Borne Observations, J. Geophys Res., 107 (D20), 8269, doi:10.1029/2001JD000620, 2002.
Schoeberl, M. R., Proffitt, M. H., Kelly, K. K., Lait, L. R., Newman, P. A., Rosenfield, J. E., Lowenstein, M., Podolske, J. R., Strahan, S. E., and Chan, K. R.: Stratospheric constituent trends from ER-2 profile data, Geophys. Res. Lett., 17, 469–4ER-27, 1990.
Schoeberl, M. R., Newman, P. A., Lait, L. R., McGee, T., Burris, J., Browell, E. V., Grant, W., Richard, E., von der Gathen, P., Bevilacqua, R., and Mikkelsen, I. S.: An assessment of the ozone loss during the 1999–2000 SOLVE Arctic campaign, J. Geophys. Res., 107 (D20), 8261, doi:10.1029/2001JD000412., 2002.
Schmidt, U., Bauer, R., Khedim, A., Klein, E., Kulessa, G., and Schiller, C.: Profile observations of long lived trace gases in the Arctic vortex, Geophys. Res. Lett., 18, 767–770, 1991.
Shine, K. P.: The middle atmosphere in the absence of dynamical heat fluxes, Q. J. R. Meteorol. Soc., 113, 603–633, 1987. Sinnhuber, B. M., Chipperfield, M. P., Davies, S., Burrows, J. P.,
Eichmann, K. U., Weber, M., von der Gathen, P., Guirlet, M., Cahill, G. A., Lee, A. M., and Pyle, J. A.: Large loss of to-tal ozone during the Arctic winter of 1999/2000, Geophys. Res. Lett., 27, 3473–3476, 2000.
Solomon, P., Barrett, J., Conner, B., Zoonematkermani, S., Parrish, A., Lee, A., Pyle, J. A., and Chipperfield, M.: Seasonal obser-vations of chlorine monoxide in the stratosphere over Antarc-tica during the 1996–1998 ozone holes and comparison with the SLIMCAT 3D model, J. Geophys. Res., 105, 28 979–29 001, 2000.
Swinbank, R. and O’Neill, A.: A stratosphere-troposphere data as-similation system, Mon. Weather Rev., 122, 686–702, 1994. Vogel, B., M¨uller, R., Deshler, T., Grooß, J.-U., Karhu, J.,
McKenna, D. S., M¨uller, M., Toohey, D., Toon, G. C., and Stroh, F.: Vertical profiles of activated ClO and ozone loss in the Arctic vortex in January and March 2000: In situ observa-tions and model simulaobserva-tions, J. Geophys. Res., 108 (D22), 8334, doi:10.1029/2002JD002564, 2003.
V¨omel, H., Toohey, D. W., Deshler, T., and Kr¨oger, C.: Sun-set observations of ClO in the arctic polar vortex and implica-tions for ozone loss, Geophys. Res. Lett., 28(22), 4183–4186, 10.1029/2001GL013413, 2001.