ACPD
4, 6667–6689, 2004Arctic ozone depletion 2002/2003
T. Christensen et al.
Title Page
Abstract Introduction
Conclusions References
Tables Figures
◭ ◮
◭ ◮
Back Close
Full Screen / Esc
Print Version
Interactive Discussion
©EGU 2004 Atmos. Chem. Phys. Discuss., 4, 6667–6689, 2004
www.atmos-chem-phys.org/acpd/4/6667/ SRef-ID: 1680-7375/acpd/2004-4-6667 © European Geosciences Union 2004
Atmospheric Chemistry and Physics Discussions
Vortex-averaged Arctic ozone depletion in
the winter 2002/2003
T. Christensen1, B. M. Knudsen1, M. Streibel2, S. B. Andersen1, A. Benesova3, G. Braathen4, H. Claude5, J. Davies6, H. De Backer7, H. Dier8, V. Dorokhov9, M. Gerding10, M. Gil11, B. Henchoz12, H. Kelder13, R. Kivi14, E. Kyr ¨o14,
Z. Litynska15, D. Moore16, G. Peters8, P. Skrivankova3, R. St ¨ubi12, T. Turunen14, G. Vaughan17, P. Viatte12, A. F. Vik4, P. von der Gathen2, and I. Zaitcev9
1
Danish Meteorological Institute, Copenhagen, Denmark
2
Alfred Wegener Institute for Polar and Marine Research, Potsdam, Germany
3
Czech Hydrometeorological Institute, Prague, Czech Republic
4
Norwegian Institute for Air Research, Kjeller, Norway
5
Deutscher Wetterdienst, Hohenpeißenberg, Germany
6
Environment Canada, Downsview, Ontario, Canada
7
Royal Meteorological Institute, Brussels, Belgium
8
Deutscher Wetterdienst, Lindenberg, Germany
9
Central Aerological Observatory, Dolgoprudny, Moscow Region, Russia
10
Leibniz-Institue of Atmospheric Physics, K ¨uhlungsborn, Germany
11
Instituto Nacional de T ´echnica Aerospacial, Madrid, Spain
12
MeteoSwiss, Payerne, Switzerland
13
ACPD
4, 6667–6689, 2004Arctic ozone depletion 2002/2003
T. Christensen et al.
Title Page
Abstract Introduction
Conclusions References
Tables Figures
◭ ◮
◭ ◮
Back Close
Full Screen / Esc
Print Version
Interactive Discussion
©EGU 2004
14
Finnish Meteorological Institute, Sodankyl ¨a, Finland
15
IMWM, Centre of Aerology, Legionowo, Poland
16
UK Met Office, Exeter, UK
17
University of Wales, Aberystwyth, UK
ACPD
4, 6667–6689, 2004Arctic ozone depletion 2002/2003
T. Christensen et al.
Title Page
Abstract Introduction
Conclusions References
Tables Figures
◭ ◮
◭ ◮
Back Close
Full Screen / Esc
Print Version
Interactive Discussion
©EGU 2004
Abstract
A total ozone depletion of 68 Dobson units from 10 December 2002 to 10 March 2003 is derived by the vortex-average method taking into account both diabatic descent of the air masses and transport of air into the vortex. When the vortex is divided into three equal-area regions, the results are 85 DU for the collar region (closest to the 5
edge), 52 DU for the vortex centre and 68 DU for the middle region in between centre and collar.
1. Introduction
The ozone content in the Arctic stratosphere is dependent on chemical and dynamical conditions and shows great interannual variability. Chemical ozone loss occurs during 10
winter when the polar vortex isolates air masses which exhibit significantly lower av-erage temperatures than the air surrounding the vortex. In very cold conditions polar stratospheric clouds (PSCs) can form and in sunlit conditions give rise to large chem-ical ozone losses. The forming, evolution and break-up of the vortex as well as the occurence of stratospheric warmings are subject to huge variations from each winter 15
to the next.
The major part of the March Arctic column ozone decrease and varibility increase observed in the period 1992–2000 can be explained by chemical ozone destruction in winter and spring (Andersen and Knudsen, 2002). During the past four decades the coldest winters, where extreme ozone losses occur, have grown colder, and the 20
record volume coverage of PSCs has increased steadily. The reason for this change in polar vortex climate conditions is not entirely explained. An empirical linear relation be-tween PSC volume and chemical polar ozone loss is reported byRex et al.(2004) who conclude that about 15 Dobson units additional ozone loss can be expected for each Kelvin of average Arctic stratospheric cooling. The detailed mechanisms of chemical 25
ACPD
4, 6667–6689, 2004Arctic ozone depletion 2002/2003
T. Christensen et al.
Title Page
Abstract Introduction
Conclusions References
Tables Figures
◭ ◮
◭ ◮
Back Close
Full Screen / Esc
Print Version
Interactive Discussion
©EGU 2004 explained by current models, stressing the importance of continued research in Arctic
ozone losses.
December 2002 was characterized by very low temperatures and large areas of PSCs were deduced by Tilmes et al. (2003). Around mid-January 2003 the vortex became perturbed, and during 19–21 January 2003 the vortex was split in two. In 5
early February 2003, the vortex became more symmetrical, only to experience another splitting around 20 Feburary 2003, into two parts that reunited on 22 February 2003. The vortex eventually broke down around mid-April 2003.
In order to determine the chemical ozone loss from the observational data it is im-portant to separate the effect of dynamics affecting the ozone content. There are two 10
main approaches: Transport can be determined by measurements of long-lived inert tracers or by Langrangian trajectory calculations based on meteorological analyses. A description of five different methods is given byHarris et al.(2002) along with a careful comparison: Using the same regions and time periods for the four different Lagrangian approaches they found good agreement between the methods; better than otherwise 15
seen in the literature. In this work we use an approach known as the vortex-average technique (Harris et al.,2002, and references therein) to filter out the transport. From a large number of trajectories on selected isentropic surfaces the average vertical ad-vection of the vortex-averaged ozone profile is calculated. Our resulting ozone losses are compared to results found using the Match technique.
20
2. Vortex area definitions
Equivalent latitude and potential vorticity (PV) criteria are used to define the extent of the Arctic vortex. The equivalent latitude of an air parcel is the latitude encompassing the same poleward area as the PV-contour through the parcel.
The PV value exhibiting the largest gradient in PV as a function of equivalent latitude 25
ACPD
4, 6667–6689, 2004Arctic ozone depletion 2002/2003
T. Christensen et al.
Title Page
Abstract Introduction
Conclusions References
Tables Figures
◭ ◮
◭ ◮
Back Close
Full Screen / Esc
Print Version
Interactive Discussion
©EGU 2004 to equivalent latitude is smaller than 1 PVU/degree (1 PVU=10−6 K ms kg2) for an isolated
point, the average PV value of the previous and the next day is used. If two or more points have a gradient below this limit, the vortex is considered broken down or not yet established. In such cases the PV value of the “edge” is determined such that the equivalent latitude is the same as for the level above.
5
At 475 K and above the vortex was established by 10 December 2002, and did not break down before April. At 435 K the vortex was established on 2 January 2003. At 400 K and below no vortex existed at any time in the winter 2002/2003.
In Table 1 the PV values defining the vortex edge by the above criteria are given using modified potential vorticity (MPV) defined as (Lait,1994):
10
MPV=PV
θ
475 K −92
, (1)
whereθis the potential temperature.
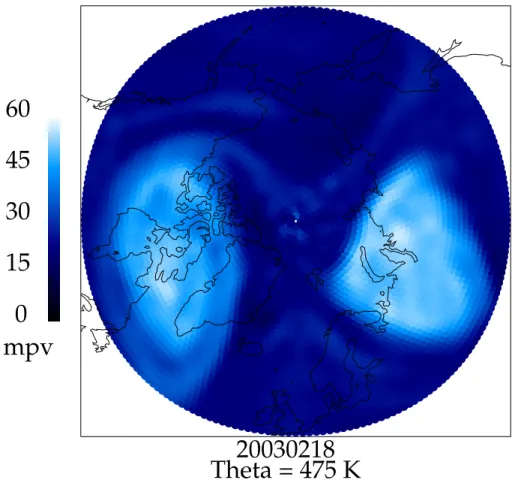
The vortex is divided into three equal-area regions depending on potential vorticity. The lowest potential vorticity region, closest to the edge is called the collar, the region with highest potential vorticity is called the centre and the region in between is called 15
the middle. The vortex regions at 475 K are depicted in Fig.1, and it can be seen that the regions, as in this case where the vortex is highly elongated, can have odd shapes and discontinuities.
3. Observations
The full data set available for this study comprises 603 ozone sondes from 25 stations 20
north of 45◦N in the period from 2 November 2002 to 28 March 2003.
ACPD
4, 6667–6689, 2004Arctic ozone depletion 2002/2003
T. Christensen et al.
Title Page
Abstract Introduction
Conclusions References
Tables Figures
◭ ◮
◭ ◮
Back Close
Full Screen / Esc
Print Version
Interactive Discussion
©EGU 2004 The potential vorticity corresponding to each ozone mixing ratio value is derived from
European Centre for Medium-Range Weather Forecasts (ECMWF) analyses.
From the full ozone sonde data set a mapping of ozone mixing ratio as a function of potential vorticity and potential temperature is made. Sobel et al.(1997) showed that reverse domain-filling trajectory calculations tend to give substantial spurious transport 5
into the vortex due to errors in the analyzed PV. This is partially avoided here by cen-tering the PV bins used in the PV-θmapping at the edge of the vortex (Knudsen et al.,
1998). Eight bins of 6 PVU width centered on 0,±6,±12,±18 and−24 PVU relative to the vortex edge (positive values are inside the vortex) are used.
Only data from the period 10 December 2002 to 10 March 2003 for points within the 10
vortex, as determined by the PV value at eachθlevel, are used in the ozone depletion calculations. Not all sondes have successful measurements at all eightθ levels. At 475 K that leaves 201 sondes.
4. Ozone depletion calculations
4.1. Diabatic descent 15
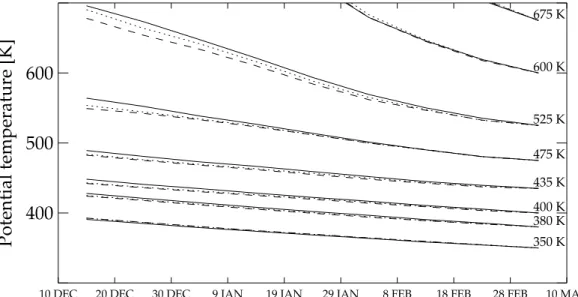
Values obtained early and late in winter at the sameθ level cannot be directly com-pared. Over such a long time interval the diabatic cooling, which is causing a slow descent of air masses across the isentropic surfaces, must be taken into account. Air masses that on 10 March 2003 are at the isentropic surface of 475 K have on average descended from a potential temperature of 556 K since 10 December 2002. 20
This diabatic cooling was calculated along Langrangian trajectories using a reverse domain-filling trajectory approach. The calculations use six hourly ECMWF analyses in a 1.5◦ latitude-longitude grid based on a T79 truncation. The reverse domain-filling trajectory calculations (Knudsen and Grooss, 2000) are perfomed in an equal-area grid with a grid distance of 1◦ by latitude (
∼111 km). The calculations are started on 25
back-ACPD
4, 6667–6689, 2004Arctic ozone depletion 2002/2003
T. Christensen et al.
Title Page
Abstract Introduction
Conclusions References
Tables Figures
◭ ◮
◭ ◮
Back Close
Full Screen / Esc
Print Version
Interactive Discussion
©EGU 2004 wards in time. The calculations are three-dimensional as the potential temperature is
changed by the diabatic heating in each time step. Heating rate calculations are done for clear-sky conditions using the version of the ECMWF radiation scheme (Morcrette,
1991) which became operational in September 2000. The ozone mixing ratios used in the heating rate calculations are obtained from the PV-θmapping (described in Sect.3) 5
of the ozone data. The water vapour mixing ratio used is 4 ppmv from 350 to 400 K, 7 ppmv above 625 K, and a linear variation in between (M ¨uller et al., 2003). Below 350 K the ECMWF water vapour mixing ratio is used.
The accuracy of the diabatic cooling has been checked against tracer descent lines
fromGreenblatt et al.(2002) for the winter 1999/2000 vortex. The comparison is shown
10
in Fig.2. With climatological ozone fromFortuin and Kelder(1998) we obtain a descent from 11 January to 15 March 2000 which is substantially closer to the tracer descent lines than the SLIMCAT (Chipperfield,1999) model.
Taking tracer mixing into account would increase the tracer descent above the bottom levels (Ray et al.,2002), but using actual ozone instead of a climatology would probably 15
also increase the modelled descent, to some extent cancelling the effect. For the 2002/2003 calculations for the period 10 December 2002 to 10 March 2003 the descent to the 475 K level is 81 K using observed ozone and 68 K using the ozone climatology.
The diabatic cooling ten days back in time was calculated for air masses ending inside the vortex. Figure3 shows the calculated diabatic cooling for each of the tree 20
vortex areas (defined in Sect.2) for the period 10 December 2002 to 10 March 2003.
4.2. Transport into the vortex
Air from lower latitudes is to some extent transported across the vortex edge. When the vortex-averaged ozone mixing ratio at the beginning and end of winter are compared to each other in order to determine the chemical ozone depletion, the amount of transport 25
into the vortex must be taken into account.
per-ACPD
4, 6667–6689, 2004Arctic ozone depletion 2002/2003
T. Christensen et al.
Title Page
Abstract Introduction
Conclusions References
Tables Figures
◭ ◮
◭ ◮
Back Close
Full Screen / Esc
Print Version
Interactive Discussion
©EGU 2004 centages of trajectories where air masses ending in the collar stem from outside the
vortex, are given in Table2forθ=475 K. At this isentropic level the transport from out-side the vortex into the middle and centre regions of the vortex is never more than 3%. In the last two columns of Table2 are given the average mixing ratio for the area, as calculated from ozone measurements,χobs, and the average ozone mixing ratio for the 5
entering air parcels,χi nf l ux, estimated by interpolation of the PV-θmapping (described in Sect.3). One trajectory had a PV value falling outside the PV range of the mapping. In this single case the ozone mixing ratio corresponding to the closest PV value within the mapping was used in order to avoid extrapolation.
A corrected ozone mixing ratio, χcorr, considered to represent the air masses that 10
remained within the vortex and was subject to chemical ozone depletion, is calculated as:
χcorr =χobs−rχi nf l ux
1−r , (2)
where r is the number of trajectories entering the vortex area from outside relative to the total number of trajectories ending in the vortex area. This ratio, r, is given as a 15
percentage in Table2for the vortex collar atθ=475 K. This corrected vortex-averaged ozone mixing ratio is used when calculating the total ozone depletion. If a trajectory starts in the vortex, leaves and re-enters the vortex within the same ten day period, that trajectory is counted as if it stayed within the vortex the whole time. If a trajectory leaves the vortex and re-enters in a later ten day period, it is counted as an outside 20
entry in the latter period, and not counted at all in the first period.
The highest entry rate at 475 K is found on 29 January 2003, where 22% of the trajectories show air masses crossing the vortex edge and entering the collar. During the 10 day period 19–29 January the vortex is highly disturbed (see Fig. 1), actually splitting into two parts during 19–21 January (Tilmes et al., 2003). On 18 February 25
ACPD
4, 6667–6689, 2004Arctic ozone depletion 2002/2003
T. Christensen et al.
Title Page
Abstract Introduction
Conclusions References
Tables Figures
◭ ◮
◭ ◮
Back Close
Full Screen / Esc
Print Version
Interactive Discussion
©EGU 2004 ozone mixing ratios 0.4–0.7 ppmv higher than the collar-average.
5. Results
Ozone mixing ratios are binned into ten-day intervals and into the potential vorticity bins representing the vortex collar, middle and centre. The average ozone mixing ratio calculated for each bin, corrected for diabatic descent and the effect of transport into 5
the vortex, are shown in Fig. 5 for six potential temperature levels. With these two effects removed it is reasonable to ascribe the remaining decrease in ozone mixing ratio over time to chemical ozone depletion. The best linear fits to the data points results in the depletion rates given in Table3.
The integrated column ozone loss from 380 K to 525 K from 10 December 2002 to 10
10 March 2003, calculated from the depletion rates in Table3is given in Table4. The vertical integration of the ozone column loss is approximated by a sum, cf. Atkinson
and Plumb (1997, their Eq. A5). It is assumed that no chemical ozone loss take place above 525 K and below 380 K, but actually there might have been a small amount of chemical ozone depletion at 350 K since PSC’s were predicted at this level and the 15
depletion rate found is non-zero. Calculating the column ozone loss from 350 K to 525 K averaging over the whole vortex gives 94 DU. The fact that no vortex existed at 400 K and below impairs the confidence in the calculations at these levels, but does not entirely remove their significance.
6. Comparison with Match
20
ACPD
4, 6667–6689, 2004Arctic ozone depletion 2002/2003
T. Christensen et al.
Title Page
Abstract Introduction
Conclusions References
Tables Figures
◭ ◮
◭ ◮
Back Close
Full Screen / Esc
Print Version
Interactive Discussion
©EGU 2004 described by Streibel (to be submitted, 2004)1. In order to compare our results with the
Match results we here adopt common vortex edge criteria: The vortex edge in units of MPV is the same for all potential temperatures. From 10 December 2002 to 9 January 2003 the edge value increases monotonically from to 31 to 36 PVU, and thereafter it is fixed at 36 PVU. Due to the consistency of Match analyses from year to year the 5
levels available for comparisons are Match air masses ending at 380, 400, 425, 450, 475 and 500 K on 30 March 2003, even though the common period of comparison is 10 December 2002 to 10 March 2003 for both the Match and our approach. The Match air masses correspond to 389, 409, 433, 456, 479 and 502 K on 10 March 2003, and we consequently interpolate our results to air masses ending on these values. Accu-10
mulated ozone losses for the four levels relevant for comparison are listed in Table5. Due to differences in vertical resolution comparisons are made only for the levels end-ing on 10 March at 389, 409, 433 and 479 K, those that correspond best to levels in our calculations. The two methods deduce different amounts of diabatic descent which might explain the small discrepancy between the results at the 479 K level where the 15
descent calculations differ the most. Small differences in the subsidence can give rise to large differences in ozone loss as the loss rate can vary significantly with height.
With the vortex-average method we find a total column loss between 380 and 525 K of 69±1 DU. The quoted uncertainty is based solely on the uncertainty of the linear fits to the ozone mixing ratios. Using the Match technique 75±5 DU is found, integrating 20
from 380 to 500 K. For both methods the θ levels defining the integration limits are those of 30 March 2003.
1
ACPD
4, 6667–6689, 2004Arctic ozone depletion 2002/2003
T. Christensen et al.
Title Page
Abstract Introduction
Conclusions References
Tables Figures
◭ ◮
◭ ◮
Back Close
Full Screen / Esc
Print Version
Interactive Discussion
©EGU 2004
7. Conclusions
Using a vortex-edge definition based on the location of the steepest gradient in po-tential vorticity the vortex-averaged ozone depletion for the Arctic winter and spring 2002/2003 is deduced, taking into account the dynamics that also effect the ozone con-tent: diabatic descent of the air masses during the period and transport of air masses 5
over the vortex edge.
The resulting total column ozone-losses presented in Table 4 are not significantly affected by air entering the vortex from outside. Without transport over the vortex edge taken into account, the ozone loss would be 3 DU less for the collar region and 1 DU less for the whole vortex. The expected effect of transport over the vortex edge is an 10
influx of air of lower ozone content, but under the disturbed meteorological conditions with two vortex splittings, it is possible that much of the influx is ozone-rich polar air re-entering the vortex.
Comparisons with ozone losses derived for the same period, 10 December 2002 to 10 March 2003, by the Match technique show good agreement. Great care was taken 15
to use not only the same time period but also the same vortex edge definition and, to the extent possible, the same height interval for the comparison.
Acknowledgements. We thank ECMWF for providing analyses and J.-J. Morcrette for making the ECMWF radiative scheme available to us. Numerous ozone sonde staff are thanked for their contribution. This work was supported by the EU fifth framework programme through the 20
QUOBI project (EVK2-CT-2001-00129).
References
Andersen, S. B. and Knudsen, B. M.: The influence of vortex ozone depletion on Arctic ozone trends, Geophys. Res. Lett., 29, doi:10.1029/2001GL014595, 2002. 6669
Atkinson, R. J. and Plumb, R. A.: Three-dimensional ozone transport during the ozone hole 25
ACPD
4, 6667–6689, 2004Arctic ozone depletion 2002/2003
T. Christensen et al.
Title Page
Abstract Introduction
Conclusions References
Tables Figures
◭ ◮
◭ ◮
Back Close
Full Screen / Esc
Print Version
Interactive Discussion
©EGU 2004 Chipperfield, M. P.: Multiannual simulations with a three-dimensional chemical transport model,
J. Geophys. Res., 104, 1781–1806, 1999. 6673
Fortuin, P. and Kelder, H.: An ozone climatology based on ozonesonde and satellite measure-ments, J. Geophys. Res., 103, 31 709–31 734, 1998. 6673
Greenblatt, J. B., Jost, H.-J., Loewenstein, M., Podolske, J. R., Hurst, D. F., Elkins, J. W., 5
Schauffler, S. M., Atlas, E. L., Herman, R. L., Webster, C. R., Bui, T. P., Moore, F. L., Ray, E. A., Oltmans, S. J., V ¨omel, H., Blavier, J.-F., Sen, B., Stachnik, R. A., Toon, G. C., Engel, A., M ¨uller, M., Schmidt, U., Bremer, H., Pierce, R. B., Sinnhuber, B.-M., Chipperfield, M., and Lef `evre, F.: Tracer-based determination of vortex descent in the 1999/2000 Arctic win-ter, J. Geophys. Res., 107, doi:10.1029/2001JD000937, (Erratum: J. Geophys. Res., 108, 10
doi:10.1029/2001JD001597), 2002. 6673,6686
Harris, N. R. P., Rex, M., Goutail, F., Knudsen, B. M., Manney, G. L., M ¨uller, R., and von der Gathen, P.: Comparison of empirically derived ozone losses in the Arctic vortex, J. Geophys. Res., 107, doi:10.1029/2001JD000482, 2002. 6670
Knudsen, B. M. and Grooss, J.-U.: Northern mid-latitude stratospheric ozone dilution in spring 15
modeled with simulated mixing, J. Geophys. Res., 105, 6885–6890, 2000. 6672
Knudsen, B. M., Larsen, N., Mikkelsen, I. S., Morcrette, J.-J., Braathen, G. O., Kyr ¨o, E., Fast, H., Gernandt, H., Kanzawa, H., Nakane, H., Dorokhov, V., Yushkov, V., Hansen, G., Gil, M., and Shearman, R. J.: Ozone depletion in and below the Arctic vortex for 1997, Geophys. Res. Lett., 25, 627–630, 1998. 6672
20
Lait, L. R.: An Alternative Form for Potential Vorticity, J. Atmos. Sci., 51, 1754–1759, 1994.
6671
Morcrette, J.-J.: Radiation and Cloud Radiative Properties in the ECMWF Operational Weather Forecast Model, J. Geophys. Res., 96, 9121–9132, 1991. 6673
M ¨uller, M., Neuber, R., Fierli, F., Hauchecorne, A., V ¨omel, H., and Oltmans, S. J.: Strotospheric 25
water vapour as tracer for Vortex filamentation in the Arctic winter 2002/2003, Atmos. Chem. Phys., 3, 1991–1997, 2003,
SRef-ID: 1680-7324/acp/2003-3-1991. 6673
Ray, E. A., Moore, F. L., Elkins, J. W., Hurst, D. F., Romashkin, P. A., Dutton, G. S., and Fahey, D. W.: Descent and mixing in the 1999–2000 northern polar vortex inferred from in situ tracer 30
measurements, J. Geophys. Res., 107, doi:10.1029/2001JD000961, 2002. 6673
ACPD
4, 6667–6689, 2004Arctic ozone depletion 2002/2003
T. Christensen et al.
Title Page
Abstract Introduction
Conclusions References
Tables Figures
◭ ◮
◭ ◮
Back Close
Full Screen / Esc
Print Version
Interactive Discussion
©EGU 2004 Hoppel, K., Fromm, M., Lumpe, J., K ¨ullmann, H., Kleinb ¨ohl, A., Bremer, H., von K ¨onig,
M., K ¨unzi, K., Toohey, D., V ¨omel, H., Richard, E., Aikin, K., Jost, H., Greenblatt, J. B., Loewenstein, M., Podolske, J. R., Webster, C. R., Flesch, G. J., Scott, D. C., Herman, R. L., Elkins, J. W., Ray, E. A., Moore, F. L., Hurst, D. F., Romashkin, P., Toon, G. C., Sen, B., Margitan, J. J., Wennberg, P., Neuber, R., Allart, M., Bojkov, B. R., Claude, H., Davies, J., 5
Davies, W., De Backer, H., Dier, H., Dorokhov, V., Fast, H., Kondo, Y., Kyr ¨o, E., Litynska, Z., Mikkelsen, I. S., Molyneux, M. J., Moran, E., Nagai, T., Nakane, H., Parrondo, C., Ravegnani, F., Skrivankova, P., Viatte, P., and Yushkov, V.: Chemical depletion of Arctic ozone in winter 1999/2000, J. Geophys. Res., 107, doi:10.1029/2001JD000533, 2002. 6675
Rex, M., Salawitch, R. J., von der Gathen, P., Harris, N. R. P., Chipperfield, M. P., 10
and Naujokat, B.: Arctic ozone loss and climate change, Geophys. Res. Lett., 31, doi:10.1029/2003GL018844, 2004. 6669
Sobel, A. H., Plumb, R. A., and Waugh, D. W.: Methods of Calculating Transport across the Polar Vortex Edge, J. Atmos. Sci., 54, 2241–2260, 1997. 6672
Tilmes, S., M ¨uller, R., Grooß, J.-U., H ¨opfner, M., Toon, G. C., and Russell III, J. M.: Very early 15
chlorine activation and ozone loss in the Arctic winter 2002–2003, Geophys. Res. Lett., 30, doi:10.1029/2003GL018079, 2003. 6670,6674
ACPD
4, 6667–6689, 2004Arctic ozone depletion 2002/2003
T. Christensen et al.
Title Page
Abstract Introduction
Conclusions References
Tables Figures
◭ ◮
◭ ◮
Back Close
Full Screen / Esc
Print Version
Interactive Discussion
©EGU 2004
Table 1.The limits defining the vortex edge at eight different potential temperature levels. The limits are given as modified potential vorticity (MPV) in units of PVU.
ACPD
4, 6667–6689, 2004Arctic ozone depletion 2002/2003
T. Christensen et al.
Title Page
Abstract Introduction
Conclusions References
Tables Figures
◭ ◮
◭ ◮
Back Close
Full Screen / Esc
Print Version
Interactive Discussion
©EGU 2004
Table 2. Transport of air from outside the vortex into the vortex collar at the 475 K isentropic level. The dates are where the air masses end, i.e. where the trajectory calculations ten days back in time begin. The column Entry gives the percentage of trajectories with air masses ending in the collar that originated from outside the vortex. Sample is the total number of trajectories with air masses ending in the collar. The last two columns give the average mixing ratio as deduced for the entering air mass,χi nf l ux, and as observed for the vortex collar,χobs.
Date Entry Sample Mixing ratio (ppmv)
Influx Observed
20 December 2002 14% 674 2.51 2.94
30 December 2002 9% 678 2.96 3.05
9 January 2003 2% 584 2.71 2.68
19 January 2003 8% 411 2.91 2.56
29 January 2003 22% 493 2.82 2.54
8 February 2003 5% 514 2.71 2.35
18 February 2003 16% 403 2.66 2.37
28 February 2003 6% 416 2.94 2.39
ACPD
4, 6667–6689, 2004Arctic ozone depletion 2002/2003
T. Christensen et al.
Title Page
Abstract Introduction
Conclusions References
Tables Figures
◭ ◮
◭ ◮
Back Close
Full Screen / Esc
Print Version
Interactive Discussion
©EGU 2004
Table 3. Vortex-averaged ozone depletion from 10 December 2002 to 10 March 2003. The depletion rates in units of ppbv/day are derived from the best linear fits displayed in Fig.5. The quoted uncertainty is the one sigma standard deviation.
θ Vortex collar Vortex middle Vortex centre
K ppbv/day ppbv/day ppbv/day
ACPD
4, 6667–6689, 2004Arctic ozone depletion 2002/2003
T. Christensen et al.
Title Page
Abstract Introduction
Conclusions References
Tables Figures
◭ ◮
◭ ◮
Back Close
Full Screen / Esc
Print Version
Interactive Discussion
©EGU 2004
Table 4.Vortex-averaged column ozone depletion in Dobson units from 10 December 2002 to 10 March 2003.
Whole vortex Vortex collar Vortex middle Vortex centre
ACPD
4, 6667–6689, 2004Arctic ozone depletion 2002/2003
T. Christensen et al.
Title Page
Abstract Introduction
Conclusions References
Tables Figures
◭ ◮
◭ ◮
Back Close
Full Screen / Esc
Print Version
Interactive Discussion
©EGU 2004
Table 5. Accumulated ozone loss from 10 December 2002 to 10 March 2003 from the Match technique and recalculated with new parameters for the average method. The vortex-averaged column loss is calculated between 380 and 525 K, while the Match column loss is calculated, using the six levels mentioned in the text, from 380 to 500 K (for both methods the integration limits areθlevels of 30 March 2003).
θ(10 March) Match ozone loss Vortex average ozone loss 479 K 1647±358 ppbv 1000±200 ppbv 433 K 1374±219 ppbv 1250±97 ppbv 409 K 1239±205 ppbv 1020±104 ppbv 389 K 745±249 ppbv 1006±140 ppbv
ACPD
4, 6667–6689, 2004Arctic ozone depletion 2002/2003
T. Christensen et al.
Title Page
Abstract Introduction
Conclusions References
Tables Figures
◭ ◮
◭ ◮
Back Close
Full Screen / Esc
Print Version
Interactive Discussion
©EGU 2004
0
15
30
45
60
mpv
20030119
Theta = 475 K
Fig. 1.Modified potential vorticity MPV north of 50◦N in units of PVU atθ
ACPD
4, 6667–6689, 2004Arctic ozone depletion 2002/2003
T. Christensen et al.
Title Page
Abstract Introduction
Conclusions References
Tables Figures
◭ ◮
◭ ◮
Back Close
Full Screen / Esc
Print Version
Interactive Discussion
©EGU 2004
ACPD
4, 6667–6689, 2004Arctic ozone depletion 2002/2003
T. Christensen et al.
Title Page
Abstract Introduction
Conclusions References
Tables Figures
◭ ◮
◭ ◮
Back Close
Full Screen / Esc
Print Version
Interactive Discussion
©EGU 2004 10 DEC 20 DEC 30 DEC 9 JAN 19 JAN 29 JAN 8 FEB 18 FEB 28 FEB 10 MAR
400
500
600
Potential temperature [K]
675 K
600 K
525 K
475 K
435 K
400 K 380 K 350 K
ACPD
4, 6667–6689, 2004Arctic ozone depletion 2002/2003
T. Christensen et al.
Title Page
Abstract Introduction
Conclusions References
Tables Figures
◭ ◮
◭ ◮
Back Close
Full Screen / Esc
Print Version
Interactive Discussion
©EGU 2004
0
15
30
45
60
mpv
20030218
Theta = 475 K
ACPD
4, 6667–6689, 2004Arctic ozone depletion 2002/2003
T. Christensen et al.
Title Page
Abstract Introduction
Conclusions References
Tables Figures
◭ ◮
◭ ◮
Back Close
Full Screen / Esc
Print Version
Interactive Discussion
©EGU 2004 3.0
3.5 4.0
525 K
2.5 3.0 3.5
475 K
2.0 2.5 3.0
435 K
1.5 2.0 2.5
Ozone mixing ratio [ppmv]
400 K
1.5 2.0 2.5
380 K
10 DEC 20 DEC 30 DEC 9 JAN 19 JAN 29 JAN 8 FEB 18 FEB 28 FEB 10 MAR 0.5
1.0 1.5
350 K