www.atmos-meas-tech.net/7/2373/2014/ doi:10.5194/amt-7-2373-2014
© Author(s) 2014. CC Attribution 3.0 License.
Determination and analysis of in situ spectral aerosol optical
properties by a multi-instrumental approach
S. Segura1, V. Estellés1, G. Titos2, H. Lyamani2, M. P. Utrillas1, P. Zotter3, A. S. H. Prévôt3, G. Moˇcnik4,
L. Alados-Arboledas2, and J. A. Martínez-Lozano1
1Departament de Física de la Terra i Termodinàmica, Universitat de València, Burjassot (Valencia), Spain 2Andalusian Institute for Earth System Research, IISTA-CEAMA, University of Granada, Junta de Andalucía,
Granada, 18006, Spain
3Laboratory Atmospheric Chemistry (LAC), Paul Scherrer Institute, Villigen, Switzerland 4Aerosol d. o. o., Research and Development Department, Ljubljana, Slovenia
Correspondence to:S. Segura ([email protected])
Received: 19 December 2013 – Published in Atmos. Meas. Tech. Discuss.: 26 February 2014 Revised: 21 May 2014 – Accepted: 27 June 2014 – Published: 6 August 2014
Abstract.Continuous in situ measurements of aerosol opti-cal properties were conducted from 29 June to 29 July 2012 in Granada (Spain) with a seven-wavelength Aethalometer, a Multi-Angle Absorption Photometer, and a three-wavelength integrating nephelometer. The aim of this work is to describe a methodology to obtain the absorption coefficients (babs)
for the different Aethalometer wavelengths. In this way, data have been compensated using algorithms which best estimate the compensation factors needed. Two empirical factors are used to infer the absorption coefficients from the Aethalome-ter measurements:C– the parameter describing the enhance-ment of absorption by particles in the filter matrix due to multiple scattering of light in the filter matrix – andf, the parameter compensating for non-linear loading effects in the filter matrix. Spectral dependence off found in this study is not very strong. Values for the campaign lie in the range from 1.15 at 370 nm to 1.11 at 950 nm. Wavelength dependence in C proves to be more important, and also more difficult to calculate. The values obtained span from 3.42 at 370 nm to 4.59 at 950 nm. Furthermore, the temporal evolution of the Ångström exponent of absorption (αabs) and the
single-scattering albedo (ω0)is presented. On averageαabsis around 1.1±0.3, andω0is 0.78±0.08 and 0.74±0.09 at 370 and 950 nm, respectively. These are typical values for sites with a predominance of absorbing particles, and the urban measure-ment site in this study is such. Thebabsaverage values are of
16±10 Mm−1(at 370 nm) and 5±3 Mm−1(at 950 nm), re-spectively. Finally, differences between workdays and
Sun-days have been further analysed, obtaining higherbabs and
lowerω0during the workdays than on Sundays as a
conse-quence of the diesel traffic influence.
1 Introduction
The radiative forcing in the Earth’s atmosphere caused by aerosols is highly uncertain (IPCC, 2013). The direct effect of aerosol influence is exhibited by scattering and/or absorb-ing solar radiation. By scatterabsorb-ing the light they contribute to the cooling of the underlying atmosphere and the surface (negative radiative forcing). Furthermore, by absorbing light they contribute to the heating of the atmosphere (positive ra-diative forcing). The latter is an important component of the radiation budget of the atmosphere which still needs to be better characterized to reduce uncertainties in climate models (Houghton et al., 2001; Ramanathan et al., 2001; Kirchstetter et al., 2004).
1986) – exhibit a stronger wavelength dependence. There-fore, the spectral dependence of aerosol absorption coeffi-cient is important to distinguish different aerosol-absorbing components (Collaud-Coen et. al, 2004; Fialho et al., 2005; Sandradewi et al., 2008a).
Different methods and instruments are used to measure light absorption (Hansen et al., 1984; Horvath, 1993; Bond and Bergstrom, 2006; Moosmüller et al., 2009; Müller et al., 2011). The most widely used method for in situ measure-ments is the filter-based technique, which relies on determin-ing the absorption coefficient by measurdetermin-ing the change of light attenuation due by aerosol collected on a filter matrix (Hansen et al., 1982). Instruments currently used for deter-mining the aerosol absorption coefficient using filter-based techniques are the Aethalometer (Hansen et al., 1984), the Particle Soot Absorption Photometer (PSAP) (Bond et al., 1999) and the Multi-Angle Absorption Photometer (MAAP) (Petzold and Schönlinner, 2004).
It is known that all filter-based instruments suffer from several artefacts (Schmid et al., 2006; Müller et al., 2011; Collaud-Coen et al., 2010). Therefore, it is necessary to ap-ply compensation to the data to determine the absorption co-efficient. Several studies have proposed different numerical methods to compensate these artefacts (Bond et al., 1999; Weingartner et al., 2003; Arnott et al., 2005; Schmid et al., 2006), and have proven to give quite satisfactory results when compared to other non-filter-based instruments.
From the instruments mentioned above, the MAAP is one of the newer filter-based instrument for measuring the aerosol absorption coefficient (Petzold and Schönlinner, 2004; Petzold et al., 2005). Measurements provided by the MAAP are only available for one wavelength, which is a dis-advantage since it is important to determine both babs and
its spectral dependence. This information can be obtained by combining the MAAP measurements with those performed by a multi-wavelength Aethalometer AE-31, which performs measurements at seven different channels covering the range from the ultraviolet (UV, 370 nm) to near infrared (NIR, 950 nm).
The aim of this work is to obtain the spectral variation of the compensation factors of the Aethalometer data and then apply them to the measurements performed at the different channels of the Aethalometer. In this way, the aerosol ab-sorption coefficients at all the different Aethalometer chan-nels are calculated, and then other optical parameters, such as the spectral single-scattering albedo (ω0)or the Ångström exponent of absorption (αabs), are determined and analysed.
The data set presented in this study was measured during one month, from 29 June 2012 to 29 July 2012, in Granada (Spain) using a MAAP, an Aethalometer, and a nephelome-ter. In this work we will discuss the methodology used for compensating the Aethalometer and MAAP data. Finally, the temporal evolution of the results obtained is presented and compared with results in other works to evaluate the reliability of the data.
2 Site description and instrumentation 2.1 Measurement site
Measurements presented in this study were performed in Granada, from 29 June to 29 July 2012. Granada (37.18◦N, 3.58◦W, 680 m a.s.l.) is a non-industrialized
medium-size city located in southeastern Spain with a popu-lation of around 500 000 inhabitants, considering the whole metropolitan area (http://www.juntadeandalucia.es/). Near-continental conditions prevail at this site and are responsible for large temperature differences, providing cool winters and hot summers (Lyamani et al., 2010).
The measurement station is located in the southern part of the city, less than 500 m away from a highway that surrounds the city. Local aerosol sources are mainly road traffic (domi-nated by diesel engines) together with soil re-suspension, es-pecially during the warm-dry season when the reduced rain-fall may increase the contribution of local mineral dust. Due to its location in the Mediterranean basin, it is influenced by two major aerosol source regions: Europe, as a source of an-thropogenic pollutants, and northern Africa, as a source of natural mineral dust (Lyamani et al., 2010).
2.2 Instrumentation
Sampling for all the different instruments was obtained us-ing a stainless steel tube 20 cm in diameter 5 m in length (Lyamany et al., 2008). The inlet was located about 15 m above the ground. Measurements were carried out without an aerosol size cut-off or heating of the sampled air. From the tube, several stainless steel pipes led the sampled air to each instrument at the appropriate flows. Different diameters were adjusted to maintain the laminar flow in the tubes and minimize particle losses (Baron and Willeke, 2005).
The aerosol light absorption coefficient was measured using two different filter-based instruments. The MAAP (Thermo Scientific) measures the light transmitted through and backscattered from a particle-loaded filter. Thebabs at
637 nm (Müller et al., 2011) is calculated using radiative transfer model which includes a treatment of the scatter-ing effects of the filter matrix and the light scattered by the aerosol component. A detailed description of the method is provided by Petzold and Schönlinner (2004). The MAAP works at a constant flow rate of 16.7 L min−1and provides
measurements every minute. The total method uncertainty for the aerosol light absorption coefficient inferred from MAAP measurement is around 12 % (Petzold and Schönlin-ner, 2004; Petzold et al., 2005).
The MAAP was believed to be the instrument which is the least affected by artefacts for obtaining the aerosol absorp-tion coefficient among all the different filter-based methods. Different studies have shown thatbabsmeasured by MAAP
However, a recent study by Hyvärinen et al. (2013) showed that MAAP measurements suffer from some artefacts in lo-cations with high concentrations of light-absorbing parti-cles. Therefore, to avoid these artefacts, MAAP data have been compensated using the method described in Hyvärinen et al. (2013). A more detailed explanation can be found in Sect. 3.1.
The other instrument used to measure the babs is the
Aethalometer model 31-ER (Magee Scientific). The AE-31 measures light attenuation at seven different wavelengths (λ) covering the UV (370 nm), visible (470, 520, 590, and 660 nm), and NIR (880 and 950 nm) ranges. A complete de-scription of the operating principles of Aethalometers can be found in Hansen (2005).
The Aethalometer measures the light attenuation through a quartz filter matrix as aerosols are deposited on the filter. This parameter is defined by
ATN(λ)= −ln I (λ)
I0(λ)
, (1)
where I is the intensity of light that passes though the particle-loaded part of the filter, andI0is the intensity of light
passing through the unloaded part of the filter. The attenua-tion coefficient (bATN)at each wavelength can be obtained by
bATN(λ)=A V
1ATN(λ)
1t , (2)
whereAis the filter spot area (1.67 cm2),V the flow rate, and1ATN is the variation in the attenuation measured dur-ing the time interval1t. The attenuation coefficient is deter-mined from the change of attenuation and is therefore due entirely to the loading of the filter by aerosols. In this work the instrument was operated with a flow rate of 4 L min−1and
a sampling interval of 5 min. The compensation algorithm to obtainbabsfrombATNis described in more detail in Sect. 3.2.
Aerosol scattering (bscat)and backscattering (bbsp) coef-ficients at ground level were measured using a TSI Model 3563 three-wavelength (450, 550, 700 nm) integrating neph-elometer (Anderson et al., 1996; Heintzenberg et al., 2006). This instrument draws the ambient air through a temperature-monitored inlet at a flow rate of 30 L min−1, illuminates the
sample with a halogen lamp, and measures the scattered light using three photomultiplier tubes. The scattered light is inte-grated over an angular range which can be adjusted to ei-ther 7–170◦or 90–170◦, using a backscatter shutter to give
total scatter and backscatter signals. Pressure and tempera-ture are measured in the sample chamber, so scattering by air molecules can be calculated and then subtracted from the total scattering to determine scattering by aerosol particles. In our case, although no drying of the aerosol stream was performed, the relative humidity measured within the neph-elometer chamber was low with a mean value of 28±10 %. Thus, we can consider that the hygroscopic growth does not
affect our measurements. In this study, non-idealities due to truncation errors were corrected (Anderson and Ogren, 1998). Uncertainties in the nephelometer measurements con-sist of angular truncation errors, non-Lambertian nature of the light source, and wavelength non-idealities. The calibra-tion uncertainty is approximately 7 % (Anderson et al., 1996; Anderson and Ogren, 1998; Esteve et al., 2012).
3 Data compensation and methods
All filter absorption photometers are affected by loading ef-fects which need to be compensated, and the various com-pensation methods relied mostly on the continuity of data (Weingartner et al., 2003; Virkkula et al., 2007; Hyvärinen et al., 2013) to derive the compensation parameters. Here we propose a more robust method to determine the quality of the compensation for loading effects: the slope of the absorp-tion coefficient vs. the loading of the spot. This method was used to compensate the BC measurements (Park et al., 2010), but here we use it as an independent criterion to evaluate the compensation. This criterion does not use any assumptions or external data, only the measurements from a single instru-ment – it checks the measured parameters for internal con-sistency. For a long period of homogeneous measurements in terms of the sources and meteorology, the absorption co-efficient should not depend on the loading of the spot. The uncompensated measurements of BC in filter photometers are proportional to the time derivative of the attenuation of detected light intensity (MAAP: in reflection; Aethalometer: in transmission), not on the absolute attenuation values. Any dependence of the measured absorption on the loading (at-tenuation) is evidence of a bias due to the loading of the spot. The parameter, which was shown to be most representative of these effects, is the slope of the attenuation or absorption co-efficient or as a function of the loading (following the logic in Park et al., 2010). We will demonstrate the usefulness of this method as an independent criterion of the compensation for both absorption photometers used in the study – the MAAP and the Aethalometer AE-31 – by plotting the average value of the attenuation or absorption coefficient as a function of the loading of the spot with BC.
3.1 MAAP compensation
Hyvärinen et al. (2013) observed that at high BC concen-trations the MAAP measurements are also affected by arte-facts which are different to those seen in other filter-based instruments, such as the PSAP or the Aethalometer. Two so-lutions were proposed to avoid or compensate for this prob-lem: either applying a compensation algorithm to the batn
Figure 1.Non-compensated absorption coefficient (batn,MAAP)vs. compensated absorption coefficient obtained from the reflected sig-nal (babs,MAAP), showing the relationship between thebatn,MAAP given by the MAAP, as explained in Sect. 2.2, and the compensated babs,MAAPobtained with the reflected signal at 165◦.
albeit exhibiting more scatter and not completely eliminating the artefact jump at the tape advance (Hyvärinen et al., 2013). In this work, the MAAP was set to give the photodetector raw signals as an output, so the reflected signal at 165◦was
chosen to obtain the absorption coefficient at 637 nm. The at-tenuation coefficient given by the MAAP (batn,MAAP)can be
determined from the reflected signals by using the following equation (Petzold et al., 2005):
batn,MAAP=0.5
A V ln
R
0 R
, (3)
where, in our case, (R0/R) is the ratio of the photodetector signal at 165◦for a particle-free to a particle-loaded filter,A
is the filter spot area (2 cm2), andV is the sampled volume.
The multiplication factor of 0.5 in Eq. (3) has to be applied because the light passes through the layer of sampled aerosol twice before reaching the photodetector.
The value obtained from Eq. (3) does not correspond to the absorption coefficient since there is a filter-loading effect which influences the measured signals. Petzold et al. (2005) determined an empirical method to compensate this arte-fact using test aerosols. These test aerosols consisted of pure black aerosol samples from kerosene flame particles, and ex-ternally mixed grey and black aerosols of varying single-scattering albedo. The obtained relation for the aerosol ab-sorption coefficient for these aerosols using the reflected sig-nal is
babs,MAAP=batn,MAAP
0.226+1.415R R0.
−1
(4)
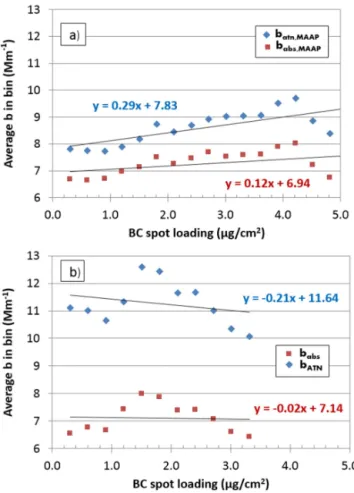
Figure 2.Average attenuation and absorption coefficient vs. loading of the spot:(a)the non-compensated MAAP attenuation coefficient batn,MAAPand the compensated (Eq. 4) MAAP absorption coeffi-cientbabs,MAAP, and(b)the Aethalometer attenuation coefficient
bATNand the compensated (Eq. 7) Aethalometer absorption coeffi-cientbabs.
Similar to Hyvärinen et al. (2013), values automatically pro-vided by the MAAP are lower than those calculated from raw reflected signal for high absorption coefficients (babs,MAAP)
(Fig. 1). We do not observe any systematic saturation in the measurements as found previously (Kanaya et al., 2008) or large discontinuities in the data at the tape advance (Brito et al., 2013). This indicates that the use of the reflection signals rather than the default values compensated the data successfully. To check the compensation, we plot (Fig. 2a) the average value of the MAAP attenuation and absorption coefficient in a spot-loading bin (with width 0.3 µg cm−2)
as a function of the loading of the spot with BC between a clean filter (no loading) and the BC value with enough data in the campaign to gather enough statistics (just above 5 µg cm−2). The slope of the compensated MAAP
coefficient (6.94 Mm−1; Fig. 2b) characteristic for the
cam-paign. We propose to use the difference between the intercept 6.94 Mm−1(that is, the compensated absorption coefficient,
representative for the campaign) and the campaign average absorption coefficient 7.25 Mm−1 as an additional internal
criterion for the “efficiency of compensation” with an empir-ical limit of 5 %. The compensation of the MAAP data using the reflection measurements, rather than the raw MAAP data, satisfies this criterion, and we use the compensated MAAP absorption coefficient for comparison with the Aethalometer attenuation and absorption coefficients.
3.2 Aethalometer
3.2.1 Data pre-processing
The Aethalometer raw data were first screened with three criteria: data showing excessive noise, and the upper and lower limits of the Aethalometer detection. High noise in the measurements degrades the determination of the absorption spectral dependence. This wavelength dependence can be ap-proximated by a power-law expression (Ångström, 1929). A measurement is considered too noisy if the curve cannot fit a spectrum satisfactorily (Rizzo et al., 2011); therefore, only fits withR2 higher than 0.85 have been chosen to re-duce noise. The same data treatment was applied to the neph-elometer data as well.
The second criterion is related to the lower detection limit of the instrument, as the measured attenuation should be above it. According to the Aethalometer manual, this limit corresponds to a mass increase of 5 ng and can be expressed in units of thebabs(Mm−1)by the following expression: min(babs)=m·σATN(λ)
1t·V , (5)
where m=5 ng, σATN(λ) is the mass-specific attenuation cross section in m2g−1,1t is the time-based period (set to
5 min in our case), and V is the sampling flow in L min−1
(4 L min−1in our instrument). The attenuation cross section
is calculated using the following equation:
σATN=14625
λ[nm]. (6)
This equation is based on a calibration at 880 nm using the Malissa–Novakov method, a solvent-based thermal desorp-tion method for elemental carbon analysis (Gundel et al., 1984).
Also, as a consequence of random voltage fluctuations and from recording discontinuities which take place during the Aethalometer’s tape advance, a third criterion related to the upper detection limit is applied (De Castro et al., 2008). To identify these low-quality data, the 99th percentile of the at-tenuation coefficient (i.e. 162.2 Mm−1at 660 nm) was
cho-sen as the extreme upper limit.
From the whole data set, 4 % of the data did not satisfy any of these three criteria, leaving a total number of 8276 measurements.
3.2.2 Data compensation
Aethalometer artefacts, unlike MAAP artefacts, are well known and five different algorithms have been proposed to compensate them (Weingartner et al., 2003; Arnott et al., 2005; Schmid et al., 2006; Virkkula et al., 2007; Collaud-Coen et al., 2010). The light beam crossing the filter suf-fers (1) multi-scattering effects due to the filter fibres; (2) single-scattering effects, due to the aerosol particles de-posited in the filter; and (3) filter-loading effects, which are related to the shadowing produced as the particles accumu-late on the filter. The result of these optical interactions is thatbATN is generally larger thanbabs(Petzold et al., 1997;
Ballach et al., 2001).
Due to the aforementioned aerosol–filter interactions, the Aethalometer requires specific site compensation factors. In this sense, we have calculated these compensation factors for our site and used them to compensate the Aethalometer data by applying the algorithms proposed by Weingartner et al. (2003) and Schmid et al. (2006). The reason to select these two algorithms, out of the five existing ones, is that Wein-gartner et al. (2003) and Schmid et al. (2006) found a way to obtain the spectral dependence of the multiple-scattering compensation factor from aerosol single-scattering albedo. Knowing this spectral dependence will allow us to convert bATN to babs for all seven Aethalometer wavelengths. The
most important difference between these two algorithms lies in the fact that Weingartner’s algorithm does not consider the artefact produced by the single-scattering effect, while Schmid’s does.
In their test with ammonium sulfate, Weingartner et al. (2003) found no significant dependence ofbATN on the
scattering component of the aerosol in the filter. Therefore, they proposed an algorithm to obtainbabswithout taking into
account the single-scattering effect of the aerosols: babs= bATN
C·R (f,ATN), (7)
whereCis the parameter describing the enhancement of ab-sorption particles in the filter matrix and compensates for the multiple-scattering effects exhibiting values ≥1 and R(f, ATN) for the loading effect with values ≤1. The loading compensation depends on the amount of the sample collected on the filter and is hence dependent on the attenuation mea-sured by the Aethalometer. The parameter can be expressed as proposed in Weingartner et al. (2003):
R (f,ATN)= 1
f −1
lnATN−ln10%
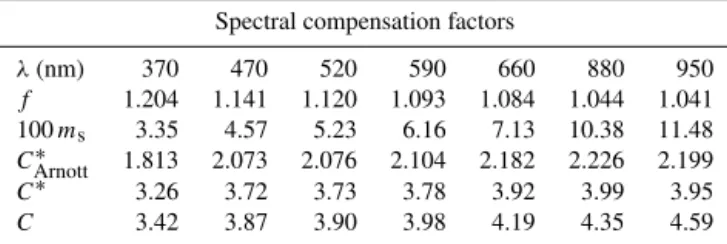
Table 1.Compensation factors obtained for the seven Aethalometer wavelengths:f corresponds to the “shadowing effect” in the load-ing compensation; 100msis the value given in Arnott et al. (2005) to the scattering fraction of particles;CArnott∗ is the value given in Arnott et al. (2005) to the multiple-scattering compensation factor (C∗ in Schmid et al., 2006, and in this work);C∗ andC are the values specifically site-calculated in this work.
Spectral compensation factors
λ(nm) 370 470 520 590 660 880 950
f 1.204 1.141 1.120 1.093 1.084 1.044 1.041 100ms 3.35 4.57 5.23 6.16 7.13 10.38 11.48
CArnott∗ 1.813 2.073 2.076 2.104 2.182 2.226 2.199 C∗ 3.26 3.72 3.73 3.78 3.92 3.99 3.95 C 3.42 3.87 3.90 3.98 4.19 4.35 4.59
after the filter spot change. The calculated medianf values were plotted as a function ofλand fitted with a linear equa-tion (Sandradewi et al., 2008b). Values obtained for this pa-rameter are shown in Table 1.
The effect of the compensation of the Aethalometer mea-surements is shown in Fig. 2b. The slope reduces signif-icantly to a value which is non-distinguishable from 0 – the compensation is efficient in eliminating the loading ef-fects. The difference between the intercept 7.14 Mm−1 (the
compensated absorption coefficient, representative for the campaign) and the campaign average absorption coefficient 7.10 Mm−1 satisfies the empirical 5 % criterion.
Addition-ally, the value lies extremely close to the average and the intercept determined from the analysis of the MAAP com-pensation (Sect. 3.1).
Since the loading effect is small for lightly loaded filters (Weingartner et al., 2003),C can be determined by compar-ing low loaded Aethalometer measurements (ATN<10 %) with the ones obtained by a different comparison instrument. In this study we compared the Aethalometer-derived absorp-tion coefficient with babs,MAAP from the MAAP, and C is determined using the equation proposed in Weingartner et al. (2003) as
C=bATN(ATN<10) babs,MAAP
. (9)
C has been calculated at 637 nm, as the MAAP measure-ments are performed at this wavelength. Since the nearest wavelengths in the Aethalometer are 590 and 660 nm,bATN
(637 nm) has been calculated by approximating the wave-length dependence of the attenuation spectra for each mea-surement to a power-law expression, such as
bATN(λ)=a·λ−αatn, (10)
whereais a fitting parameter andαatnis the Ångström
expo-nent of attenuation.
After taking logarithm of Eq. (10), a “linear fit” was ap-plied to the log–log curve:
ln[bATN(λ)]=lna−αatnln(λ) . (11)
To calculate C,bATN at 637 nm for the Aethalometer data has to be calculated sincebabs,MAAPin Eq. (9) is related to
637 nm. The averageC value at the wavelength of 637 nm (C637) was determined to be C637=4.22±0.06 from the arithmetic mean (95 % confidence level of the mean) of the ratios ofbATN (637) and babs,MAAP (Schmid et al., 2006).
Collaud-Coen et al. (2010) obtained differentCvalues rang-ing between 2.8 and 7.8 at several sites. In particular, from the different sites chosen in that paper, our value is close to those obtained (C=4.12±0.06 at 660 nm,C660)at Cabauw (the Netherlands), a background site located near populated and industrialized areas (Collaud-Coen et al., 2010).
Some publications (Lack et al., 2009; Nakayama et al., 2010) indicate that the multiple-scattering compensation fac-tor might depend on the particle size, as the aerosol penetra-tion depth into the filter varies depending on the size. Since this effect is still difficult to quantify (Rizzo et al., 2011), it is not straightforward to conclude if there will be an overesti-mation or underestioveresti-mation in our absorption coefficients due to this effect. A significant part of the aerosol loading on the filter tape on the measurement site is always diesel exhaust particles, so at least this part of the loading is extremely ho-mogeneous. Therefore, we did not consider this effect further in this manuscript.
3.2.3 Spectral dependence ofCand Aethalometer
absorption coefficients
Schmid et al. (2006) parameterized (based on Arnott et al., 2005) the spectral dependence ofCusing the following ex-pression:
C (λ)=C∗(λ)+ms(λ) ω0(λ)
1−ω0(λ), (12)
where C∗ is the multiple-scattering compensation factor, which includes the effects of aerosol scattering; ms is the
fraction of the aerosol scattering coefficient erroneously in-terpreted as absorption; ω0 is the aerosol single-scattering
albedo; andλ is the wavelength. BothC∗(λ) andms were
calculated for ammonium sulfate particles by Arnott et al. (2005). They however showed that these values gave un-satisfactory results when used to correct ambient measure-ments.
Equation (12) has been used to obtainC∗ at 637 (C637∗ ) usingC637 calculated in the previous section with Eq. (9).
Once it is calculated, C∗ values for the other wavelengths will be obtained assuming the same wavelength dependence as in Arnott et al. (2005). Values ofmsused here were taken
from Arnott et al. (2005) since with our data it is not pos-sible to determine them.ω0(637) was calculated using the
following expression (Schmid et al., 2006): ω0(637)= bscat(637)
bscat(637)+babs,MAAP(637)
, (13)
where babs,MAAP (637) is the MAAP absorption
coefficient from the nephelometer, interpolated to 637 nm by using Eqs. (10) and (11) forbscat(λ).
To obtain the different C values for the remaining Aethalometer wavelengths, ω0(λ), C∗(λ), and ms(λ), are required (Eq. 12). Equation (13) is not useful in this case since MAAP absorption is only obtained at one wavelength and cannot be applied for the other Aethalometer channels. Therefore, for calculatingω0(λ)we used the following ex-pression (Schmid et al., 2006):
ω0(λ)=
ω0,ref
λ λref
−αscat
ω0,ref
λ λref
−αscat
+ 1−ω0,ref
λ λref
−αabs, (14) whereω0,refis the reference single-scattering albedo
calcu-lated at 637 nm (λref)using Eq. (13),αscatis the Ångström
exponent of scattering, and αabs is the Ångström exponent
of absorption.αscatdepends on thebscatmeasured at
differ-ent wavelengths and can be obtained from the nephelome-ter measurements (450–700 nm). However,αabsis calculated
from the babs measured by the Aethalometer at different
wavelengths.
Schmid et al. (2006) used fixed values forαscatcalculated
using wavelengths 450–700 (αscat,450−700)andω0(545)
mea-surements given by Chand et al. (2006) for Amazonia, and a range of differentαabsbased on Kirchstetter et al. (2004) to
obtain a parameterization function of C(λ)andαabs. Then
they applied an iterative procedure over this function to obtain C(λ) and αabs. The fixed values used were αscat= 2.0±0.4 and ω0(532)=0.92±0.02, which differ from our values in Granada during July 2012,αscat,450−700=1.3±0.3
and ω0(637)=0.76±0.08, consistent with the prevalence of diesel traffic on the highway near the measurement site. These differences between both sites are significant and make the parameterization function ofC(λ)given by Schmid et al. (2006) not applicable to our measurements. Therefore, based on their work, the iterative procedure has been used to calculate αabs and, then,C(λ)andbabs(λ), following these steps:
1. The Ångström exponent of attenuation (αatn)is calcu-lated by fitting the logarithm of the spectral attenuation coefficients with a linear fit as presented in Eq. (11). 2. Theαatnis used in Eq. (14) as a first estimation ofαabs,
to obtain ω0(λ), and then the compensation factor C for each Aethalometer wavelength is calculated using Eq. (12).
3. The compensation factorC(λ)at different wavelengths is used in Eq. (7) to obtain the new compensated absorp-tion coefficients (babs).
4. This newbabs(λ)is used again in step 1 to get a better estimation forαabs.
5. Repeat steps 2–4 untilαabs converges with a precision
of 0.005.
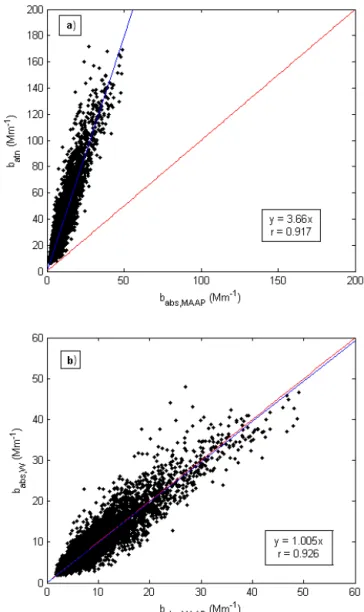
Figure 3. Comparison of the Aethalometer vs. MAAP absorp-tion coefficient (babs,MAAP) at 637 nm for (a)non-compensated
Aethalometer data (bATN) and (b) Weingartner’s compensation (babs,W).
4 Results of the compensations
4.1 Non-compensated/compensated Aethalometer vs. MAAP data
In Fig. 3a, non-compensated Aethalometer data (bATN) at 637 nm obtained using Eq. (11) are compared tobabs,MAAP
values. The Aethalometer and the MAAP are well correlated, withR=0.917, while the slope of 3.66 shows the relation-ship between the Aethalometer attenuation coefficient and the MAAP absorption.
Table 2.Statistics of MAAP and Aethalometer compensated and non-compensated absorption coefficients at 637 nm: mean standard error, standard deviation, median, maximum, minimum, 25th percentile, and 95th percentile. MAAP corresponds tobabs,MAAPstatistics;bATN
corresponds to non-corrected Aethalometer data;babs,Wcorresponds to data compensated as proposed by Weingartner et al. (2003); and babs,Arnottrepresents data compensated with the algorithm and compensation factors (Mandα) from Arnott et al. (2005).
b637(Mm−1) Mean±SE SD Median Minimum Maximum P25 P95
babs,MAAP 9.15±0.07 5.8 7.7 1.76 49.0 5.3 20.2
bATN 34.0±0.2 21.5 28.7 6.37 171.5 19.7 76.0
babs,W 9.35±0.07 6.1 7.8 1.87 48.0 5.3 21.3 babs,Arnott 17.84±0.13 11.6 14.8 3.56 91.5 10.1 40.6
highlight that it has been obtained using Weingartner’s com-pensation. The slope betweenbabs,Wandbabs,MAAPchanges
to 1.005 and there appears a slight increase of the correlation coefficient: from 0.917 to 0.926 (Fig. 3b). The compensation factors used (C637=4.22±0.06 and f637≈f660=1.131) were already obtained in Sect. 3.2.2. Dispersion of some points is due to some noise in the data which has not been removed by the filtration algorithm described above in Sect. 3.2.1.We can further reduce this dispersion by averag-ing the data over a more extended period of time. Further-more, the compensated babs,W values are on average 73 %
lower than corresponding non-compensatedbATNvalues and
differ frombabs,MAAPon average by around 2 %.
The statistics of the comparison between the two data sets are shown in Table 2. Average values of babs,MAAP
andbabs,W with their standard deviations are 9.2±5.8 and
9.4±6.1 Mm−1, respectively. The 25th and 95th percentile for both data sets are very similar, indicating a similar dis-tribution of the data. The statistical analysis shows a good agreement between babs,MAAP and babs,W. Therefore it is
concluded that Weingartner’s compensation, with our site-specific compensation parameters, compensates satisfacto-rily the AethalometerbATNto obtain absorption coefficients
which agree well with those measured by the MAAP. 4.2 Compensation parameters at different wavelengths
and final compensation
The spectral dependence ofCcan be obtained using Eq. (12). To start, C∗ and ms as proposed in Arnott et al. (2005)
for 660 nm were used (see Table 2). The C660 value of
2.21 was obtained, which is only ∼50 % of the value ob-tained at 637 nm (see previous Sect. 3.2.2). Applying this compensation factor leads to unsatisfactory comparison with babs,MAAP, since the new compensated data (babs,Arnott)
over-estimate the MAAP data (slope of 1.92). The statistics of the comparison of these two data sets are shown in Table 2 as babs,Arnott. These results corroborate that theC∗andms
pa-rameter values from Arnott et al. (2005) are not applicable for this campaign. To get a better estimation of the spec-tral dependence onC, specific ambient measurements were calculated to obtainC∗(λ). As we only have availableC637
for the direct comparison of the two absorption
photome-ters,C637∗ can be calculated by using Eq. (12) and assuming ms(637)≈ms(660)=0.0713 (Table 1). The value obtained is 3.93, which differs from the value obtained by Arnott et al. (2005) in the laboratory (CArnott∗ of 2.182 at 660 nm), as can be seen in Table 1. On the other hand, this value is con-sistent with their proposal of C∗ (521)=3.69 for ambient measurements. Following this,C∗(λ) values at other wave-lengths have been calculated assuming the same spectral de-pendence ofCArnott∗ (λ)given by Arnott et al. (2005) and nor-malized toC∗Arnott(660). As can be seen from Table 1, the ob-tainedC∗(λ)are much higher than those estimated by Arnott et al. (2005) or by Weingartner et al. (2003) in the laboratory. Once we had retrieved the C∗(λ) values, the iterative method explained in Sect. 3.2.3 was applied for each mea-surement to calculate theC(λ), which will be used to com-pensatebATN(λ). Almost 93 % of the data converges at the fourth iteration, while the remaining 7 % does at the fifth iteration. The averaged values for C(λ) are shown in Ta-ble 1. It is evident that C increases withλ, from 3.42 in the UV (370 nm) channel to 4.59 in the infrared (950 nm). Comparing these values with our referenceC637, calculated
using Eq. (9), a higher wavelength dependence is observed at lower wavelengths (∼23 % forCat 370 nm) than at near-infrared wavelengths (∼4 % forC at 950 nm). Weingartner et al. (2003) assumed that there was no wavelength depen-dence onC since the difference in their measurements be-tween 450 and 660 nm was smaller than 10 %. This is con-sistent with our data since the difference inC between 470 and 660 nm is≈8 %, and the only wavelength differing more is 370 nm (see Table 1). Furthermore, the differences in our calculatedC values at each wavelength are similar to the ones reported in Schmid et al. (2006) forαabs≈1. In addi-tion, the averageαabsobtained with the iterative method was
found to be 1.09 with a standard deviation of around 0.25. We performed a sensitivity analysis on the effect of the com-pensation on theC values: a 15 % change of the parameter f causes a change in theC values smaller than 1 % for all wavelengths.
The obtainedbabs are, on average, around 72 and 79 %
lower than the correspondingbATN values measured at 370
Figure 4. Whisker boxplot of (a)the Aethalometer (black) and MAAP (red) compensated absorption coefficients (babs)and (b) single-scattering albedo (ω0)for the seven aethalometer channels. The square inside the boxes represents the average; the central line corresponds to the median; the edges of the box are the 25th and 75th percentiles; the whiskers correspond to 5th and 95th per-centiles; and horizontal lines outside the boxes correspond to max-ima and minmax-ima.
this study. Figure 4 shows a boxplot of the compensated ab-sorption coefficients babs at each wavelength obtained from the Aethalometer and the MAAP. On one hand, it can be seen that the MAAP absorption coefficient is in reasonable agreement with the boxes from the compensated Aethalome-ter data at 590 and 660 nm. This is expected when the data are properly compensated, since the spectral behaviour of the ab-sorption coefficient follows a power law as shown in Eq. (10). Rizzo et al. (2011) performed sensitivity tests and showed that the main source of error due tobabsandαabsis driven by
the choice ofαscat. Since they used averaged values over the
whole measurement period, their sensitivity tests consisted in varying these values and seeing how this affected the final re-sult forbabsandαabs. They obtained a maximum deviation in
the results of±10 and±40 % onbabsandαabs, respectively.
Following their tests, in our measurements, only±1 % for babs and±2 % forαabsdeviations are observed. This is due
to the fact that we have used concurrent absorption and scat-tering measurements at multiple wavelengths and have thus reduced deviations inbabsandαabssignificantly.
5 Spectral absorption coefficient, spectral single-scattering albedo, and Ångström exponent of absorption
5.1 Temporal evolution of aerosol spectral properties The statistics for ω0 obtained for the seven Aethalometer
channels were calculated (Fig. 4b). Averagedω0values from
370 to 950 nm lie between 0.78 and 0.74, with a standard deviation of 0.08–0.09. Lyamani et al. (2010) reported an av-erage value ofω0at 670 nm of 0.73±0.06 in summer, which is close to the value obtained in this work,ω0at 660 nm of
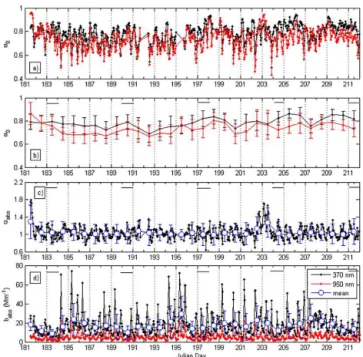
0.76±0.08. In general, theω0(λ)average values show that during the measurement period the atmosphere in Granada at surface level contained a large fraction of absorbing particles. Figure 5 shows the temporal evolution of hourly and daily averaged data for the different optical aerosol parameters calculated in the previous section during the period from 29 June to 29 July. Figure 5a and b display the hourly and daily average values ofω0(λ)obtained for the 370 and 950 nm channels of the Aethalometer. In Fig. 5a it can be observed that theω0minima of 0.5–0.6 correspond to
max-imum peaks of babs (Fig. 5d). These maxima in babs are a
consequence of traffic emissions; this suggests that lower val-ues ofω0are caused by traffic emissions which increase the
absorbing component at surface level (Lyamani et al., 2010, 2011). During the whole periodω0at 950 nm is higher than ω0at 370 nm, except for ordinal days 181 (29 June) and 202–
203 (20 and 21 July). A more detailed analysis of these days will be discussed below.
In the case of the αabs (Fig. 5c), except for the
men-tioned special episodes, values of this parameter show point-to-point variations no greater than 0.1. Hourly average val-ues of αabs are mostly between 0.9 and 1.2. The spectral
dependence ofbabs does not vary a lot, nor does the daily average ofαabs, which exhibits values around 1.1 for most
of the month. Values of αabs around 1 are related to the
Figure 5.Temporal evolution of:(a)ω0,370andω0,950hourly
av-eraged,(b)ω0,370andω0,950daily averaged,(c)αabshourly (black line) and daily averaged (blue dots), and(d)babs,370andbabs,950
hourly averaged and daily averaged values forbabs,370(blue dots) with their standard deviations. Black lines correspond to hourly av-erages at 370 nm and red lines to hourly avav-erages at 950 nm, except forαabsand panel(b), where they correspond to daily averages. All these data correspond to the period June–July 2012.
particles) affecting Granada during the measurement period, which will be described in more detail below.
Figure 5d shows the hourly average values of the babs at
370 and 950 nm. Both channels exhibit very similar tempo-ral behaviour, although absorption coefficients in the UV are considerably higher than those in the near infrared. The same evolution is seen forbabsat the other five channels, with
val-ues located between these two channels (not shown). Aver-aged values obtained for the compensatedbabsrange between
16 (at 370 nm) and 5 Mm−1(at 950 nm) with standard
devi-ations of 10 and 3 Mm−1, respectively (Fig. 4a).
For the two events already mentioned – ordinal days 181 (29 June) and 202–203 (20 and 21 July) – an extended analysis of surface level characteristics was made using back trajectories and results from the Navy Aerosol Anal-ysis and Prediction System (NAAPS, http://www.nrlmry. navy.mil/aerosol/). The model used for calculating back trajectories is the Hybrid Single-Particle Lagrangian Inte-grated Trajectory Model (HYSPLIT) developed by the Na-tional Oceanic and Atmosphere Administration (Draxler and Rolph, 2003). On the other hand, the NAAPS model is a global model that predicts concentrations of sulfates, dust and smoke aerosols at ground level and in the atmospheric column (Christensen, 1997). Measurements of a Raman li-dar operated at Granada station (Guerrero-Rascado et al.,
Figure 6.Five-day back trajectories from HYSPLIT at three differ-ent heights (500 (red), 1500 (blue), and 3000 m (green) a.g.l.) for (a)29 June and(b)20 July.
2008) and included in EARLINET (European Aerosol Re-search Lidar Network; Boesenberg et al., 2001) were used to support the interpretation of the data. Images of the tempo-ral evolution of the lidar range-corrected signal (RCS) can be consulted online at http://atmosfera.ugr.es/inv/index.php/en/ quicklooks.html.
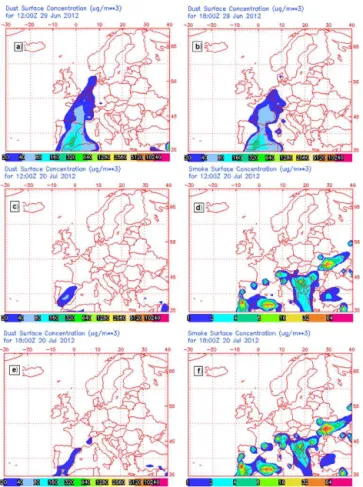
Figure 6 shows the five-day back trajectories arriving at Granada on 29 June and 20 July 2012. Figure 7 shows the concentration of different types of particles (dust, biomass smoke) at ground level predicted by the NAAPS model for 29 June and 20 July at 12:00 and 18:00 UTC. On 29 June, the trajectories arriving at 1500 and 3000 m a.g.l. came from the western Sahara, while the trajectory at 500 m a.g.l. came from the Mediterranean Sea between Spain and northern Africa (Fig. 6a). In addition, from Fig. 7a it can be seen that on 29 June NAAPS predicted a significant surface concen-tration of dust particles (80–160 µg m−3) at Granada.
Fur-thermore, no significant contributions from biomass burning and sulfate aerosols were obtained from the NAAPS model. Figure 8a shows the temporal evolution of the lidar RCS at 532 nm on 29 July. Early in the morning the presence of an aerosol layer decoupled from the planetary boundary layer is evident. The analysis of the backward trajectories suggests that the decoupled layer extending from 2000 to 3000 m a.s.l. originated in northern Africa. This is clear evidence of the Saharan dust outbreak over our station.
Figure 7.Total surface dust and biomass burning concentration pre-dicted by the NAAPS model for 29 June at(a)12:00 UTC and(b) 18:00 UTC,(c, d)20 July 12:00 UTC, and(e, f)20 July 18:00 UTC. Biomass burning concentration is only shown for 20 July since on 29 June there were no concentrations of this type over Granada.
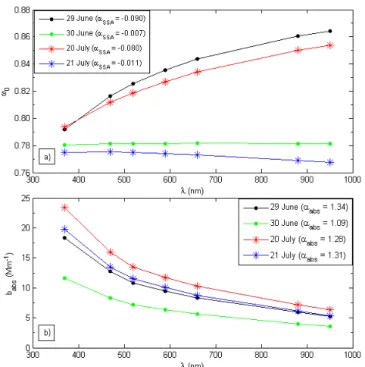
albedo (αSSA). Negative exponent values of theαSSAare due
to the large size of mineral aerosols. In our case, on 29 June aαSSA= −0.09 is obtained, which is related to the presence of dust in the atmosphere. On 30 June this wavelength de-pendence decreased to αSSA= −0.007, indicating that the mineral dust intrusion was over. In the case of the babs(λ) a stronger spectral dependence for the values obtained on 29 than for 30 June is found (Fig. 9b). This spectral depen-dence leads to the values ofαabsof 1.34 and 1.09 on 29 and
30 June, respectively. The return of the exponent to a value close to 1 is consistent with diesel aerosols becoming pre-dominant again. Figure 5c shows that theαabs reached val-ues up to nearly 2.0 during the dust intrusion on 29 June. To study the consistency of theαabsvalues obtained during this
dust event, they were compared with those obtained in other studies. Collaud-Coen et al. (2004) reportedαabs values
be-tween 1.5 and 1.8 during Saharan dust events at Jungfrau-joch, as well as a non-negligible spectral dependence ofω0.
Values ofαabsof 2.2 were reported by Bergstrom et al. (2002)
for mixed urban pollution and desert dust aerosols in ACE-Asia (Aerosol Characterization Experiment). Therefore, it
can be concluded that our determination of the Saharan dust episodes and the associated values of the Ångström expo-nent of single-scattering albedo are in good agreement with the published values.
Another event was detected on 20 (day 202) and 21 (day 203) July. HYSPLIT back trajectories arriving on 21 July at 500 and 1500 m a.g.l. reached Granada proceeding from the Mediterranean Sea, along northern Africa’s coast, although they have their origin in western France. At 3000 m a.g.l. they originate from the Atlantic Ocean (Fig. 6b). NAAPS predic-tions, presented in Fig. 7b and c, show influence of both dust and smoke aerosols at surface level on 20 July. The temporal evolution of RCS at 532 nm obtained from lidar measure-ments (Fig. 8b) shows the presence of aerosol particles up to 4000 m a.s.l., and especially high concentrations are mea-sured up to 2000 m a.s.l. Based on the NAAPS model and lidar measurements, aerosols measured at surface level are considered to be affected by wood smoke and mineral dust.
Values on 20 July were daily averaged starting at 12:00 UTC, when the event is first detected. The analysis of the wavelength dependence ofω0leads toαSSA= −0.08 on 20 July, showing again presence of dust, and to αSSA= −0.011 on 21 July, when the episode is over. In Fig. 9a a stronger spectral dependence ofω0during the event
is observed. Similar to the event on 29 July, variations in the spectral dependence indicate a change in the dominant source and origin of the aerosols which is corroborated with NAAPS predictions of dust and smoke aerosols at surface level. Fig-ure 9b shows that the spectral dependence ofbabs does not
show significant differences from one day to another; the val-ues ofαabsare 1.28 and 1.31 for 20 and 21 July, respectively. Although there are similarities in the spectral dependen-cies of the optical parameters, the two events differ: on 29 June the event is dominated by dust with largerω0 and
lowerbabs; on 20 and 21 July the aerosol is a mixture of
smoke and dust, with lowerω0and higherbabs.
5.2 Comparison between workdays and Sundays In Fig. 5d, based on the daily averages (blue dots), it was already observed thatbabswas generally higher during
work-days than on Sunwork-days. Due to these differences, the hourly average values in UTC of ω0 at 370 and 950 nm, babs at
370 and 950 nm, andαabshave been calculated for workdays
(Monday to Friday) and Sundays (Fig. 10).
In Fig. 10a it can be seen that during daytimeω0 is in general slightly higher on Sundays than workdays. At night-time,ω0 values are very similar, the difference being only
0.05. The fact that a less absorptive atmosphere is found on weekends than on workdays results directly from thebabs
be-haviour. During the daytime,babs for workdays is
consid-erably higher than during Sundays (Fig. 10b), which also causes lower ω0 from Monday to Friday. It is also seen
that on workdays and Sundays babs has two maxima, one
Figure 8.Lidar vertical profiles obtained for(a)29 June from 08:57 to 14:00 UTC and(b)20 July 11:30 to 13:30 UTC.
Figure 9. Spectral dependence of daily averaged(a)ω0 and(b) babsfor 29 June (black), 30 June (green), 20 July (red), and 21 July (blue).
the afternoon (between 18:00 and 21:00). Those maxima are strongly related to minima inω0. Usually, the morningbabs
maximum is considerably higher on workdays than on Sun-days due to its relation with traffic volume, which is more intense from Monday to Friday. This causes a more pro-nounced decrease inω0 during the workdays. On the other
hand, the evening maximum appears to be very similar for workdays and Sundays.
The diurnal variation of the exponentαabsshows no
impor-tant differences between workdays and Sundays. Unlikeω0,
this parameter appears to be not affected by maxima inbabs.
This corroborates the fact thatαabs is a parameter related to
Figure 10. Comparison of average during cycles for work-days (black) and Sunwork-days (green) of:(a)single-scattering albedo (ω0,660),(b)absorption coefficient (babs,660), and(c)αabs.
the type of absorbing particles and their source rather than to their concentration.
6 Conclusions
The attenuation coefficient at 637 nm was compensated applying the method proposed by Weingartner et al. (2003) and then compared tobabs obtained from MAAP
measure-ments. Furthermore, site-specific parameters for the load-ing (R(f,ATN)) and multiple scattering (C) were obtained. The values for the loading parameter (f )range from 1.15 at 370 nm to 1.11 at 950 nm, which is consistent with previous values reported by Weingartner et al. (2003), Sandradewi et al. (2008b), and Collaud-Coen et al. (2010), among others. Compensated data from both instruments were checked for any remaining loading effects, and none were found.
For the multiple-scattering effect, theC value at 637 nm was found to be 4.22±0.06, and it is in agreement with val-ues published in the literature for sites with similar character-istics. Results of the comparison with the MAAP give a slope of 1.005 and a correlation coefficient of 0.926. Therefore, the compensated factors obtained in this study provide a satisfac-tory compensation of the data and are used to calculate theC factor at other wavelengths.
To obtain the wavelength dependence of C(λ), the addi-tional parameters ms andC∗ are needed, which were ob-tained by Arnott et al. (2005) in laboratory experiments. These values proved to be quite low when applied to ambient measurements, so newC∗(λ)values were calculated in this study. TheC∗ value for ambient data calculated at 637 nm for this campaign exhibits a value of 3.93, while themsused
is the value provided by Arnott et al. (2005). Differences in C∗agree with those expected from Arnott et al. (2005) for ambient measurements. The same spectral dependence as in Arnott et al. (2005) has been used to obtainC∗at other wave-lengths.
Applying the iterative procedure proposed by Schmid et al. (2006),C(λ),ω0(λ), andαabsusing wavelengths from 370
to 950 nm were calculated.Cvalues obtained span from 3.42 at 370 nm to 4.59 at 950 nm, and their spectral differences are in agreement with the ones observed in Schmid et al. (2006) for the Amazon Basin.
Once the different parameters had been compensated and calculated at each wavelength, a study of their temporal evo-lution was performed. Averaged values ofω0range between
0.784 (at 370 nm) and 0.737 (at 950 nm), indicating that dur-ing July 2012 Granada’s atmosphere was significantly bur-dened with absorbing particles. This is in agreement with re-sults obtained by Lyamani et al. (2010) for the summer pe-riod. An average value of 1 forαabsis explained by the fact
that the Granada site is dominated by urban aerosols (Sun et al., 2007) whose major source is traffic.
Finally, the difference between workdays and Sundays shows that the absorption coefficients are higher during workdays than during Sundays as a consequence of the traf-fic intensity on the highway close to the station. These values cause decreases inω0, leading to an atmosphere with more
absorbing particles during the workdays. However, αabs is
not affected and exhibits no differences between work days
and Sundays as this value is more related to the aerosol type and their source, which does not strongly change at this site.
Acknowledgements. The authors gratefully acknowledge the
NOAA Air Resources Laboratory (ARL) for the provision of the HYSPLIT transport and dispersion model and/or READY website used in this publication. Also, we acknowledge the Naval Research Laboratory for providing the NAAPS data on their website. This work was financed jointly by the Spanish Ministry of Economy and Competitiveness and the European Regional Devel-opment Fund through projects CGL2011-24290, CGL2010-18782, CSD2007-00067, and CGL2012-33294; by the Valencia Au-tonomous Government through project PROMETEO/2010/064; the Andalusia Regional Government through projects P08-RNM-3568 and P10-RNM-6299; and by the Slovenian Ministry of Economic Development and Technology JR-KROP grant 3211-11-000519. The research leading to these results has received funding from the European Union Seventh Framework Programme (FP7/2007-2013) under grant agreement no. 262254 (ACTRIS). The collaboration of S. Segura in this work was possible thanks to fellowship BES-2010-031626.
Edited by: M. Rapp
References
Anderson, T. L. and Ogren, J. A.: Determining aerosol radiative properties using the TSI 3563 integrating nephelometer, Aerosol Sci. Tech., 29, 57–69, 1998.
Anderson, T. L., Covert, D. S., Marshall, S. F., Laucks, M. L., Charl-son, R. J., Waggoner, A. P., Ogren, J. A., Caldow, R., Holm, R. L., and Quant, F. R., Sem, G. J., Wiedensohler, A., Ahlquist, N. A., and Bates, T. S.: Performance Characteristics of a High Sensitiv-ity, Three-Wavelength, Total Scatter/Backscatter Nephelometer, J. Atmos. Ocean. Tech., 13, 967–986, 1996.
Ångström, A.: On the Atmospheric Transmission of Sun Radiation and on Dust in the Air, Geogr. Ann., 11, 156–166, 1929. Arnott, W. P., Hamasha, K., Moosmuller, H., Sheridan, P. J., and
Ogren, J. A.: Towards aerosol light-absorption measurements with a 7-wavelength aethalometer: Evaluation with a photoa-coustic instrument and 3-wavelength nephelometer, Aerosol Sci. Technol., 39, 17–29, 2005.
Ballach, J., Hitzenberger, R., Schultz, E., and Jaeschke, W.: Devel-opment of an improved optical transmission technique for black carbon (BC) analysis, Atmos. Environ., 35, 2089–2100, 2001. Baron, P. A. and Willeke, K.: Aerosol Measurement: Principles,
Techniques, and Applications, John Willey, Hoboken, N. J., 2005.
Bergstrom, R. W., Russell, P. B., and Hignett: Wavelength depen-dence of the absorption of black carbon particles: Predictions and results from the TARFOX experiment and implications for the aerosol single scattering albedo, Atmos. Sci., 59, 567–577, 2002.
Boesenberg, J., Balis, D., Flamant, P., Papalardo, G., Papayanis, A., Pelon, J., Schneider, J., Trickl, T., Visconti, G.: in: EARLINET: A European Aerosol Research Lidar Network, Advances in Re-mote Sensing, edited by: Dabas, A., Flamant, P., and Pelon, J., Selected papers from the 20th International Laser Radar Confer-ence, Vichy, France, 10–14 July, 2000, 155–158, 2001.
Bond, T. C. and Bergstrom: Light absorption by carbonaceous par-ticles: an investigative review, Aerosol Sci. Tech., 40, 27–67, doi:10.1080/02786820500421521, 2006.
Bond, T. C., Anderson, T. L., and Campbell, D.: Calibration and intercomparison of filter-based measurements of visible light ab-sorption by aerosols, Aerosol Sci. Technol., 30, 582–600, 1999. Brito, J., Rizzo, L. V., Herckes, P., Vasconcellos, P. C., Caumo,
S. E. S., Fornaro, A., Ynoue, R. Y., Artaxo, P., and Andrade, M. F.: Physical-chemical characterisation of the particulate mat-ter inside two road tunnels in the São Paulo Metropolitan Area, Atmos. Chem. Phys., 13, 12199–12213, doi:10.5194/acp-13-12199-2013, 2013.
Chand, D., Guyon, P., Artaxo, P., Schmid, O., Franck, G. P., Rizzo, L. V., Mayol-Bracero, O. L., Gatti, L. V., and Andreae, M. O.: Optical and physical properties of aerosols in the bound-ary layer and free troposphere over the Amazon Basin during the biomass burning season, Atmos. Chem. Phys., 6, 2911–2925, doi:10.5194/acp-6-2911-2006, 2006.
Christensen, J. H.: The Danish Eulerian hemispheric model – a three-dimensional air pollution model used for the artic, Atmos. Environ., 31, 4169–4191, 1997.
Collaud-Coen, M., Weingartner, E., Schaub, D., Hueglin, C., Cor-rigan, C., Henning, S., Schwikowski, M., and Baltensperger, U.: Saharan dust events at the Jungfraujoch: detection by wavelength dependence of the single scattering albedo and first climatology analysis, Atmos. Chem. Phys., 4, 2465–2480, doi:10.5194/acp-4-2465-2004, 2004.
Collaud-Coen, M., Weingartner, E., Apituley, A., Ceburnis, D., Fierz-Schmidhauser, R., Flentje, H., Henzing, J. S., Jennings, S. G., Moerman, M., Petzold, A., Schmid, O., and Baltensperger, U.: Minimizing light absorption measurement artifacts of the Aethalometer: evaluation of five correction algorithms, Atmos. Meas. Tech., 3, 457–474, doi:10.5194/amt-3-457-2010, 2010. De Castro, B. R., Wang, L., Mihalic, J. N., Breysse, P. N., and Geyh,
A. S.: The Longitudinal Dependence of Black Carbon Concen-tration on Traffic Volume in an Urban Environment, Japca J. Air Waste Manage., 58, 928–393, 2008.
Draxler, R. R. and Rolph, G. D.: HYSPLIT (HYbrid Single-Particle Lagrangian Integrated Trajectory), Model access via NOAA ARL READY Website, available at: http://www.arl.noaa.gov/ ready/hysplit4.html, NOAA Air Resources Laboratory, Silver Spring, MD, 2003.
Dubovik, O., Holben, B., Eck, T. F., Smirnov, A., Kaufman, Y. J., King, M. D., Tanré, D., and Slutsker, I.: Variability of absorption and optical properties of key aerosol types observed in world-wide locations, Atmos. Sci., 59, 590–608, 2002.
Esteve, A. R., Estellés, V., Utrillas, M. P., and Martínez-Lozano, J. A.: In-situ integrating nephelometer measurements of the scat-tering properties of atmospheric aerosols at an urban coastal site in western Mediterranean, Atmos. Environ., 47, 43–50, 2012.
Fialho, P., Hansen, A. D. A., and Honrath, R. E.: A new approach to decouple dust and black carbon absorption coefficients using seven-wavelength Aethalometer data, J. Aerosol Sci., 36, 267– 282, 2005.
Guerrero-Rascado, J. L., Ruiz, B., and Alados-Arboledas, L.: Multi-spectral lidar characterization of the vertical structure of Saharan dust aerosol over southern Spain, Atmos. Environ., 42, 2668– 2681, 2008.
Gundel, L. A., Dod, R. L., Rosen, H., and Novakov, T.: The relation-ship between optical attenuation and black carbon concentration for ambient and source particles, Sci. Total Environ., 36, 197– 202, 1984.
Hansen, A. D. A.: The Aethalometer TM. Magee Scientific Com-pany, Berkeley, California, USA, available at: http://mageesci. com/images/stories/docs/Aethalometer_book_2005.07.03.pdf (last access: August 2014), 2005.
Hansen, A. D. A., Rosen, H., and Novakov, T.: Real-time mea-surement of the absorption coefficient of aerosol particles, Appl. Opt., 21, 3060–3062, 1982.
Hansen, A. D. A., Rosen, H., and Novakov, T.: The aethalometer; an instrument for the real-time measurements of optical absorption by aerosol particles, Sci. Total Environ., 36, 191–196, 1984. Heintzenberg, J., Wiedensohler, A., Tuch, T. M., Covert, D. S.,
Sheridan, P. J., Ogren, J. A., Gras, J., Nessler, R., Kleefeld, C., Kalivitis, N., Aaltonen, V., Wilhelm, R.-T., and Havlicek, M.: In-tercomparisons and aerosol calibrations of 12 commercial inte-grating nephelometers of three manufacturers, J. Atmos. Ocean. Tech., 23, 902–914, 2006.
Horvath, H: Atmospheric light absorption: a review, Atmos. Envi-ron., 27, 293–317, 1993.
Houghton, J. T., Ding, Y., Griggs, D. J., Noguer, M., van der Linden, P. J., and Xiaosu, D.: Climate Change 2001: The Scientific Basis, Cambridge Univ. Press, New York, 2001.
Hyvärinen, A. P., Vakkari, V., Laakso, L., Hooda, R. K., Sharma, V. P., Panwar, T. S., Beukes, J. P., van Zyl, P. G., Josipovic, M., Garland, R. M., Andreae, M. O., Pöschl, U., and Petzold, A.: Correction for a measurement artifact of the Multi-Angle Ab-sorption Photometer (MAAP) at high black carbon mass concen-tration levels, Atmos. Meas. Tech., 6, 81–90, doi:10.5194/amt-6-81-2013, 2013.
IPCC: in: Climate Change 2013, edited by: Stocker, T. F., Qin, D., Plattner, G.-K., Tignor, M., Allen, S. K., Boschung, J., Nauels, A., Xia, Y., Bex, V., and Midgley, P. M., The Physical Science Basis. Working Group I Contribution to the IPCC 5th Assess-ment Report – Changes to the underlying Scientific/Technical Assessment. Cambridge University Press, Cambridge, UK & New York, USA, 2013.
Jacobson, M. Z.: Studying the effects of aerosol son vertical pho-tolysis rate coefficient and temperature profiles over an urban air shed, J. Geophys. Res., 103, 10593–10604, 1998.
Kanaya, Y., Komazaki, Y., Pochanart, P., Liu, Y., Akimoto, H., Gao, J., Wang, T., and Wang, Z.: Mass concentrations of black carbon measured by four instruments in the middle of Central East China in June 2006, Atmos. Chem. Phys., 8, 7637–7649, doi:10.5194/acp-8-7637-2008, 2008.
Lack, D. A., Cappa, C. D., Cross, E. S., Massoli, P., Ahern, A. T., Davidovits, P., and Onasch, T. B.: Absorption enhancement of coated absorbing aerosols: validation of the photo-acoustic tech-nique for measuring the enhancement, Aerosol Sci. Technol., 43, 1006–1012, doi:10.1080/02786820903117932, 2009.
Lyamani, H., Olmo, F. J., and Alados-Arboledas, L.: Light scatter-ing and absorption properties of aerosol particles in the urban en-vironment of Granada, Spain, Atmos. Environ., 42, 2630–2642, doi:10.1016/j.atmosenv.2007.10.070, 2008.
Lyamani, H., Olmo, F. J., and Alados-Arboledas, L.: Physical and optical properties of aerosols over an urban location in Spain: Seasonal and diurnal variability, Atmos. Chem. Phys., 10, 239– 254, doi:10.5194/acp-10-239-2010, 2010.
Lyamani, H., Olmo, F. J., Foyo I., and Alados-Arboledas, L.: Black carbon aerosols over an urban area in south-eastern Spain: Changes detected after the 2008 economic crisis, Atmos. Envi-ron., 45, 6423–6432, 2011.
Moosmüller, H., Chakrabarty, R. K., and Arnott, W. P.: Aerosol light absorption and its measurement: A review, J. Quant. Spectrosc. Ra., 110, 844–878, doi:10.1016/j.jqsrt.2009.02.035, 2009. Müller, T., Henzing, J. S., de Leeuw, G., Wiedensohler, A.,
Alastuey, A., Angelov, H., Bizjak, M., Collaud-Coen, M., En-gstrom, J. E., Gruening, C., Hillamo, R., Hoffer, A., Imre, K., Ivanow, P., Jennings, G., Sun, J. Y., Kalivitis, N., Karlsson, H., Komppula, M., Laj, P., Li, S.-M., Lunder, C., Marinoni, A., Mar-tins dos Santos, S., Moerman, M., Nowak, A., Ogren, J. A., Pet-zold, A., Pichon, J. M., Rodriquez, S., Sharma, S., Sheridan, P. J., Teinila, K., Tuch, T., Viana, M., Virkkula, A., Weingart-ner, E., Wilhelm, R., and Wang, Y. Q.: Characterization and in-tercomparison of aerosol absorption photometers: result of two intercomparison workshops, Atmos. Meas. Tech., 4, 245–268, doi:10.5194/amt-4-245-2011, 2011.
Mukai, H. and Ambe, Y.: characterization of a humic acid-like Brown substance in airborne particulate matter and tentative identification of its origin, Atmos. Environ., 20, 813–819, 1986. Nakayama, T., Kondo, Y., Moteki, N., Sahu, L. K., Kinase, T., Kita, K., and Matsumi, Y.: Size-dependent correction factors for absorption measurements using filter-based photometers: PSAP and COSMOS, J. Aerosol Sci., 41, 333–343, 2010.
Park, S. S., Hansen, A. D. A., and Cho, Y.: Measurement of real time black carbon for investigating spot loading effects of Aethalome-ter data, Atmos. Environ., 11, 1449–1455, 2010.
Petzold, A. and Schönlinner, M.: Multi-angle absorption photome-try – a new method for the measurement of aerosol light absorp-tion and atmospheric black carbon, J. Aerosol Sci., 35, 421–441, 2004.
Petzold, A., Kopp, C., and Niessner, R.: The dependence of the specific attenuation cross section on black carbon mass fraction and particle size, Atmos. Environ., 31, 661–672, 1997.
Petzold, A., Schloesser, H., Sheridan, P. J., Arnott, W., Ogren, J. A., and Virkkula, A.: Evaluation of multiangle absorption photome-try for measuring aerosol light absorption, Aerosol Sci. Technol., 39, 40–51, 2005.
Ramanathan, V., Crutzen, P. J., Kiehl, J. T., and Rosenfeld, D.: Aerosols, Climate, and hydrological cycle, Science, 7, 2119– 2124, 2001.
Rizzo, L. V., Correia, A. L., Artaxo, P., Procópio, A. S., and An-dreae, M. O.: Spectral dependence of aerosol light absorption over the Amazon Basin, Atmos. Chem. Phys., 11, 8899–8912, doi:10.5194/acp-11-8899-2011, 2011.
Sandradewi, J., Prevot, A. S. H., Szidat, S., Perron, N., Lanz, V. A., Weingartner, E., and Baltensperger, U.: Using aerosol light absorption measurements for the quantitative determination of wood burning and traffic emission contributions to particulate matter, Environ. Sci. Technol., 42, 3316–3323, 2008a.
Sandradewi, J., Prevot, A. S. H., Weingartner, E., Schmidhauser, R., Gysel, M., and Baltensperger, U.: A study of wood burning and traffic aerosols in an Alpine valley using a multi-wavelength aethalometer, Atmos. Environ., 42, 101–112, 2008b.
Schmid, O., Artaxo, P., Arnott, W. P., Chand, D., Gatti, L. V., Frank, G. P., Hoffer, A., Schnaiter, M., and Andreae, M. O.: Spectral light absorption by ambient aerosols influenced by biomass burn-ing in the Amazon Basin. I: Comparison and field calibration of absorption measurement techniques, Atmos. Chem. Phys., 6, 3443–3462, doi:10.5194/acp-6-3443-2006, 2006.
Sheridan, P. J., Arnott, W. P., Ogren, J. A., Andrews, E., Atkinson, D. B., Covert, D. S., Moosmuller, H., Petzold, A., Schmid, B., Strawa, A. W., Varma, R., and Virkkula, A.: The Reno Aerosol Optics Study: An Evaluation of Aerosol Absorption Measure-ment Methods, Aerosol Sci. Technol., 39, 1–16, 2005.
Sun, H., Biedermann, L., and Bond, T. C.: Color of Brown carbon: A model for ultraviolet and visible light absorption by organic carbon aerosol, Geophys. Res. Lett., 34, L17813, doi:10.1029/2007GL029797, 2007.
Titos, G., Foyo-Moreno, I., Lyamani, H., Querol, X., Alastuey, A., and Alados-Arboledas, L.: Optical properties and chemical com-position of aerosol particles at an urban location: An estimation of the aerosol mass scattering and absorption efficiencies, J. Geo-phys. Res., 117, D04206, doi:10.1029/2011JD016671, 2012. Virkkula, A., Makel, T., Yli-Tuomi, T., Hirsikko, A., Koponen, I. K.,
Hameri, K., and Hillamo, R.: A simple procedure for correcting loading effects of aethalometer data, Japca J. Air Waste Manage., 57, 1214–1222, doi:10.3155/1047-3289.57.10.1214, 2007. Weingartner, E., Saathoff, H., Schnaiter, M., Streit, N., Bitnar, B.,