ACPD
15, 31053–31087, 2015Evaluation of size segregation of elemental carbon emission in Europe
Y. Chen et al.
Title Page
Abstract Introduction
Conclusions References
Tables Figures
◭ ◮
◭ ◮
Back Close
Full Screen / Esc
Printer-friendly Version
Interactive Discussion
Discussion
P
a
per
|
Discussion
P
a
per
|
Discussion
P
a
per
|
Discussion
P
a
per
Atmos. Chem. Phys. Discuss., 15, 31053–31087, 2015 www.atmos-chem-phys-discuss.net/15/31053/2015/ doi:10.5194/acpd-15-31053-2015
© Author(s) 2015. CC Attribution 3.0 License.
This discussion paper is/has been under review for the journal Atmospheric Chemistry and Physics (ACP). Please refer to the corresponding final paper in ACP if available.
Evaluation of size segregation of
elemental carbon emission in Europe:
influence on atmospheric long-range
transportation
Y. Chen1,2, Y. F. Cheng2, S. Nordmann2,3, W. Birmili1,
H. A. C. Denier van der Gon4, N. Ma1, R. Wolke1, B. Wehner1, J. Sun1, G. Spindler1, Q. Mu2, U. Pöschl2, H. Su2, and A. Wiedensohler1
1
Leibniz-Institute for Tropospheric Research, Leipzig, Germany
2
Multiphase Chemistry Department, Max Planck Institute for Chemistry, Mainz, Germany
3
German Environmental Agency, Dessau-Roßlau, Germany
4
TNO, dept. Climate, Air, and sustainability, Utrecht, the Netherlands
Received: 25 September 2015 – Accepted: 19 October 2015 – Published: 6 November 2015 Correspondence to: Y. F. Cheng (yafang.cheng@mpic.de)
and A. Wiedensohler (ali@tropos.de)
ACPD
15, 31053–31087, 2015Evaluation of size segregation of elemental carbon emission in Europe
Y. Chen et al.
Title Page
Abstract Introduction
Conclusions References
Tables Figures
◭ ◮
◭ ◮
Back Close
Full Screen / Esc
Printer-friendly Version
Interactive Discussion
Discussion
P
a
per
|
Discussion
P
a
per
|
Discussion
P
a
per
|
Discussion
P
a
per
|
Abstract
Elemental Carbon (EC) has significant impact on human health and climate change. In order to evaluate the size segregation of EC emission and investigation of its influ-ence on atmospheric transport processes in Europe, we used the fully coupled online Weather Research and Forecasting/Chemistry model (WRF-Chem) at a resolution of
5
2 km focusing on a region in Germany, in conjunction with a high-resolution EC emis-sion inventory. The ground meteorology conditions, vertical structure and wind pattern were well reproduced by the model. The simulations of particle number/mass size dis-tributions were evaluated by observations taken at the central European background site Melpitz. The fine mode aerosol was reasonably well simulated, but the coarse
10
mode was substantially overestimated by the model. We found that it was mainly due to the nearby point source plume emitting a high amount of EC in the coarse mode. The comparisons between simulated EC and Multi-angle Absorption Photometers (MAAP) measurements at Melpitz, Leipzig-TROPOS and Bösel indicated that coarse mode EC (ECc) emission in the nearby point sources might be overestimated by a factor of 2–10.
15
The emission fraction of EC in coarse mode was overestimated by about 10–30 % for Russian and 5–10 % for Eastern Europe (e.g.: Poland and Belarus), respectively. This overestimation in ECc emission fraction makes EC particles having less opportunity to accumulate in the atmosphere and participate to the long range transport, due to the shorter lifetime of coarse mode aerosol. The deposition concept model showed
20
ACPD
15, 31053–31087, 2015Evaluation of size segregation of elemental carbon emission in Europe
Y. Chen et al.
Title Page
Abstract Introduction
Conclusions References
Tables Figures
◭ ◮
◭ ◮
Back Close
Full Screen / Esc
Printer-friendly Version
Interactive Discussion
Discussion
P
a
per
|
Discussion
P
a
per
|
Discussion
P
a
per
|
Discussion
P
a
per
1 Introduction
Elemental carbon (EC) and black carbon (BC) are characterized by their strongly radi-ation absorbing effect (Hansen et al., 2000; Jacobson et al., 2000; Bond et al., 2013) and adverse health effects (Pope et al., 2009; Bond et al., 2013). For climate change, EC is the second strongest contributor to current global warming with a total
radia-5
tive forcing of about+1.1 W m−2, just after the carbon dioxide (Bond et al., 2007; Ra-manathan et al., 2008). Globally, biomass burning (40 %), fossil fuel combustion (40 %) and biofuels combustion (20 %) are the major source of EC emission (Ramanathan et al., 2008). The EC particles freshly emitted from incomplete combustion have sizes around 100 nm (Rose et al., 2006). The EC particles size information is also very
sig-10
nificant for climate, long range transport and health effect. These fine mode EC parti-cles are much more important than the coarse mode, since the fine EC partiparti-cles have longer lifetime than coarse particles (Petzold and Kärcher, 2012; Croft et al., 2014), they have higher chances to accumulate in the atmosphere and participate long range transportation (e.g. Himalayan and arctic region), then contribute to the global scale
15
climate forcing. Previous studies showed that EC long range transport and deposition on ice could contribute to the glacier melting in Himalayan (Ming et al., 2008) and arctic region (McConnell et al., 2007; Ramanathan et al., 2008).The EC deposition on snow and ice could change the surface albedo, absorbs solar radiation and causes positive climate forcing. Furthermore, for health effect, the fine EC particles could translocate
20
from lung to blood with the adsorbed toxic matters (e.g.: heavy metal) inducing many disease (Pope et al., 2009; Meister et al., 2012). Global emission inventories for EC have been published (e.g.: Bond et al., 2004 and Lamarque et al., 2010). An emission inventory over Europe for EC (EUCAARI 42-Pan-European Carbonaceous aerosol in-ventory) has been published with a 1/8◦
×1/16◦ high resolution and separated size
25
mode (PM1, PM1−2.5and PM2.5−10 (Visschedijk et al., 2008).
ACPD
15, 31053–31087, 2015Evaluation of size segregation of elemental carbon emission in Europe
Y. Chen et al.
Title Page
Abstract Introduction
Conclusions References
Tables Figures
◭ ◮
◭ ◮
Back Close
Full Screen / Esc
Printer-friendly Version
Interactive Discussion
Discussion
P
a
per
|
Discussion
P
a
per
|
Discussion
P
a
per
|
Discussion
P
a
per
|
of 0.4 (0.05–0.8), 0.2 and 0.04 (0.02–0.09) W m−2from fossil fuel combustion, biomass burning and deposition on snow, respectively. The uncertainties in the evaluation of BC global and regional climate effect may be due to uncertainties in BC mass con-centrations, which are derived from BC emission and removal processes (Koch et al., 2009). Emissions of carbonaceous aerosols are notoriously uncertain (Denier et al.,
5
2015). The European Environment Agency report (EEA, 2013) indicate that it was al-most impossible to evaluate uncertainty overall at the EU level. The uncertainty for EC emissions is at least 50 % on global scales, and a factor of 2 to 5 on regional scale (Ramanathan et al., 2008). The uncertainty is originated not only from an instrument measurement uncertainty but also the conditions under which the emission factor
mea-10
surements take place (Denier et al., 2015).
The definition of EC and BC depend on how these species were measured. BC is used for an optical determination and EC for a thermographic measurement method (Vignati et al., 2010; Nordmann et al., 2013). However, the discrepancies between EC and BC are usually disregarded, and they are interchangeable in the modelling
15
studies (Vignati et al., 2010). Nordmann et al. (2013) showed that the EC and BC were good correlated in the German Ultrafine Aerosol Network (GUAN) sites measurements. Nordmann et al. (2013, 2014) indicate that EC in the model can be used as the best approximation of BC in modelling study.
Lots of modelling studies have been done to evaluate the EC emission and model
20
performance in Europe. Koch et al. (2009) evaluated 17 global models and find out 13 of 17 models over-estimate EC in Europe. Stern et al. (2008) compared 5 models result with northern Germany observations, and none of the models could reproduce the high EC concentration at central Europe background station Melpitz. Genberg et al. (2013) pointed out that the EMEP MSC-W model underestimates the EC concentration at
Mel-25
ACPD
15, 31053–31087, 2015Evaluation of size segregation of elemental carbon emission in Europe
Y. Chen et al.
Title Page
Abstract Introduction
Conclusions References
Tables Figures
◭ ◮
◭ ◮
Back Close
Full Screen / Esc
Printer-friendly Version
Interactive Discussion
Discussion
P
a
per
|
Discussion
P
a
per
|
Discussion
P
a
per
|
Discussion
P
a
per
In this work, a high resolution WRF-Chem simulation was set up conjunction with the EUCAARI EC inventory, focusing on central Europe region. The modelling result was evaluated by the aerosol and EC/BC in-situ measurements from GUAN and HOPE-Melpitz Campaign. The EC emission fraction for coarse (PM2.5−10) mode of the EU-CAARI inventory was evaluated. The lifetime size dependent transportation concept
5
model was designed to show the significane of size information for EC transport. The high polluted episode in 2009 April (Nordmann et al., 2014) was re-simulated for vali-dating the influence of size segregation in EC transportation.
2 Data and method
2.1 WRF-Chem model
10
The fully coupled “online” Weather Research and Forecasting/Chemistry model (WRF-Chem V3.5.1) is a state-of-the-art regional air quality model (Grell et al., 2005). It is suitable for a broad spectrum of atmospheric research with horizontal extents ranging from hundreds meters to thousands kilometers. Trace gases, aerosols, and interactive processes with meteorology are simulated with several treatments in the model (Grell
15
et al., 2005). The following is a brief summary of the primary WRF-Chem modules relevant to the current study.
2.1.1 Gas phase chemistry
In this study, the Carbon-Bond Mechanism version Z (CBMZ, Zaveri et al., 1999; Fast et al., 2006) was used for gas-phase atmospheric chemistry. 67 prognostic species
20
ACPD
15, 31053–31087, 2015Evaluation of size segregation of elemental carbon emission in Europe
Y. Chen et al.
Title Page
Abstract Introduction
Conclusions References
Tables Figures
◭ ◮
◭ ◮
Back Close
Full Screen / Esc
Printer-friendly Version
Interactive Discussion
Discussion
P
a
per
|
Discussion
P
a
per
|
Discussion
P
a
per
|
Discussion
P
a
per
|
2.1.2 Aerosol representation
For representing aerosol particles in WRF-Chem in this study, the MOdel for Simulating Aerosol Interactions and Chemistry (MOSAIC, Zaveri et al., 2008) is used. In MOSAIC, dry aerosol particles with eight discrete size bins were selected with upper and lower bin diameters defined as shown in Table 1; and particles are assumed to be inter-mixed
5
in each bin (Zaveri et al., 2008).
MOSAIC treats the following chemical species: sulfate, methane sulfonate, nitrate, chloride, carbonate, ammonium, sodium, calcium, elemental carbon (EC), organic car-bon (OC) and other inorganic mass. Both particle mass and particle number are sim-ulated for each bin. Water uptake or loss will not transfer particles between bins, since
10
bins are based on dry particle diameters (Zaveri et al., 2008). However, particle growth or reduction due to chemical processes (e.g., uptake or release of trace gases, etc.) and physical processes (e.g., coagulation, etc.) will transfer particles between bins (Chapman et al., 2009). In addition, particle coagulation and nucleation processes of sulfuric acid and water vapor are included (Fast et al., 2006; Zaveri et al., 2008). But
15
the formation mechanism of Secondary Organic Aerosol (SOA) is not included in this version (Zaveri et al., 2008).
In WRF-Chem, dry (Binkowski et al., 1995) and wet (Easter et al., 2004) deposition processes of aerosol particles are considered. The dry deposition of aerosol in the lowest model layer is derived from the deposition velocities, which is depended on the
20
sublayer resistance, aerodynamic resistance and surface resistance (Grell et al., 2005). The scavenging of cloud-phase and below-cloud aerosol by interception and impaction processes is calculated by look-up tables. It is worth mention that the particles are treated internally mixed in each bin; therefore the hygroscopicity of EC contained par-ticles tends to be slightly overestimated in the model. Furthermore, the model tends
25
ACPD
15, 31053–31087, 2015Evaluation of size segregation of elemental carbon emission in Europe
Y. Chen et al.
Title Page
Abstract Introduction
Conclusions References
Tables Figures
◭ ◮
◭ ◮
Back Close
Full Screen / Esc
Printer-friendly Version
Interactive Discussion
Discussion
P
a
per
|
Discussion
P
a
per
|
Discussion
P
a
per
|
Discussion
P
a
per
overestimated. However, it was mostly dry condition before 16 September 2013 in this simulation.
2.1.3 Model setup
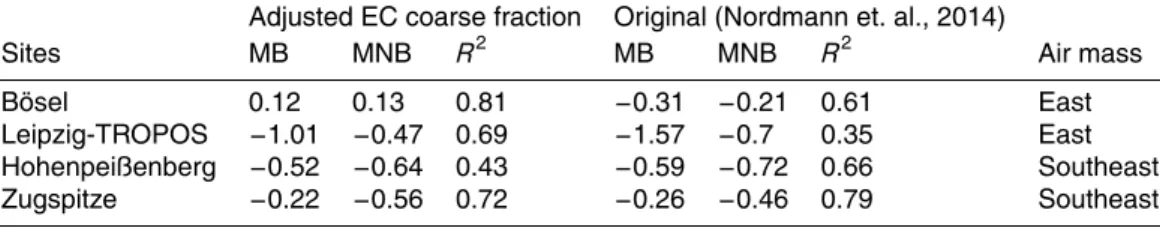
As shown in Fig. 1, the simulation consists of 4 nested domains with 39 vertical layers. The outer domain (D01) covers Europe and the inner domain (D04) focus on Saxony
5
in Germany with the spatial resolution of 2 km and is centered at Melpitz (12.93◦E, 51.53◦N). The time period from 10 to 20 September 2013 was simulated, with 2 days spin-up. The model meteorology fields are driven and forced by Final Analysis (FNL) Operational Global Analysis data (http://rda.ucar.edu/datasets/ds083.2/) and sea sur-face temperature (SST) dataset (http://polar.ncep.noaa.gov/sst/oper/Welcome.html)
10
from NCEP (National Center for Environmental Prediction), with 1◦spatial and 6 h tem-poral resolution. The chemical initial and boundary conditions were driven and forced by MOZART-4 global model results (http://www.acd.ucar.edu/wrf-chem/mozart.shtml) with 1.9◦
×2.5◦spatial and 6 h temporal resolution. The physics schemes used for
sim-ulation are summarized in Table 2. The aerosol-cloud-radiation interaction is turned
15
on.
2.2 Emissions
In this study, biogenic emissions are taken from the Model of Emissions of Gases and Aerosols from Nature (MEGAN, Guenther et al., 2006). The Fire INventory from NCAR (FINN, Wiedinmyer et al., 2011), with 1 km spatial and 1 h temporal resolution, was
20
used in this study. In previous studies it was shown that the dust emission scheme (Saide et al., 2012) and the sea-salt emission scheme (Saide et al., 2012; Zhang et al., 2013) in WRF-Chem have large uncertainties. However, based on the filter measure-ments with high volume sampler DIGITEL DHA-80 (Walter Riemer Messtechnik, Ger-many) at Melpitz, dust and sea-salt have contribution less than 3 % of aerosol mass in
25
ACPD
15, 31053–31087, 2015Evaluation of size segregation of elemental carbon emission in Europe
Y. Chen et al.
Title Page
Abstract Introduction
Conclusions References
Tables Figures
◭ ◮
◭ ◮
Back Close
Full Screen / Esc
Printer-friendly Version
Interactive Discussion
Discussion
P
a
per
|
Discussion
P
a
per
|
Discussion
P
a
per
|
Discussion
P
a
per
|
The anthropogenic emissions were taken from the Pan-European Carbonaceous aerosol inventory (Visschedijk et al., 2008) for EC and OC, which was developed in the framework of the European Integrated project on Aerosol Cloud Climate and Air Quality interactions (EUCAARI, Kulmala et al., 2011) for the year 2005. It is available on a spatial resolution of 1/8◦
×1/16◦longitude–latitude grid, corresponding to around
5
7 km (Fig. 1). Point source emissions are distributed according to location, capacity and fuel type (if available), and area sources are distributed using distribution maps of proxy data such as population density, detailed descriptions for gridding are given in Denier et al. (2010). The EC emissions in different size modes (PM1, PM1−2.5 and PM2.5−10) are provided. The emissions are assumed to be equally distributed over the
10
whole year. A diurnal cycle of the emissions were applied with two maxima, around 07:00 and 18:00 LT. The emissions were allocated in the first 6 layers (from surface to about 550 m) of the model depending on the emission types, such as area emission, small and large point sources. The vertical turbulent mixing was turned on in the sim-ulation. The comparison between EUCAARI and Lamarque EC emission (Bond et al.,
15
2007; Junker et al., 2008; Lamarque et al., 2010) was given in Nordmann et al. (2014), which shown that the EUCAARI emissions are around 30 % higher in eastern Euro-pean countries Poland, Czech Republic and Belarus.
The EMEP inventory for 2013 (http://www.ceip.at, Mareckova, 2013), with 0.5◦
×0.5◦
spatial resolution, was applied in the model for the other anthropogenic emissions,
20
such as PM, SO2, NOx, CO, NH3, NH4 and volatile organic compounds (VOC). The emissions of VOCs from EMEP were allocated to compounds used in CBMZ chemical mechanism of WRF-Chem.
2.3 Observations
The measurements from HOPE-Melpitz Campaign (HD(CP)2Observational Prototype
25
ACPD
15, 31053–31087, 2015Evaluation of size segregation of elemental carbon emission in Europe
Y. Chen et al.
Title Page
Abstract Introduction
Conclusions References
Tables Figures
◭ ◮
◭ ◮
Back Close
Full Screen / Esc
Printer-friendly Version
Interactive Discussion
Discussion
P
a
per
|
Discussion
P
a
per
|
Discussion
P
a
per
|
Discussion
P
a
per
(e.g. O3, NOx, SO2) were simultaneously measured. In addition, the radio-sounding data for the stations all-over Europe (http://www.weather.uwyo.edu/upperair/sounding. html) were used for evaluating the modelled atmosphere vertical structure.
The regional background site Melpitz (12.93◦E, 51.53◦N) site is representative for a larger rural area in Saxony Germany, detailed description was given in (Brüggemann
5
et al., 1999; Spindler et al., 2010, 2012; Poulain et al., 2011). A Twin Differential Mobil-ity Particle Sizer (TDMPS, TROPOS, Leipzig, Germany; Birmili et al., 1999) was used to measure the Particle Number Size Distribution (PNSD) with an electrical mobility di-ameter between 5 and 800 nm. An Aerodynamic Particle Sizer (APS Model 3320, TSI, Inc., Shoreview, MN USA) was employed to measure PNSD with aerodynamic
diame-10
ter from 0.5 to 10 µm. All of them were operated under dry conditions. All the particles were assumed as spherical (shape factor=1), with a density of 1.8 g cm−3for the sub-micrometer particles and 1.5 g cm−3 for the super-micrometer particles (Heintzenberg et al., 1998). The mobility diameter can be calculated from the aerodynamic diameter and Particle Mass Size Distribution (PMSD) can be calculated from PNSD, details were
15
described in Heintzenberg et al. (1998). Then PNSD and PMSD in the diameter range of 5–10 000 nm can be derived from TDMPS (5–638 nm) and APS (638–10 000 nm) measurements. A high volume sampler DIGITEL DHA-80 (Walter Riemer Messtech-nik, Germany), with sampling flux of about 30 m3h−1, was used for parallel continuous daily samples of PM10, detailed information was given in Spindler et al. (2013).
Addi-20
tionally, radio-sounding measurements were performed in Melpitz on the days 11–14, 17 and 19 September 2013.
At Melpitz, Bösel (7.94◦E, 53.0◦N) and Leipzig-TROPOS (12.43◦E, 51.35◦N), Multi-angle Absorption Photometers (MAAP Model 5012, Thermo, Inc., Waltham, MA USA) were employed to determine the particle light absorption coefficient for dry particles.
25
ACPD
15, 31053–31087, 2015Evaluation of size segregation of elemental carbon emission in Europe
Y. Chen et al.
Title Page
Abstract Introduction
Conclusions References
Tables Figures
◭ ◮
◭ ◮
Back Close
Full Screen / Esc
Printer-friendly Version
Interactive Discussion
Discussion
P
a
per
|
Discussion
P
a
per
|
Discussion
P
a
per
|
Discussion
P
a
per
|
Leipzig-TROPOS. Since EC and absorption-related BC are highly correlated in Ger-many GUAN Network sites (Nordmann et al., 2013), we use the MAAP measured BC as the best approximation of EC (Nordmann et al., 2014) in this study.
3 Result and discussion
3.1 Meteorology conditions
5
The WRF performance on simulating the meteorological fields was evaluated with the Melpitz ground measurements data and radio-sounding measurements over the whole Europe. The wind pattern in simulated time period was dominated by westerly winds in Melpitz (Fig. S1d in the Supplement). It is mostly in dry condition between 13 and 15 September in Melpitz. The air mass of northern Germany changed from continental
10
to maritime after 15 September. As shown in Fig. S1 in the Supplement, the tempera-ture, relative humidity, wind speed and wind direction were in good agreement with the measurements, with a correlation coefficient (R2) of 0.88, 0.72, 0.74, and 0.74 respec-tively. The peaks in NO concentration can be reproduced by the model, although there is some overestimation (Fig. S2 in the Supplement). The transport process and
emis-15
sion location were also supposed to be well described in the model, because NO has very short lifetime and therefore a good indicator of nearby source. These results show that the WRF model can well reproduce the near surface meteorological condition and transport processes at Melpitz.
The vertical gradient of the potential temperature is an important indicator for the
20
stability of atmosphere. Figure S3 in the Supplement shows aR2 map of comparison between radio-sounding observed and simulated vertical potential temperature in plan-etary boundary layer (PBL, under 3 km). TheR2are higher than 0.8 for all the stations over Europe, especially for Melpitz region theR2 is higher than 0.9. The comparison at the Melpitz site is shown in Table 3, together with some profile examples in Fig. S4
25
agree-ACPD
15, 31053–31087, 2015Evaluation of size segregation of elemental carbon emission in Europe
Y. Chen et al.
Title Page
Abstract Introduction
Conclusions References
Tables Figures
◭ ◮
◭ ◮
Back Close
Full Screen / Esc
Printer-friendly Version
Interactive Discussion
Discussion
P
a
per
|
Discussion
P
a
per
|
Discussion
P
a
per
|
Discussion
P
a
per
ment with measurements, withR2 value of 0.98, 0.84, 0.93 and 0.70 for the potential temperature, water vapor mixing ratio, wind speed and wind direction respectively. The results indicate that WRF well simulated the meteorological vertical structure and wind pattern, especially in central Europe (Melpitz region with 2 km resolution).
3.2 Particle size distribution
5
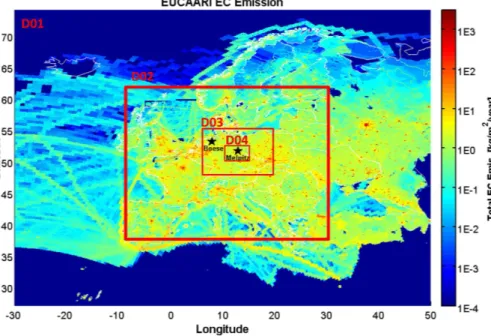
The modelled particle number size distribution (PNSD) and particle mass size distribu-tion (PMSD) for Melpitz were compared with the measurements, shown in Fig. 2. For the fine mode (PM1) aerosol the agreement is acceptable, but the model significantly overestimated the coarse mode (PM2.5−10) mass/number. The meteorology condition was well reproduced by the model. The transportation process was also supposed to
10
be well simulated. It indicates that there may be some unrealistic sources of particles larger than 2.5 µm included in the model, which leads to the overestimation of coarse mode.
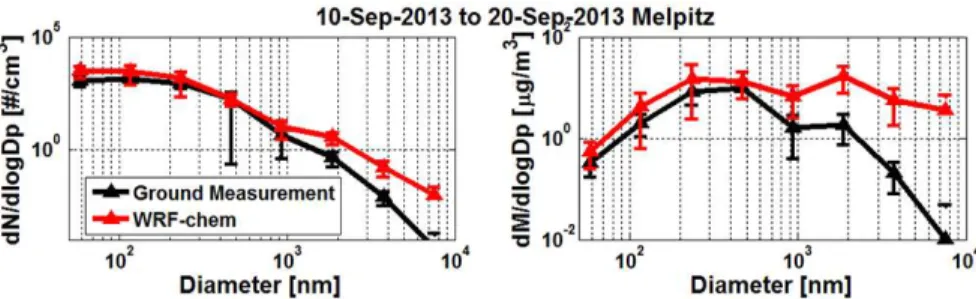
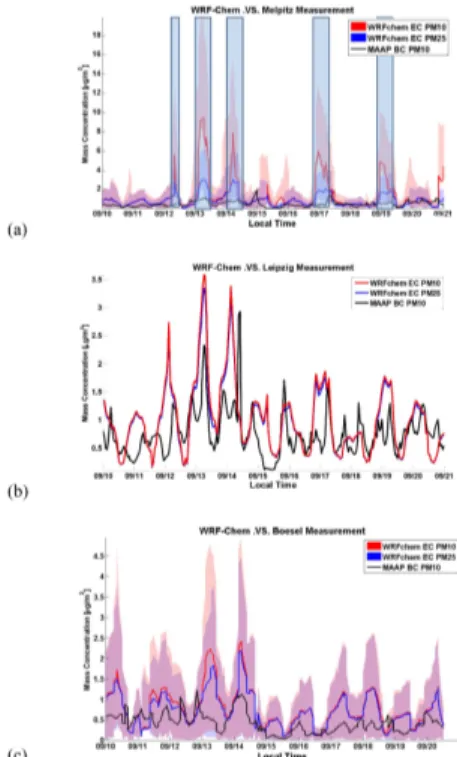
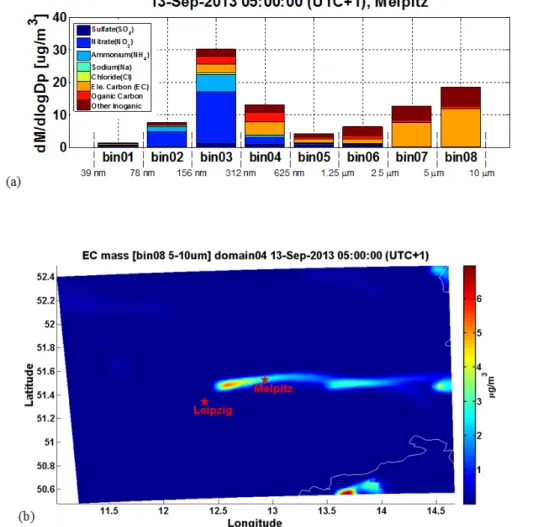
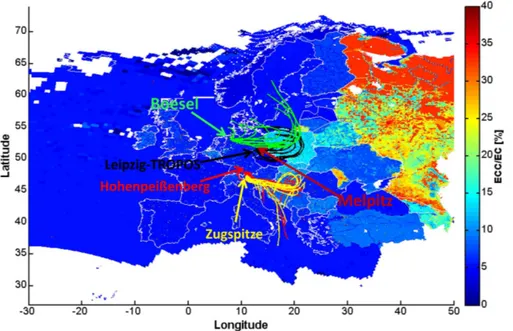
We found out that EC has a very high contribution of modelled coarse mode aerosol mass when the EC plumes hit Melpitz (Figs. 3a and 4a). In order to investigate the
15
reasons of the EC plumes and its influence on coarse mode overestimation, a more detailed case study for the plume episode in the morning of 13 September will be given in Sect. 3.3.
3.3 Elemental Carbon source evaluation
In order to evaluate the EC emission in central Europe and investigate local effect of
20
point source, MAAP measurements of 3 background sites (Melpitz, Leipzig-TROPOS and Bösel) were compared with modelled result (Fig. 3). According to modelled trans-portations, Melpitz and Bösel were influenced by the point source plume, but Leipzig-TROPOS was not (see Fig. S5 in the Supplement). Here we use MAAP instead of DIGITEL measurement to compare with the model output, because only MAAP data
ACPD
15, 31053–31087, 2015Evaluation of size segregation of elemental carbon emission in Europe
Y. Chen et al.
Title Page
Abstract Introduction
Conclusions References
Tables Figures
◭ ◮
◭ ◮
Back Close
Full Screen / Esc
Printer-friendly Version
Interactive Discussion
Discussion
P
a
per
|
Discussion
P
a
per
|
Discussion
P
a
per
|
Discussion
P
a
per
|
are available for all those three sites and the higher temporal resolution of the MAAP is better for investigating the point source plume influence.
The model substantially overestimated the EC concentration in Melpitz especially for high episode peaks (Fig. 3a), during which the modelled EC concentration in PM10 can reach up to about 3–4 times higher than that in PM2.5, while the
aver-5
age ratio between EC concentration in PM10 and PM2.5 is only 150 %. Comparing with MAAP measurement, EC in PM10 was on average overestimated by a factor of 2.8 at Melpitz, and by a factor up to 6–10 for the peak periods. This overestimation of EC by model is due to the plume from a point source emission of type SNAP-5 (extraction and distribution fossil fuels, nomenclature described in Visschedijk et al.,
10
2008 and Pouliot et al., 2012) located between Leipzig and Melpitz. Figure 4 is an example snapshot showing the EC plume passing through Melpitz at 05:00 a.m. on 13 September 2013. Plumes from the same sources also similarly influenced other peak periods to different extend. When the plume hitting Melpitz, the overestimation of EC concentration was substantial even when the uncertainties in the modelled
trans-15
portation within 12 km×12 km was accounted for (shaded area in Fig. 3a), and EC
contributed 30–67 % of coarse mode aerosol mass. At the same time, Leipzig was not influenced by point source plume, because of the prevailing westerly wind in do-main D04 (Fig. 4b). The comparison at the Leipzig-TROPOS site is thus much better (Fig. 3b). There, EC is only slightly overestimated by less than 40 %, which may be
20
due to the seasonal variability and/or reducing emissions (∼25 % from 2010 to 2013,
based on long term MAAP measurements in Leipzig-TROPOS and DIGITEL measure-ments in Melpitz) in context of Saxony “low emission zone” policy since March 2011 (http://gis.uba.de/website/umweltzonen/umweltzonen_en.php). The different behaviors of model at these two sites indicate that the coarse mode EC emission in the point
25
sources near Melpitz can be significantly overestimated.
ACPD
15, 31053–31087, 2015Evaluation of size segregation of elemental carbon emission in Europe
Y. Chen et al.
Title Page
Abstract Introduction
Conclusions References
Tables Figures
◭ ◮
◭ ◮
Back Close
Full Screen / Esc
Printer-friendly Version
Interactive Discussion
Discussion
P
a
per
|
Discussion
P
a
per
|
Discussion
P
a
per
|
Discussion
P
a
per
and had a high coarse mode fraction, similar to Melpitz. However, the overestimation of EC was not as significant as for Melpitz, with ∼87 % on average and about 200–
400 % during the peak periods. The fraction of EC in coarse mode was also not as high as in Melpitz. One reason could be the lower intensity of the point source nearby Bösel than the one near Melpitz (Fig. S5 in the Supplement). Another reason may be
5
the artificial dilution of local emissions by the coarser modelling resolution (Genberg et al., 2013), because we only have the highest resolution of 2 km covering the regions around Melpitz (D04), but 6 km resolution for Bösel (D03).
These results imply that the EC point sources in Germany can be overestimated by a factor of 2–10 in the EUCAARI emission inventory, especially for the coarse mode EC
10
emission in the large point sources. To further evaluate the coarse mode EC emission (ECc, EC in PM2.5−10) over the whole Europe, we first checked the emission fraction of ECc to the total EC in EUCAARI inventory. As shown in Fig. 5, this fraction for the sum of area and point sources is generally lower than 10 % over large regions in Western Europe. For almost all of the point sources, the ECc emission fractions are higher than
15
30 % (Fig. S6 in the Supplement), within which there are 3 and 10 point sources around Melpiz and Bösel region, respectively, with ECc emission fractions even higher than 80 % (Table S1 and Fig. S6 in the Supplement). It is worth mentioning that these point sources with high ECc emission fractions also have a very high total EC emission rate. For example, the point source, influencing Melpitz in the morning of 13 September, is
20
the largest point source for SNAP-5 in Germany with a share of about 20 % in the total EC point emission. EC emissions from the SNAP-5 point sources are originated from coal-mining, storage and handling (Visschedijk et al., 2008; Pouliot et al., 2012; Denier et al., 2015), for which a relatively high fraction in coarse mode emission is expected. Therefore, the emission fraction of ECc may be true. But, the total EC emission rate
25
ACPD
15, 31053–31087, 2015Evaluation of size segregation of elemental carbon emission in Europe
Y. Chen et al.
Title Page
Abstract Introduction
Conclusions References
Tables Figures
◭ ◮
◭ ◮
Back Close
Full Screen / Esc
Printer-friendly Version
Interactive Discussion
Discussion
P
a
per
|
Discussion
P
a
per
|
Discussion
P
a
per
|
Discussion
P
a
per
|
3.4 Influence on atmospheric transportation
EC is in general mostly emitted in the fine mode, especially for the area emissions (Echalar et al., 1998; Hitzenberger et al., 2001; Kuenen et al., 2014). Based on the EUCAARI inventory, the average ECc emission fraction for Western Europe is around 5 %, consistent with previous knowledge. But on the contrast to the generally low ECc
5
emission fraction, this fraction is relatively high in Eastern Europe (e.g. Poland, Slo-vakia and Belarus) of about 15–20 %. For Russia (including Kaliningrad in the north of Poland) and Moldova the fraction can reach up to 20–40 %. As shown in the long-term (2003–2011) filter measurement study at Melpitz (Spindler et al., 2013), in the eastern wind dominated period when the air mass came from Eastern Europe and Russia, the
10
EC coarse mode mass fraction was only in the range of 4–15 % (∼10 % in average).
Assuming that EC particles would not change the size during transportation, EUCAARI inventory may overestimate the fraction of ECc about 5–10 % for Eastern Europe and 10–30 % for Russian.
The life-time for fine mode particles is about 5–7 days, but only 1–2 days for the
15
coarse mode aerosol (Jaenicke et al., 1980; Petzold and Kärcher, 2012; Croft et al., 2014). Therefore, the fine mode EC have more time to accumulate in the atmosphere. To evaluate the influence of this high coarse mode EC emission fraction in Eastern Eu-rope on EC’s long-range transportation, we constructed the following concept model. In a steady state, where aerosol sources are continuous and there is a quasi-equilibrium
20
between sources and sinks such that the EC concentration is constant in time. For the same emission rate of EC, the equilibrium mass concentration of fine mode will be 2–3 times higher than coarse mode as described in Eq. (1) (Croft et al., 2014). The deposi-tion rate of EC in coarse mode is also 2–3 times higher than in fine mode, as described in Eq. (2).
25
dC(t)
dt =S(t)− C(t)
ACPD
15, 31053–31087, 2015Evaluation of size segregation of elemental carbon emission in Europe
Y. Chen et al.
Title Page
Abstract Introduction
Conclusions References
Tables Figures
◭ ◮
◭ ◮
Back Close
Full Screen / Esc
Printer-friendly Version
Interactive Discussion
Discussion
P
a
per
|
Discussion
P
a
per
|
Discussion
P
a
per
|
Discussion
P
a
per
whereC(t) is the EC concentration at time t, S(t) is the source rate, and τ(t) is the removal timescale. In the steady state, a quasi-equilibrium between sources and sinks,
τ(t) is defined as lifetime (Croft et al., 2014). Then the deposition rate (sink rate, Ar), with unit of percentage per second, can be defined as:
Ar=As
C =
1
τ (2)
5
Where As is the deposition speed,Cis the steady state EC concentration, andτis the steady state lifetime.
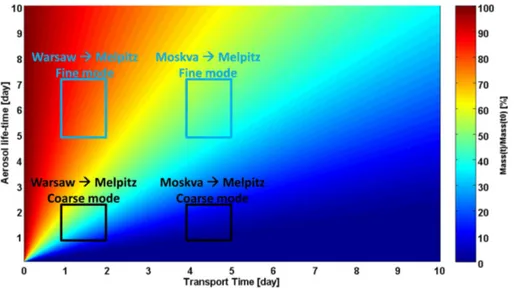
On the other hand, longer lifetime makes fine mode EC having more opportunity to be transported from Eastern Europe to Melpitz. In the following scenario, the particles were emitted instantly into the air mass, which was assumed to be transported by an
10
eastern wind pattern with 5 m s−1 speed. It will take about 4–5 days from Moskva to Melpitz, and 1–2 days from Warsaw Poland. During the transport, only the deposition process was active and described as Eq. (2), without subsequent emission. About 30– 55 % and 65–85 % of fine mode EC can be transported to Melpitz from Moskva and Warsaw Poland respectively, but just 5–20 and 10–60 % for the coarse mode EC can
15
make the same way (Fig. 6).
The overestimation of ECc emission fraction in EUCAARI inventory make less EC could be transported from the Eastern Europe and Russia to Melpitz. This may be one reason of the underestimation of the EC mass concentration in the other studies under eastern wind pattern (Stern et al., 2008; Genberg et al., 2013; Nordmann et al., 2014).
20
Nordmann et al. (2014) reported an underestimation of EC about 50 % during March–April 2009 in Germany, especially for the period when air mass approached the observation sites from eastern directions. And they suspected that the EC emission in Eastern Europe may be underestimated by a factor of 2 to 5. In order to investi-gate the possible influence of the overestimated coarse mode EC emission fraction in
25
ACPD
15, 31053–31087, 2015Evaluation of size segregation of elemental carbon emission in Europe
Y. Chen et al.
Title Page
Abstract Introduction
Conclusions References
Tables Figures
◭ ◮
◭ ◮
Back Close
Full Screen / Esc
Printer-friendly Version
Interactive Discussion
Discussion
P
a
per
|
Discussion
P
a
per
|
Discussion
P
a
per
|
Discussion
P
a
per
|
than 5 % in Eastern Europe (longitude>15◦E). The new simulation and the results of Nordmann et al. (2014) are shown in Table 4. The air mass origin for the high EC con-centration period (4 April 2009, Nordmann et al., 2014) is shown by back trajectories in Fig. 5. The back trajectories were calculated based on the GDAS (with 0.5◦ resolu-tion) dataset with the Hysplit model (http://www.arl.noaa.gov/HYSPLIT_info.php). The
5
underestimation for EC was significantly improved for Bösel and Leipzig-TROPOS. For Bösel, the mean normalized bias (MNB) increased from−21 to 13 % andR2from 0.61
to 0.81; for Leipzig-TROPOS, the MNB increased from −70 to −47 % and R2 from
0.35 to 0.69. The results for Hohenpeißenberg and Zugspitze were not significantly changed, with differences in MNB less than 10 %. This is because the air masses for
10
Bösel and Leipzig-TROPOS were from Eastern Europe passing through Poland, where the ECc emission fraction in EUCAARI inventory is high. But it was not the case for Southeast Europe, where the air mass for Hohenpeißenberg and Zugspitze originated from (Fig. 5). Thus, it indicate that the Nordmann et al. (2014)’s conclusion of under-estimation of EC emission in eastern Europe for 2009 is generally correct, especially
15
for Southeastern Europe (e.g.: Austria, Slovenia, Croatia etc.). However, the overesti-mation of the ECc emission fraction in Eastern Europe (e.g.: Poland, Belarus, Russian etc.) could be another reason for the underestimation of modeled EC mass concentra-tion in the eastern wind pattern, which contributed to the EC concentraconcentra-tion underesti-mation bias about 20–40 %. This is consistent with the result of concept model, which
20
showed the adjustment of ECc emission fraction in Warsaw Poland would make about 25–55 % difference of EC transported to Melpitz.
4 Conclusions
The main goals of this study are the evaluation for EC emission in Europe, including size segregation and point sources. The corresponding influences on transport and
25
ACPD
15, 31053–31087, 2015Evaluation of size segregation of elemental carbon emission in Europe
Y. Chen et al.
Title Page
Abstract Introduction
Conclusions References
Tables Figures
◭ ◮
◭ ◮
Back Close
Full Screen / Esc
Printer-friendly Version
Interactive Discussion
Discussion
P
a
per
|
Discussion
P
a
per
|
Discussion
P
a
per
|
Discussion
P
a
per
for the Melpitz region in eastern Germany. The high resolution EUCAARI inventory of EC emission was applied in the model. The measurements of HOPE-Melpitz Campaign and GUAN network project were used for modelling results validation.
The comparison of particle number/mass size distributions showed that the coarse mode aerosol was substantially overestimated by the model. However, the
meteorol-5
ogy and transport process were well simulated, because of the good agreement with the ground-based and radio-sounding meteorological measurements. These results in-dicated that overestimation of the coarse mode aerosol should mostly come from the uncertainty of emission inventories. The comparisons of EC mass concentrations in Melpitz, Leipzig-TROPOS and Bösel indicated that the EC point sources may be
over-10
estimated by a factor of 2–10, which made a remarkable unrealistic plume in Melpitz. The coarse mode EC emission fraction was substantially overestimated for Eastern Europe (e.g.: Poland, Belarus etc.) and Russia in EUCAARI inventory, with about 10– 30 % for Russia and 5–10 % for the Eastern Europe countries. A concept model was de-signed to interpret the influence of this overestimation on EC long range transportation.
15
Due to the overestimation of ECc emission fraction, EC mass transported from Moskva to Melpitz would decrease about 25–35 % of ECc mass concentration, and decrease about 25–55 % from Warsaw to Melpitz. This is because the coarse mode aerosol has a shorter life-time and therefore less opportunity for being long range transported and accumulated in the atmosphere. The March–April 2009 case (Nordmann et al., 2014)
20
was re-simulated with adjusted ECc emission fraction in Eastern Europe in order to validate the influence on transportation. The result showed that the overestimation of ECc emission fraction in Eastern Europe was one reason of the underestimation of EC in Germany, when the air masses came from eastern direction. It contributed to an underestimation of about 20–40 %.
25
ACPD
15, 31053–31087, 2015Evaluation of size segregation of elemental carbon emission in Europe
Y. Chen et al.
Title Page
Abstract Introduction
Conclusions References
Tables Figures
◭ ◮
◭ ◮
Back Close
Full Screen / Esc
Printer-friendly Version
Interactive Discussion
Discussion
P
a
per
|
Discussion
P
a
per
|
Discussion
P
a
per
|
Discussion
P
a
per
|
Unfortunately, the size segregation information is not included in most of current EC emission inventories, and the size segregation in EUCAARI inventory only covers Eu-rope and is still with high uncertainty. More EC particle size distribution measurements (e.g.: online analysis of SP2, offline analysis of Berner/MOUDI samples, etc.) and long term model simulation studies are needed to further improve the EC emission
invento-5
ries.
The Supplement related to this article is available online at doi:10.5194/acpd-15-31053-2015-supplement.
Acknowledgements. Continuous aerosol measurements at Melpitz were supported by the Ger-man Federal Environment Ministry (BMU) grants F&E 370 343 200 (GerGer-man title: “Erfassung
10
der Zahl feiner und ultrafeiner Partikel in der Außenluft”) and F&E 371 143 232 (German title: “Trendanalysen gesundheitsgefährdender Fein- und Ultrafeinstaubfraktionen unter Nutzung der im German Ultrafine Aerosol Network (GUAN) ermittelten Immissionsdaten durch Fortführung und Interpretation der Messreihen”). The HOPE campaign was funded by the German Re-search Ministry under the project number 01LK1212 C. We would also like to thank Markus
15
Hermann and Sascha Pfeifer for useful suggestions.
References
Barnard, J. C., Chapman, E. G., Fast, J. D., Schemlzer, J. R., Slusser, J. R., and Shetter, R. E.: An evaluation of the FAST-J Photolysis Algorithm for predicting nitrogen dioxide photolysis rates under clear and cloudy sky conditions, Atmos. Environ., 38, 3393–3403, 2004.
20
Binkowski, F. S. and Shankar, U.: The Regional Particulate Matter Model: 1. Model descrip-tion and preliminary results, J. Geophys. Res., 100, 26191–26209, doi:10.1029/95JD02093, 1995.
Birmili, W., Stratmann, F., and Wiedensohler, A.: Design of a DMAbased size spectrometer for a large particle size range and stable operation, J. Aerosol Sci., 30, 549–533, 1999.
ACPD
15, 31053–31087, 2015Evaluation of size segregation of elemental carbon emission in Europe
Y. Chen et al.
Title Page
Abstract Introduction
Conclusions References
Tables Figures
◭ ◮
◭ ◮
Back Close
Full Screen / Esc
Printer-friendly Version
Interactive Discussion
Discussion
P
a
per
|
Discussion
P
a
per
|
Discussion
P
a
per
|
Discussion
P
a
per
Birmili, W., Weinhold, K., Nordmann, S., Wiedensohler, A., Spindler, G., Müller K., Her-rmann, H., Gnauk, T., Pitz, M., Cyrys, J., Flentje, H., Nickel, C., Kuhlbusch, T., Löschau G., Haase, D., Meinhardt, F., Schwerin, A., Ries, L., and Wirtz, K.: Atmospheric aerosol measure-ments in the German Ultrafine Aerosol Network (GUAN) – Part – soot and particle number size distributions, Gefahrst. Reinhalt. L., 69, 137–145, 2009.
5
Bond, T. C., Streets, D. G., Yarber, K. F., Nelson, S. M., Woo, J., and Klimont, Z.: A technology-based global inventory of black and organic carbon emissions from combustion, J. Geophys. Res., 109, D14203, doi:10.1029/2003JD003697, 2004.
Bond, T. C., Bhardwaj, E., Dong, R., Jogani, R., Jung, S., Roden, C., Streets, D. G., and Trautmann, N. M.: Historical emissions of black and organic carbon aerosol
10
from energy-related combustion, 1850–2000, Global Biogeochem. Cy., 21, GB2018, doi:10.1029/2006GB002840, 2007.
Bond, T. C., Doherty, S. J., Fahey, D. W., Forster, P. M., Berntsen, T., DeAngelo, B. J., Flanner, M. G., Ghan, S., Kärcher, B., Koch, D., Kinne, S., Kondo, Y., Quinn, P. K., Sarofim, M. C., Schultz, M. G., Schulz, M., Venkataraman, C., Zhang, H., Zhang, S., Bellouin, N., Guttikunda,
15
S. K., Hopke, P. K., Jacobson, M. Z., Kaiser, J. W., Klimont, Z., Lohmann, U., Schwarz, J. P., Shindell, D., Storelvmo, T., Warren, S. G., and Zender, C. S.: Bounding the role of black carbon in the climate system: a scientific assessment, J. Geophys. Res.-Atmos., 118, 5380– 5552, doi:10.1002/jgrd.50171, 2013.
Brüggemann E. and Spindler, G.: Wet and dry deposition of sulphur at the site Melpitz in East
20
Germany, Water Air Soil Poll., 109, 81–99, 1999.
Chapman, E. G., Gustafson Jr., W. I., Easter, R. C., Barnard, J. C., Ghan, S. J., Pekour, M. S., and Fast, J. D.: Coupling aerosol-cloud-radiative processes in the WRF-Chem model: In-vestigating the radiative impact of elevated point sources, Atmos. Chem. Phys., 9, 945–964, doi:10.5194/acp-9-945-2009, 2009.
25
Croft, B., Pierce, J. R., and Martin, R. V.: Interpreting aerosol lifetimes using the GEOS-Chem model and constraints from radionuclide measurements, Atmos. Chem. Phys., 14, 4313– 4325, doi:10.5194/acp-14-4313-2014, 2014.
Denier van der Gon, H. A. C., Visschedijk, A., Van der Brugh, H., and Dröge, R.: A High Resolution European Emission Database for the Year 2005, a Contribution to the
UBApro-30
ACPD
15, 31053–31087, 2015Evaluation of size segregation of elemental carbon emission in Europe
Y. Chen et al.
Title Page
Abstract Introduction
Conclusions References
Tables Figures
◭ ◮
◭ ◮
Back Close
Full Screen / Esc
Printer-friendly Version
Interactive Discussion
Discussion
P
a
per
|
Discussion
P
a
per
|
Discussion
P
a
per
|
Discussion
P
a
per
|
Denier van der Gon, H. A. C., Bergström, R., Fountoukis, C., Johansson, C., Pandis, S. N., Simpson, D., and Visschedijk, A. J. H.: Particulate emissions from residential wood combus-tion in Europe – revised estimates and an evaluacombus-tion, Atmos. Chem. Phys., 15, 6503–6519, doi:10.5194/acp-15-6503-2015, 2015.
Easter, R. C., Ghan, S. J., Zhang, Y., Saylor, R. D., Chapman, E. G., Laulainen, N. S.,
5
Abdul-Razzak, H., Leung, L. R., Bian, X., and Zaveri, R. A.: MIRAGE: model de-scription and evaluation of aerosols and trace gases, J. Geophys. Res., 109, D20210, doi:10.1029/2004JD004571, 2004.
Echalar, F., Artaxo, P., Martins, J. V., Yamasoe, M., Gerab, F., Maenhaut, W., and Holben, B.: Long-term monitoring of atmospheric aerosols in the Amazon Basin: source identification
10
and apportionment, J. Geophys. Res.-Atmos., 103, 31849–31864, 1998.
EEA: (European Environment Agency): European Union Emission Inventory Report 1990–2011 Under the UNECE Convention on Long-range Transboundary Air Pollution (LRTAP), EEA Technical report No. 10/2013, Copenhagen, doi:10.2800/44480, 2013.
Fast, J. D., Gustafson Jr., W. I., Easter, R. C., Zaveri, R. A., Barnard, J. C., Chapman, E. G.,
15
Grell, G. A., and Peckham, S. E.: Evolution of ozone, particulates, and aerosol direct radia-tive forcing in the vicinity of Houston using a fully coupled meteorology-chemistry-aerosol model, J. Geophys. Res., 111, D21305, doi:10.1029/2005JD006721, 2006.
Genberg, J., Denier van der Gon, H. A. C., Simpson, D., Swietlicki, E., Areskoug, H., Bed-dows, D., Ceburnis, D., Fiebig, M., Hansson, H. C., Harrison, R. M., Jennings, S. G.,
20
Saarikoski, S., Spindler, G., Visschedijk, A. J. H., Wiedensohler, A., Yttri, K. E., and Bergström, R.: Light-absorbing carbon in Europe – measurement and modelling, with a focus on residential wood combustion emissions, Atmos. Chem. Phys., 13, 8719–8738, doi:10.5194/acp-13-8719-2013, 2013.
Grell, G. A., Peckham, S. E., Schmitz, R., McKeen, S. A., Frost, G., Skamarock, W. C., and Eder,
25
B.:: Fully coupled “online” chemistry within the WRF model, Atmos. Environ., 39, 6957–6975, 2005.
Guenther, A., Karl, T., Harley, P., Wiedinmyer, C., Palmer, P. I., and Geron, C.: Estimates of global terrestrial isoprene emissions using MEGAN (Model of Emissions of Gases and Aerosols from Nature), Atmos. Chem. Phys., 6, 3181–3210, doi:10.5194/acp-6-3181-2006,
30
2006.
ACPD
15, 31053–31087, 2015Evaluation of size segregation of elemental carbon emission in Europe
Y. Chen et al.
Title Page
Abstract Introduction
Conclusions References
Tables Figures
◭ ◮
◭ ◮
Back Close
Full Screen / Esc
Printer-friendly Version
Interactive Discussion
Discussion
P
a
per
|
Discussion
P
a
per
|
Discussion
P
a
per
|
Discussion
P
a
per
Heintzenberg, J., Müller, K., Birmili, W., Spindler, G., and Wiedensohler, A.: Mass-related aerosol properties over the Leipzig Basin, J. Geophys. Res.-Atmos., 103, 13125–13135, 1998.
Hitzenberger. R. and Tohno, S.: Comparison of black carbon (BC) aerosols in two urban areas – concentrations and size distributions, Atmos. Environ., 35, 2153–2167, 2001.
5
IPCC A R.: Climate Change 2013: The Physical Science Basis, Contribution of Working Group I to the Fifth Assessment Report of the Intergovernmental Panel on Climate Change, Report, Cambridge University Press, New York, 2013.
Jacobson, M. Z.: A physically-based treatment of elemental carbon optics: impli-cations for global direct forcing of aerosols, Geophys. Res. Lett., 27, 217–220,
10
doi:10.1029/1999GL010968, 2000.
Jaenicke, R.: Atmospheric aerosols and global climate, J. Aerosol Sci., 11, 577–588, 1980. Junker, C. and Liousse, C.: A global emission inventory of carbonaceous aerosol from historic
records of fossil fuel and biofuel consumption for the period 1860–1997, Atmos. Chem. Phys., 8, 1195–1207, doi:10.5194/acp-8-1195-2008, 2008.
15
Koch, D., Schulz, M., Kinne, S., McNaughton, C., Spackman, J. R., Balkanski, Y., Bauer, S., Berntsen, T., Bond, T. C., Boucher, O., Chin, M., Clarke, A., De Luca, N., Dentener, F., Diehl, T., Dubovik, O., Easter, R., Fahey, D. W., Feichter, J., Fillmore, D., Freitag, S., Ghan, S., Ginoux, P., Gong, S., Horowitz, L., Iversen, T., Kirkevåg, A., Klimont, Z., Kondo, Y., Krol, M., Liu, X., Miller, R., Montanaro, V., Moteki, N., Myhre, G., Penner, J. E., Perlwitz, J., Pitari, G.,
20
Reddy, S., Sahu, L., Sakamoto, H., Schuster, G., Schwarz, J. P., Seland, Ø., Stier, P., Takegawa, N., Takemura, T., Textor, C., van Aardenne, J. A., and Zhao, Y.: Evaluation of black carbon estimations in global aerosol models, Atmos. Chem. Phys., 9, 9001–9026, doi:10.5194/acp-9-9001-2009, 2009.
Kuenen, J. J. P., Visschedijk, A. J. H., Jozwicka, M., and Denier van der Gon, H. A. C.:
25
TNO-MACC_II emission inventory; a multi-year (2003–2009) consistent high-resolution Eu-ropean emission inventory for air quality modelling, Atmos. Chem. Phys., 14, 10963–10976, doi:10.5194/acp-14-10963-2014, 2014.
Kulmala, M., Asmi, A., Lappalainen, H. K., Baltensperger, U., Brenguier, J.-L., Facchini, M. C., Hansson, H.-C., Hov, Ø., O’Dowd, C. D., Pöschl, U., Wiedensohler, A., Boers, R., Boucher, O.,
30
ACPD
15, 31053–31087, 2015Evaluation of size segregation of elemental carbon emission in Europe
Y. Chen et al.
Title Page
Abstract Introduction
Conclusions References
Tables Figures
◭ ◮
◭ ◮
Back Close
Full Screen / Esc
Printer-friendly Version
Interactive Discussion
Discussion
P
a
per
|
Discussion
P
a
per
|
Discussion
P
a
per
|
Discussion
P
a
per
|
Beddows, D. C. S., Bergström, R., Beukes, J. P., Bilde, M., Burkhart, J. F., Canonaco, F., Clegg, S. L., Coe, H., Crumeyrolle, S., D’Anna, B., Decesari, S., Gilardoni, S., Fischer, M., Fjaeraa, A. M., Fountoukis, C., George, C., Gomes, L., Halloran, P., Hamburger, T., Har-rison, R. M., Herrmann, H., Hoffmann, T., Hoose, C., Hu, M., Hyvärinen, A., Hõrrak, U., Iinuma, Y., Iversen, T., Josipovic, M., Kanakidou, M., Kiendler-Scharr, A., Kirkevåg, A.,
5
Kiss, G., Klimont, Z., Kolmonen, P., Komppula, M., Kristjánsson, J.-E., Laakso, L., Laakso-nen, A., Labonnote, L., Lanz, V. A., LehtiLaakso-nen, K. E. J., Rizzo, L. V., MakkoLaakso-nen, R., Man-ninen, H. E., McMeeking, G., Merikanto, J., Minikin, A., Mirme, S., Morgan, W. T., Ne-mitz, E., O’Donnell, D., Panwar, T. S., Pawlowska, H., Petzold, A., Pienaar, J. J., Pio, C., Plass-Duelmer, C., Prévôt, A. S. H., Pryor, S., Reddington, C. L., Roberts, G., Rosenfeld, D.,
10
Schwarz, J., Seland, Ø., Sellegri, K., Shen, X. J., Shiraiwa, M., Siebert, H., Sierau, B., Simp-son, D., Sun, J. Y., Topping, D., Tunved, P., Vaattovaara, P., Vakkari, V., Veefkind, J. P., Viss-chedijk, A., Vuollekoski, H., Vuolo, R., Wehner, B., Wildt, J., Woodward, S., Worsnop, D. R., van Zadelhoff, G.-J., Zardini, A. A., Zhang, K., van Zyl, P. G., Kerminen, V.-M., S Carslaw, K., and Pandis, S. N.: General overview: European Integrated project on Aerosol Cloud Climate
15
and Air Quality interactions (EUCAARI) – integrating aerosol research from nano to global scales, Atmos. Chem. Phys., 11, 13061–13143, doi:10.5194/acp-11-13061-2011, 2011. Lamarque, J.-F., Bond, T. C., Eyring, V., Granier, C., Heil, A., Klimont, Z., Lee, D., Liousse, C.,
Mieville, A., Owen, B., Schultz, M. G., Shindell, D., Smith, S. J., Stehfest, E., Van Aar-denne, J., Cooper, O. R., Kainuma, M., Mahowald, N., McConnell, J. R., Naik, V., Riahi, K.,
20
and van Vuuren, D. P.: Historical (1850–2000) gridded anthropogenic and biomass burn-ing emissions of reactive gases and aerosols: methodology and application, Atmos. Chem. Phys., 10, 7017–7039, doi:10.5194/acp-10-7017-2010, 2010.
Mareckova, K., Wankmueller, R., Moosmann, L., and Pinterits, M.: Inventory Review 2013: Re-view of Emission Data reported under the LRTAP Convention and NEC Directive, Stage 1
25
and 2 review, Status of Gridded Data and LPS Data, STATUS Report 1/2013, Umweltbunde-samt GmbH, Vienna, Austria, 2013.
McConnell, J. R., Edwards, R., Kok, G. L., Flanner, M. G., Zender, C. S., Saltzman, E. S., Banta, J. R., Pasteris, D. R., Carter, M. M., and Kahl, J. D. W.: 20th-century industrial black carbon emissions altered arctic climate forcing, Science, 317, 1381–1384, 2007.
30
ACPD
15, 31053–31087, 2015Evaluation of size segregation of elemental carbon emission in Europe
Y. Chen et al.
Title Page
Abstract Introduction
Conclusions References
Tables Figures
◭ ◮
◭ ◮
Back Close
Full Screen / Esc
Printer-friendly Version
Interactive Discussion
Discussion
P
a
per
|
Discussion
P
a
per
|
Discussion
P
a
per
|
Discussion
P
a
per
Ming, J., Cachier, H., Xiao, C., Qin, D., Kang, S., Hou, S., and Xu, J.: Black carbon record based on a shallow Himalayan ice core and its climatic implications, Atmos. Chem. Phys., 8, 1343–1352, doi:10.5194/acp-8-1343-2008, 2008.
Nordmann, S., Birmili, W., Weinhold, K., Müller, K., Spindler, G., and Wiedensohler, A.: Mea-surements of the mass absorption cross section of atmospheric soot particles using Raman
5
spectroscopy, J. Geophys. Res.-Atmos., 118, 12075–12085, doi:10.1002/2013JD020021, 2013.
Nordmann, S., Cheng, Y. F., Carmichael, G. R., Yu, M., Denier van der Gon, H. A. C., Zhang, Q., Saide, P. E., Pöschl, U., Su, H., Birmili, W., and Wiedensohler, A.: Atmospheric black carbon and warming effects influenced by the source and absorption enhancement in central
Eu-10
rope, Atmos. Chem. Phys., 14, 12683–12699, doi:10.5194/acp-14-12683-2014, 2014. Petzold, A. and Kärcher, B.: Aerosols in the Atmosphere, in: Atmospheric Physics, edited
by: Schumann, U., Research Topics in Aerospace, Springer Berlin Heidelberg, 37–53, doi:10.1007/978-3-642-30183-4_3, 2012.
Pouliot, G., Pierce, T., van der Gon, H., Schaap, M., Moran, M., and Nopmongcol, U.::
Com-15
paring emission inventories and model-ready emission datasets between Europe and North America for the AQMEII project, Atmos. Environ., 53, 4–14, 2012.
Pope, C. A., Ezzati, M., and Dockery, D. W.: Fine-particulate air pollution and life expectancy in the united states, N. Engl. J. Med., 360, 376–386, 2009.
Poulain, L., Spindler, G., Birmili, W., Plass-Dülmer, C., Wiedensohler, A., and Herrmann, H.:
20
Seasonal and diurnal variations of particulate nitrate and organic matter at the IfT research station Melpitz, Atmos. Chem. Phys., 11, 12579–12599, doi:10.5194/acp-11-12579-2011, 2011.
Ramanathan, V. and Carmichael, G.: Global and regional climate changes due to black carbon, Nat. Geosci., 1, 221–227, 2008.
25
Rose, D., Wehner, B., Ketzel, M., Engler, C., Voigtländer, J., Tuch, T., and Wiedensohler, A.: Atmospheric number size distributions of soot particles and estimation of emission factors, Atmos. Chem. Phys., 6, 1021–1031, doi:10.5194/acp-6-1021-2006, 2006.
Saide, P. E., Spak, S. N., Carmichael, G. R., Mena-Carrasco, M. A., Yang, Q., Howell, S., Leon, D. C., Snider, J. R., Bandy, A. R., Collett, J. L., Benedict, K. B., de Szoeke, S. P.,
30
ACPD
15, 31053–31087, 2015Evaluation of size segregation of elemental carbon emission in Europe
Y. Chen et al.
Title Page
Abstract Introduction
Conclusions References
Tables Figures
◭ ◮
◭ ◮
Back Close
Full Screen / Esc
Printer-friendly Version
Interactive Discussion
Discussion
P
a
per
|
Discussion
P
a
per
|
Discussion
P
a
per
|
Discussion
P
a
per
|
Spindler, G., Brüggemann E., Gnauk, T., Grüner A., Müller K., and Herrmann, H.: A four-year size-segregated characterization study of particles PM10, PM2.5and PM1depending on air
mass origin at Melpitz, Atmos. Environ., 44, 164–173, 2010.
Spindler, G., Gnauk, T., Grüner, A., Iinuma, Y., Müller, K., Scheinhardt, S., and Herrmann, H.: Size-segregated characterization of PM10at the EMEP site Melpitz (Germany) using a
five-5
stage impactor: a 6 year study, J. Atmos. Chem., 69, 127–157, 2012.
Spindler, G., Grüner, A., Müller, K., Schlimper, S., and Herrmann, H.: Long-term size-segregated particle (PM10, PM2.5, PM1) characterization study at Melpitz – influence
of air mass inflow, weather conditions and season, J. Atmos. Chem., 70, 165–195, doi:10.1007/s10874-013-9263-8, 2013.
10
Stern, R., Builtjes, P., Schaap, M., Timmermans, R., Vautard, R., Hodzic, A., Memmesheimer, M., Feldmann, H., Renner, E., Wolke, R., and Kerschbaumer: a model inter-comparison study focussing on episodes with elevated PM10 concentrations, Atmos.
Environ., 42, 4567–4588, doi:10.1016/j.atmosenv.2008.01.068, 2008.
Vignati, E., Karl, M., Krol, M., Wilson, J., Stier, P., and Cavalli, F.: Sources of
uncertain-15
ties in modelling black carbon at the global scale, Atmos. Chem. Phys., 10, 2595–2611, doi:10.5194/acp-10-2595-2010, 2010.
Visschedijk, A. and Denier van der Gon, H.: EUCAARI Deliverable: Pan-European Carbona-ceous Aerosol Inventory, Report, TNO Built Environment and Geosciences, D42, Utrecht, the Netherlands, 2008.
20
Wiedinmyer, C., Akagi, S. K., Yokelson, R. J., Emmons, L. K., Al-Saadi, J. A., Orlando, J. J., and Soja, A. J.: The Fire INventory from NCAR (FINN): a high resolution global model to estimate the emissions from open burning, Geosci. Model Dev., 4, 625–641, doi:10.5194/gmd-4-625-2011, 2011.
Wild, O., Zhu, X., and Prather, M. J.: Fast-J: accurate simulation of in- and below-cloud
photol-25
ysis in tropospheric chemical models, J. Atmos. Chem., 37, 245–282, 2000.
Zhang, Y., Sartelet, K., Zhu, S., Wang, W., Wu, S.-Y., Zhang, X., Wang, K., Tran, P., Seigneur, C., and Wang, Z.-F.: Application of WRF/Chem-MADRID and WRF/Polyphemus in Europe – Part 2: Evaluation of chemical concentrations and sensitivity simulations, Atmos. Chem. Phys., 13, 6845–6875, doi:10.5194/acp-13-6845-2013, 2013.
30
ACPD
15, 31053–31087, 2015Evaluation of size segregation of elemental carbon emission in Europe
Y. Chen et al.
Title Page
Abstract Introduction
Conclusions References
Tables Figures
◭ ◮
◭ ◮
Back Close
Full Screen / Esc
Printer-friendly Version
Interactive Discussion
Discussion
P
a
per
|
Discussion
P
a
per
|
Discussion
P
a
per
|
Discussion
P
a
per
|
Table 1.Sectional approach for aerosols: particle dry-diameter ranges used in this study.
Bin 01 Bin 02 Bin 03 Bin 04 Bin 05 Bin 06 Bin 07 Bin 08
ACPD
15, 31053–31087, 2015Evaluation of size segregation of elemental carbon emission in Europe
Y. Chen et al.
Title Page
Abstract Introduction
Conclusions References
Tables Figures
◭ ◮
◭ ◮
Back Close
Full Screen / Esc
Printer-friendly Version
Interactive Discussion
Discussion
P
a
per
|
Discussion
P
a
per
|
Discussion
P
a
per
|
Discussion
P
a
per
Table 2.Configurations of WRF-Chem.
Physics WRF option
Micro physics Lin et. al. (1983) scheme
Surface Rapid Update Cycle (RUC) land surface model Boundary layer YSU (Hong et. al., 2006)
Cumulus Grell 3-D Urban 3-category UCM
Shortwave radiation Goddard shortwave (Chou et. al., 1998) Longwave radiation New Goddard scheme
Chemistry and Aerosol Chem option
Gas-phase mechanism CBMZ
ACPD
15, 31053–31087, 2015Evaluation of size segregation of elemental carbon emission in Europe
Y. Chen et al.
Title Page
Abstract Introduction
Conclusions References
Tables Figures
◭ ◮
◭ ◮
Back Close
Full Screen / Esc
Printer-friendly Version
Interactive Discussion
Discussion
P
a
per
|
Discussion
P
a
per
|
Discussion
P
a
per
|
Discussion
P
a
per
|
Table 3.Comparison result for meteorological variables between Melpitz radio-sounding mea-surements and WRF-Chem model.
Slope R2 Data point Number
ACPD
15, 31053–31087, 2015Evaluation of size segregation of elemental carbon emission in Europe
Y. Chen et al.
Title Page
Abstract Introduction
Conclusions References
Tables Figures
◭ ◮
◭ ◮
Back Close
Full Screen / Esc
Printer-friendly Version
Interactive Discussion
Discussion
P
a
per
|
Discussion
P
a
per
|
Discussion
P
a
per
|
Discussion
P
a
per
Table 4.Comparison between the adjusted EC coarse emission simulation and original one.
Adjusted EC coarse fraction Original (Nordmann et. al., 2014)
Sites MB MNB R2 MB MNB R2 Air mass
Bösel 0.12 0.13 0.81 −0.31 −0.21 0.61 East
ACPD
15, 31053–31087, 2015Evaluation of size segregation of elemental carbon emission in Europe
Y. Chen et al.
Title Page
Abstract Introduction
Conclusions References
Tables Figures
◭ ◮
◭ ◮
Back Close
Full Screen / Esc
Printer-friendly Version
Interactive Discussion
Discussion
P
a
per
|
Discussion
P
a
per
|
Discussion
P
a
per
|
Discussion
P
a
per
|
Figure 1.EUCARRI (resolution 7 km) EC emission (kg m−2year−1). The 4 nested model
ACPD
15, 31053–31087, 2015Evaluation of size segregation of elemental carbon emission in Europe
Y. Chen et al.
Title Page
Abstract Introduction
Conclusions References
Tables Figures
◭ ◮
◭ ◮
Back Close
Full Screen / Esc
Printer-friendly Version
Interactive Discussion
Discussion
P
a
per
|
Discussion
P
a
per
|
Discussion
P
a
per
|
Discussion
P
a
per
|
Figure 3.The comparison ofr EC/BC concentration between model and MAAP measurements. Red line: EC concentration in PM10 of model result; blue line: EC concentration in PM2.5 of
model result; black line: BC concentration in PM10of MAAP measurement, used as the best
ACPD
15, 31053–31087, 2015Evaluation of size segregation of elemental carbon emission in Europe
Y. Chen et al.
Title Page
Abstract Introduction
Conclusions References
Tables Figures
◭ ◮
◭ ◮
Back Close
Full Screen / Esc
Printer-friendly Version
Interactive Discussion
Discussion
P
a
per
|
Discussion
P
a
per
|
Discussion
P
a
per
|
Discussion
P
a
per
Figure 4. The model result: (a) aerosol chemistry compounds for each bins of Melpitz; (b)