Computational fluid dynamics simulation was employed in a hydraulic turbine (from inlet tube to draft tube). The calcu-lated turbine efficiencies were compared with measured results, and the relative error is 1.12%. In order to improve the efficiency of the hydraulic turbine, 15 kinds of vortex generators were installed at the vortex development section of the draft tube, and all of them were simulated using the same method. Based on the turbine efficiencies, distribution of streamlines, velocities, and pressures in the draft tube, an optimal draft tube was found, which can increase the efficiency of this hydraulic turbine more than 1.5%. The efficiency of turbine with the optimal draft tube, draft tube with four pairs of middle-sized vortex generator, and draft tube without vortex generator under different heads of turbine (5–14 m) was calculated, and it was verified that these two kinds of draft tubes can increase the efficiency of this turbine in every situation.
Keywords
Computational fluid dynamics, turbine efficiency, vortex generators, draft tube
Date received: 9 January 2015; accepted: 24 May 2015
Academic Editor: Pietro Scandura
Introduction
The draft tube, which is one of the most important parts of turbine,1–3is utilized to convert dynamic pres-sure of outgoing fluid to static prespres-sure in turbine. There are lots of studies on draft tube optimization.4–6 The aims are to increase static pressure recovery coeffi-cient (SPRC) and reduce the loss coefficoeffi-cient3 or to improve the stability. The common way is decreasing innate helical vortex ropes in the draft tube3,7because the vortexes in the draft tube will lead to unsteady pres-sure pulsations. They will affect the flow near runner and may cause severe damage to the machine,8 espe-cially for turbine deviation from the optimal working condition. Actually, hydro-turbines always work at partial load operation conditions.
For these purposes, vortex generator (VG), which can control flow separation,9 was used in the draft
tube.10Although the draft tube with VG has been stud-ied, there was no detailed analysis for a real hydro-turbine.11
In this study, to explore when, where and how to use VG in a draft tube, a real hydraulic turbine was studied by the method of computational fluid dynamics (CFD).12–14 Full-ported structured grids of every part of turbine passage were built up. Commercial software
1School of Mechanical Engineering, Hangzhou Dianzi University,
Hangzhou, P.R. China
2College of Water Conservancy and Hydropower Engineering, Hohai
University, Nanjing, P.R. China
Corresponding author:
Huachen Pan, School of Mechanical Engineering, Hangzhou Dianzi University, Hangzhou, P.R. China.
Email: [email protected]
was used to investigate many VG layout options in the draft tube, and an optimal draft tube was found.
Method
Geometric model and structured grids
Hydraulic turbine used in this study was provided by Water Pumps Company in Finland. There are four main parts in this turbine (Figure 1). Part B contains 11 guide vanes, while 6 runner blades in part C. All of these vanes and blades were evenly distributed around central axis (x-axis) of the turbine.
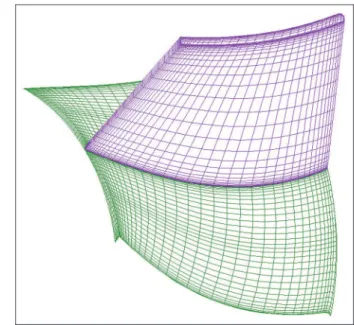
Figure 1 shows the structure of the hydro-turbine where A is the inlet tube, B is the guide vane’s ring, C is the runner, and D is the draft tube. A Fortran program has been made to facilitate the generation of structured grids of blade passage. The program can automatically give optimized blade-to-blade and hub-to-shroud mesh distributions, so that the shape of mesh lines are close to that of streamlines, and the mesh is finer near the wall than in the middle of the passage to satisfy y-plus requirement. To make sure all the wall cells y-plus in a good range (y-plus 100),15the thicknesses of the first cell from the wall were set as 0.2 mm. The value of y-plus was [0, 81.2]. The guide vane’s grids and runner blade’s grids are shown in Figures 2 and 3, respectively, and the structure grids of the inlet tube, draft tube, guide vanes, and runner are shown in Figure 4.
Because the flow through a blade or vane passage is rotationally periodical, only one passage is needed for computation if a ‘‘stage’’16type of interface is used for connecting moving and nonmoving parts. The guide vane is basically a nonmoving part. But we can artifi-cially define the guide vane’s grid as a moving grid by slowly rotating at the smallest speed unit (1 r min21
) in ANSYS 11.0. Compared with angular velocity of run-ner (500 rad min21
), the error can be ignored. In this way, only one guide vane’s passage is needed for computation.
The VGs used in this study were pairs of square tri-angle fins. The sizes of these fins were 70 mm 330 mm (small size), 145 mm355 mm (middle size), and Figure 1. Hydraulic turbine.
A: inlet tube; B: guide vanes; C: runner; D: draft tube. The arrow line means water flow direction.
Figure 2. Structure grids of every guide vane.
Figure 3. Structure grids of every blade.
1.833106cells. When the cell number is increased to 3.663106, the turbine efficiency difference is 0.52%, while the grid number is decreased to 9.153105, the turbine efficiency difference is 3.71%. Therefore, the grid size used in this study was suitable. Besides, all val-ues of y-plus were below 100, ensuring the quality of the wall treatment in the flow simulations.
Numerical simulations
Hydraulic turbine efficiency19can be expressed as
h=
M3v
rgHQ ð
1Þ
wherehis the turbine efficiency,Mis the torque of the
runner (N m),v is the angular velocity of the runner
(rad s21
),His the head of the turbine (m), andQis the volume flow of the turbine (m3s21
).
SPRC is a very important parameter of draft tube,20 which can be defined as
hW=
PexPen 1
2r v2env2ex
ð2Þ
wherehW is the SPRC;Pandvare the section average
pressure (Pa) and velocity (m s21
), respectively;ris the
density of pipe water (kg m23
); and the subscripts ‘‘en’’
iodicity (RP) and general connection (GC) in CFX11.0 were used for interface between guide vanes and run-ners. The interface between VGs was installed on one part and on the other part of the draft tube was the sta-tionary domain.
The designed head of the turbine was 11 m, and angular velocity of the runner was 500 rad min21
. In CFD simulations, usually the flow rate is a given boundary condition. So, we have to assume a flow rate to obtain water head. In this article, we supposed volume flow was from 2.0 to 3.2 m3 s21
(Table 1). Lagrange interpolation method was used to search volume flow for any turbine head. It was found that when turbine head is 11 m, the volume flow was 2.941 m3s21
in the turbine system without VG. From Gridgen 15.18, the grids angle of the original draft tube and draft tube with VG were (71.4, 99.3) and (17.2, 99.3), respectively. Relative pressure at outlet was set as 0 Pa, and the reference pressure of the water flow was 1 atm. All the other boundaries were defined as nonslip walls. The root mean square (RMS) residual error in iteration convergence checking was set as 1024
.
Results and discussion
The head of turbine varies in different seasons in the range of 5–14 m. While the corresponding flow rate is
Table 1. Turbine head in different volume flows.
Volume flow (m3s21) 2.4 2.5 2.6 2.7 2.8 2.9 2.941 3.0 3.1 3.2
Re (106) 7.41 7.62 7.41 7.88 8.54 8.93 9.12 9.36 9.80 10.30
Turbine head (m) 4.99 5.97 7.03 8.11 9.21 10.34 11.00 11.50 12.69 13.93
Table 2. Turbine efficiency and SPRC of the draft tube without VG in different situations.
Q(m3s21) 2.4 2.5 2.6 2.7 2.8 2.9 2.941 3.0 3.1 3.2
h(%) 76.1 79.52 80.83 81.4 81.55 81.3 81.06 80.73 79.9 78.9
SPRC 82.4 83.1 83.4 85.6 89.3 87.8 88.1 86.6 84.9 82.7
in the range of 2.4–3.2 m3 s21
. Table 2 shows the tur-bine efficiency and SPRC of the draft tube without VG in different flow conditions.
In Table 2, we can see that the maximum turbine efficiency (81.55%) and SPRC (89.3%) were achieved when mass flow was 2.8 m3s21
, and the measured effi-ciency was 81.0%. When mass flow was 2.941 m3 s21
, the water head reached the designed value (11 m), and the turbine efficiency and SPRC of the draft tube were 81.06% and 88.06%, respectively. The calculated effi-ciency was consistent with the measured result (80.7%).
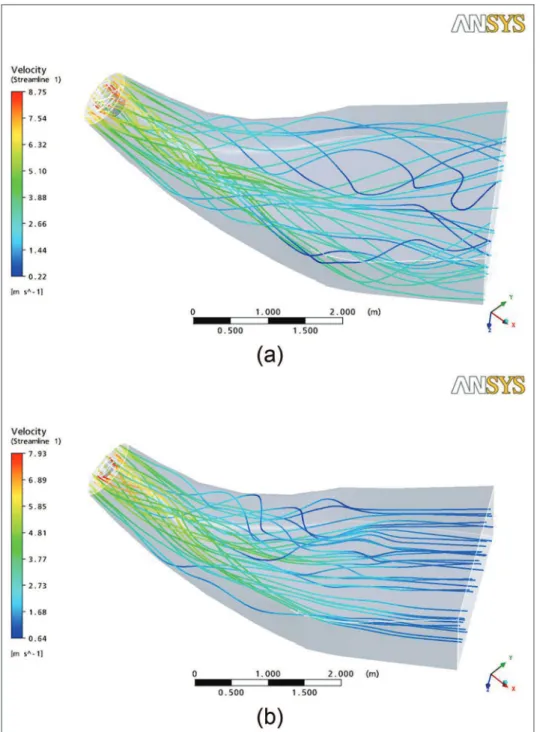
The streamline distribution in the draft tube without VG can be seen in Figure 5(a).
A total of 2, 4, 6, 9, and 12 pairs of small-sized, mid-dle-sized, and big-sized VGs were installed in the draft tube at the designed head. Because the pressure and velocity differences between inlet and outlet were quite small, and during iteration, the pressure and velocity of inlet and outlet section were altering, SPRC of the draft tube was very sensitive. Turbine efficiency was used as an indicator. Their values in these situations were cal-culated separately (Table 3).
Compared with the draft tube without VG, turbine efficiency increased when six pairs of small- and middle-sized VGs and four pairs of middle-sized VGs were installed. According to Table 3, it was also found that when the draft tube was installed with six pairs of middle-sized VGs, we obtained the highest turbine effi-ciency, which is 82.64%, a 1.58% increase, compared with the turbine without VGs. The optimal SPRC of the draft tube using VGs is 92.43%, which is a 4.37% increase compared with the original draft tube. The
water flow in the optimal draft tube can be seen in Figure 5(b).
When the draft tube with small-sized VG was used, no matter how many VGs were installed, the turbine efficiency was nearly the same as the draft tube without VG. But when big-sized VGs were installed in the draft tube, turbine efficiency declined. However, it was found that the turbine efficiency improved, when four and six pairs of middle-sized VGs were installed in the draft tube.
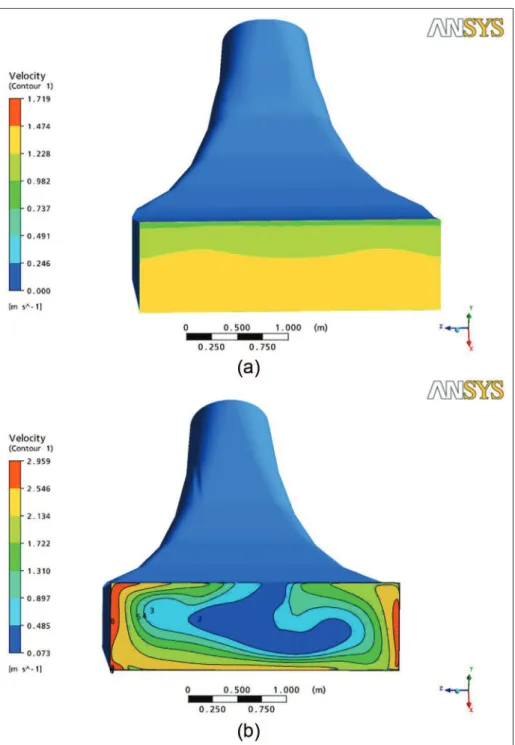
Comparing Figure 5(a) with Figure 5(b), it is appar-ent that the flow near the wall has been changed. The flow separation, backflows, and vortices were reduced in the optimal draft tube. Especially, after the elbow of the draft tube, the streamline is quite smooth and even. We can see from the color scale (Figure 6) that the out-let velocity is mostly less than 2 m s21
for the draft tube with VGs, while the outlet velocity is much higher in the draft tube without VGs. Therefore, outlet kinetic energy of the optimal draft tube is much lower than the draft tube without VG.
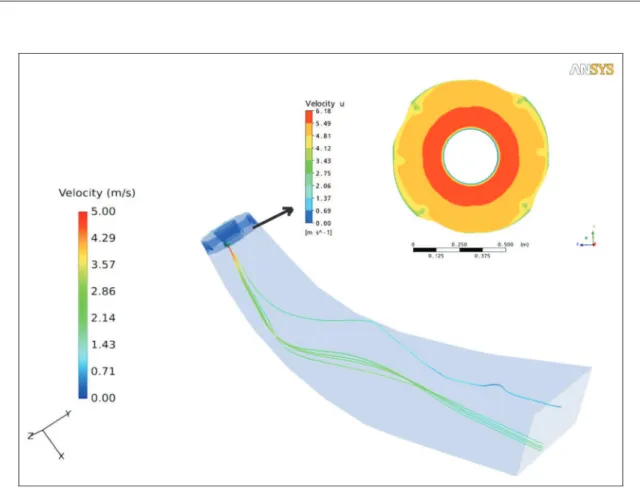
The wall pressure field in the optimal draft tube is much more uniform than that in the draft tube without VG. Also, the pressure distribution in the whole opti-mal draft tube is much smoother than that of the origi-nal draft tube. It can be seen from Figure 7 that VG can generate small streamwise vortexes along the wall. In that way, they help to suppress the wall boundary separation, improving the cross-sectional flow
uniformity. Therefore, VGs can break down some heli-cal vortexes in the draft tube without VGs.
Previous discussions are all for the case with 11-m turbine head. Since in reality, turbine heads vary with different seasons in the range of 5–14 m, it is necessary to calculate the flows of turbines with the optimal draft tube and original draft tube using different turbine heads. The results are shown in Figure 8.
Compared with the hydraulic turbine with the origi-nal draft tube, the efficiency of turbine with the optimal draft tube increased in every situation, and the rate of increase was around 1.5%, while the SPRC of the opti-mal draft tube was also accreted about 4.0%.
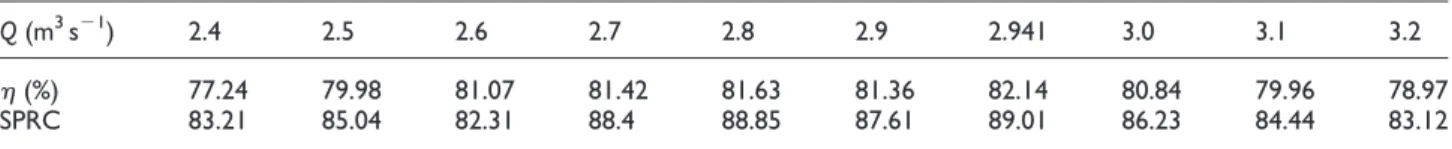
Turbine efficiency and SPRC of the draft tube with four pairs of middle-sized VGs in different situations can be seen from Table 4. Comparing Table 4 with Table 2, it is apparent that the efficiency and SPRC of turbine with the new draft tube improved in every situ-ation, although the amplification is small.
Table 3. Turbine efficiency (%) in different situations.
2 pairs 4 pairs 6 pairs 9 pairs 12 pairs
Small size 81.07 80.08 81.11 81.07 81.03
Middle size 81.06 82.14 82.64 80.96 80.89
Big size 80.93 80.07 81.00 80.93 80.81
Conclusion
The efficiency of turbine with the original draft tube is simulated by CFD, and the turbine efficiency has been compared with the field measurement results obtained from the company. The calculated results show a very good agreement with the measured value (the relative error is 1.12%).
This method is applied to the same draft tube with 15 different kinds of VGs. An optimal draft tube was found. According to the simulation results, the follow-ing conclusions can be drawn:
1. VG can generate some vortexes along the wall in water fluid. Its size has a strong effect on the size of its induced streamwise vortexes, while the distance between VG fins has an effect on vortexes strength. If the size of VGs is small, their influences on water flow can be neglected. If the size of VGs is too big, they will produce too much disturbances in the flow, causing more harm than benefits.
2. When the draft tube was installed with suitable VGs, the turbine efficiency increased by 1.58% with the optimal draft tube. The SPRC of the optimal draft tube increased by 4.37% com-pared with the draft tube without VG. In the other head of turbine range, the increase in tur-bine efficiency was at least 1.5% in all heads of turbine conditions (5–14 m).
Acknowledgements
Chinese ‘‘211 project’’ innovative talent training plan supports the first author studying abroad, where this manuscript was competed. Water Pumps Company (Finland) provided the size of hydraulic turbine and the turbine efficiency.
Declaration of conflicting interests
The authors declare that there is no conflict of interests regarding the publication of this article. All of the authors have a good co-operation in this study and also have a good collaboration in finishing this article.
Funding
This research was supported by China NSFC (the National Natural Science Foundation of China) funding 51120195001, 41076055, as well as Zhejiang provincial funding 2012C34G204006 and Zhejiang Open Foundation of the Most Important Subjects.
References
1. Shojaeefard MH, Mirzaei A and Babaei A. Shape opti-mization of draft tubes for Agnew microhydro turbines.
Energ Convers Manage2014; 79: 681–689.
2. Albert R, Thomas H and Thomas S. Simulation of vor-tex rope in a turbine draft tube. In: Proceedings of the hydraulic machinery and systems 21st IAHR symposium, Lausanne, 9–12 September 2002.
3. Sylvain T, Stephane B, Gabriel DC, et al. Experimental analysis of the swirling flow in a Francis turbine draft tube: focus on radial velocity component determination.
Eur J Mech B: Fluid2010; 29: 321–335.
4. Susan Resiga R, Muntean S, Ciocan T, et al. Influence of the velocity field at the inlet of a Francis turbine draft tube on performance over an operating range.IOP C Ser Earth Env2012; 15: 032008.
5. Alin IB, Susan-Resiga R, Muntean S, et al. Unsteady pressure analysis of a swirling flow with vortex rope and axial water injection in a discharge cone.J Fluid Eng: T ASME2012; 134: 081104-1–081104-11.
6. Ciocan G, Iliescu M, Vu TC, et al. Experimental study and numerical simulation of the FLINDT draft tube rotating vortex. J Fluid Eng: T ASME 2007; 129: 146–158.
Figure 8. Efficiency of turbine with the optimal draft tube and original draft tube.
7. Ri-kui Z, Feng M, Jie-zhi W, et al. Characteristics and control of the draft tube flow in part load Francis tur-bine. J Fluid Eng: T ASME 2009; 131: 021101-1–021101-13.
8. ZhiGang Z, ShuHong L, DeMin L, et al. Numerical pre-dictions and stability analysis of cavitating draft tube vortices at high head in a model Francis turbine. Sci China Technol Sci2014; 57: 2106–2114.
9. Johnston JP and Nishi M. Vortex generator jets—means for flow separation control.AIAA J1990; 28: 989–994. 10. Huachen P and Shuli H. Improving the efficiency of a
hydro-turbine system by vortex generator.Adv Mat Res
2011; 354–355: 636–641.
11. Xiaoqing T, Yuan Z, Huachen P, et al. Numerical and experimental study on a model draft tube with vortex generators.Adv Mech Eng2013; 5: 509314.
12. Hyen-Jun C, Zullah MA, Hyoung-Woon R, et al. CFD validation of performance improvement of a 500 kW Francis turbine.Renew Energ2013; 54: 111–123.
13. Galvan S, Reggio M and Guibault F. Assessment study of k-e turbulence models and near-wall modeling for
steady state swirling flow analysis in draft tube using Flu-ent.Eng Appl Comput Fluid Mech2011; 5: 459–478. 14. Azizi S, Hosseini SH, Moraveji M, et al. CFD modeling
of a spouted bed with a porous draft tube.Particuology
2010; 8: 415–424.
15. Fujun W.Computational fluid dynamics analysis: the prin-ciple and application of CFD software. Beijing, China:
Tsinghua University Press, 2011, pp.113–141 (in Chinese).
16. ANSYS-CFX. Version 11.0 (Permanently licensed to Hangzhou Dianzi University), 2011.
17. Huachen P, Ying C, Jie M, et al.A new kinds of draft tube and the design methods. Patent CN101158328, China, 2011.
18. Xiaoqing T, Yuan Z and Bin S.A kind of vortex genera-tor used in hydro-turbines. Patent CN102720622A, China, 2012.
19. Wei Y, Yulin W and Shuhong L. An optimization method on runner blades in bulb turbine based on CFD analysis.Sci China Technol Sci2011; 54: 338–344. 20. Sergio G, Carlos R, Jesus P, et al. Optimization
metho-dology assessment for the inlet velocity profile of a hydraulic turbine draft tube: part I—computer optimiza-tion techniques.J Global Optim2013; 55: 53–72.
21. Menter FR, Kuntz M and Langtry R. Ten years of industrial experience with the SST turbulence model. In:
Turbulence heat and mass transfer, vol. 4. Begell House Inc., 2003, http://cfd.mace.manchester.ac.uk/flomania/ pds_papers/file_pds-1068134610Menter-SST-paper.pdf 22. Hellsten A and Laine S. Extension of the k-v-SST