Evaluation of gene expression profiling in a mouse model of L-gulonolactone
oxidase gene deficiency
Jian Yan
1, Yan Jiao
2, Xinmin Li
3, Feng Jiao
2, Wesley G. Beamer
4, Cliff J. Rosen
4and Weikuan Gu
21
Department of Biology, University of Memphis, Memphis, TN, USA.
2
Center of Genomics and Bioinformatics & Center of Diseases of Connective Tissues, Department of
Orthopedic Surgery-Campbell Clinic, University of Tennessee Health Science Center, Memphis, TN, USA.
3
Functional Genomics Facility, University of Chicago, Chicago, IL, USA.
4The Jackson Laboratory, Bar Harbor, ME, USA.
Abstract
Humans and guinea pigs are species which are unable to synthesize ascorbic acid (vitamin C) because, unlike ro-dents, they lack the enzyme L-gulonolactone oxidase (Gulo). Although the phenotype of lacking vitamin C in hu-mans, named scurvy, has long been well known, information on the impact of lacking Gulo on the gene expression profiles of different tissues is still missing. This knowledge could improve our understanding of molecular pathways in which Gulo may be involved. Recently, we discovered a deletion that includes all 12 exons in the gene for Gulo in the sfx mouse, characterized by spontaneous bone fractures. We report here the initial analysis of the impact of the Gulo gene deletion on the murine gene expression profiles in the liver, femur and kidney.
Key words:spontaneous fracture, bone, gene expression, L-gulonolactone oxidase, vitamin C.
Received: January 10, 2006; Accepted: November 22, 2006.
Introduction
In humans, the lack of vitamin C (L-ascorbic acid) causes scurvy, a disease characterized by spongy gums, loosening teeth, and bleeding into the skin and mucous membranes. Humans and guinea pigs have to obtain vita-min C from food, because they are unable to synthesize ascorbic acid, due to the absence of the gene that encodes L-gulonolactone oxidase (Gulo). There are numerous stud-ies on scurvy using different animal models that show a wide range of bone and skeletal abnormalities associated with the lack of Gulo. However, spontaneous bone fracture has not been reported as a major defect caused by ascorbic acid deficiency.
The spontaneous bone fracture (sfx)mouse is a mouse model for stage-specific bone growth failure and fracture. Initial studies show thatsfxmice have reduced bone mass, abnormalities of bone architecture and a predisposition to fracture spontaneously at a young age (Beamer et al., 2000). Heterozygous (sfx-/+) mice are indistinguishable from homozygous (+/+) wild-type mice at all ages. Mice
which are homozygous for the sfx locus appear pheno-typically normal until the end of weaning at 21 days of age. By 49-56 days of age, the mutants show radiographic evi-dence of compressional fractures of the distal femur and other skeletal sites such as the vertebrae. Histologically, bone sections from the axial and appendicular skeleton show decreased bone formation (with virtually no osteoid present) and decreased basophilia in the osteoblasts.
Using an integrated strategy that combines classical positional cloning and genome resource mapping, we have identified on chromosome 14 of thesfxmouse a deletion of approximately 38 kb of genomic DNA that includes the en-tireGulogene. Further studies showed that this deletion is responsible for the disease phenotypes in bone as well as in other tissues in thesfxmouse (Beameret al., 2000; Jiaoet al., 2005), suggesting that it has a wide pathological impact on different organs of the mouse.
In order to examine the molecular effects of theGulo deletion insfxmice, we conducted a preliminary study on the gene expression profile ofsfxmice using cDNA micro-array. Our data show significantly altered gene expression profiles in the femur, kidney and liver. Different gene ex-pression patterns in each of those tissues suggest that Gulo performs a variety of biological functions in different tis-sues.
www.sbg.org.br
Send correspondence to W. GU. Center of Genomics and Bioin-formatics & Center of Diseases of Connective Tissues, Department of Orthopedic Surgery-Campbell Clinic, University of Tennessee Health Science Center, 956 Court Ave, Memphis, TN, USA. E-mail: [email protected].
Materials and Methods
Animals
Wild-type +/+ BALB/cBy and heterozygous sfx/+ mice were obtained from The Jackson Laboratory. The ho-mozygoussfx/sfxmice were produced at the University of Tennessee Health Science Center (UTHSC) by intercros-sing heterozygoussfx/+ mice. Mice were housed at the ani-mal research facility, Coleman Building, UTHSC, Memphis, TN, under the conditions of 14 h light /10 h dark-ness, ambient temperature of 20±2 °C, and relative humid-ity of 30-60%. Experimental procedures for this study were approved by the IACUC of the UTHSC. For microarray analysis, three age-matched, wild-type +/+ BALB/cBy, in-bred strain mice (WT group; 2 males, 1 female) and 3 ho-mozygous sfx/sfx mice (SFX group; 2 males, 1 female) were used. They were handled as previously described (Jiaoet al., 2005). At the age of 6 weeks, they were sacri-ficed, and femur, liver and kidney specimens were immedi-ately taken out and preserved in liquid nitrogen. For RT-PCR, another panel of age- and sex-matched wild-type andsfx/sfxmice (2 females and 2 males) was used and han-dled in the same way.
Total RNA extraction
Total RNAs were extracted from various tissues us-ing Trizol Reagent (Life Technologies Inc.) (Gu et al., 2002a), and the quality of the resultant total RNA was de-termined by observing distinct 28S and 18S ribosomal bands on (a) formaldehyde-agarose gel. The yield and pu-rity of the extracted RNA were quantified by spectro-photometry using an Eppendorf Biophotometer. Samples with a 28S/18S ratio of≥1.8 and an A260/A280 ratio of 1.8-2.1 were chosen for this study.
Microarray analysis
Total RNAs were isolated from wild-type +/+ and the sfx mouse tissues (femur, liver, and kidney). Individual RNA samples in each group were pooled before use. Eight µg of total RNA for each group were used for cDNA syn-thesis by the SuperScript Choice System (Invitrogen, CA), followed by cRNA synthesis using an Enzo® BioArray HighYield RNA transcript labeling kit. Generated cRNA was hybridized to a GeneChip mouse genome U74Av2 array (Affymetrix, CA) representing ~12,000 mouse tran-scripts, at 45 °C for 16 h, as recommended by the manufac-turer. The arrays were washed and stained in the Affyme-trix Fluidics Station 400 and scanned using an Agilent GeneArray Scanner.
The original microarray data generated by using MAS 5.0 software (Affymetrix) were globally normalized with a target signal of 500. Chips with a < 3 fold resultant scale factor difference were included for data analysis. The dataset was divided into three subsets: bone, liver, and kid-ney, each with a pair of WT and SFX datasets. Using MAS
5.0 software, comparison analyses between WT and SFX subsets from different tissues were performed based on the Affymetrix change algorithm, in which Wilcoxon’s signed rank test is used to compute p-value of the change call, in-cluding Increase, Marginal Increase, No Change, Marginal Decrease, or Decrease. In addition, the intensity log ratio of SFXvs.WT was calculated for each probe set based on the Signal Log Ratio Algorithm. To identify differentially ex-pressed genes between different groups, a cutoff value of twofold changes was chosen, based on most published studies (Schenaet al., 1995; Guet al., 2002b, 2003). To dis-play distinct gene expression patterns and to find a possible gene interaction network based on gene expression pattern, hierarchical clustering was performed on three different data subsets using Cluster and TreeView software (Eisenet al., 1998). To estimate the biological meaning of gene ex-pression changes, Gene Ontology (GO) functional analysis was conducted, using the GenMAPP 2.0 software accord-ing to the instructions (http://www.genmapp.org).
Semi-quantitative RT-PCR
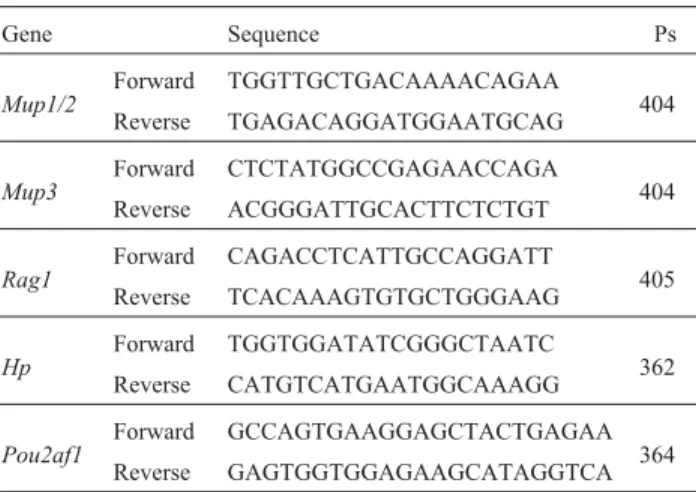
The expression levels of five genes determined by microarray analysis were confirmed by end-point RT-PCR. These genes were selected based on their potential roles in the development of abnormal skeletal phenotypes. Individ-ual total RNA samples were separately subjected to the as-say. Reverse transcription (RT) and PCR were conducted using the One-step RT-PCR kit (Invitrogen Inc, Carlsbad, CA), as recommended by the manufacturer. Specific prim-ers for selected genes are shown in Table 1. The reaction was performed in a total volume of 50µL, at a final concen-tration of 4 ng/µL total RNA and 0.2µM sense and anti-sense primers. cDNA synthesis and pre-denaturation were performed in 1 cycle of 50 °C for 40 min, and 94 °C for 2 min. PCR amplification was performed in 33 cycles of 94 °C for 30 s, 54-58 °C for 36 s, and 72 °C for 2 min. The PCR products were analyzed on a 2.0% agarose gel. Quan-titative analysis of the PCR products was conducted using
Table 1- Specific primers for semi-quantitative RT-PCR.
Gene Sequence Ps
Mup1/2
Forward TGGTTGCTGACAAAACAGAA
404 Reverse TGAGACAGGATGGAATGCAG
Mup3 Forward CTCTATGGCCGAGAACCAGA 404 Reverse ACGGGATTGCACTTCTCTGT
Rag1 Forward CAGACCTCATTGCCAGGATT 405 Reverse TCACAAAGTGTGCTGGGAAG
Hp
Forward TGGTGGATATCGGGCTAATC
362 Reverse CATGTCATGAATGGCAAAGG
Pou2af1
Forward GCCAGTGAAGGAGCTACTGAGAA 364 Reverse GAGTGGTGGAGAAGCATAGGTCA
Scion Image software (http://rsb.info.nih.gov/nih-image). The final RT-PCR signal was obtained by averaging 2 rep-licates for each sample.
Results
Differential gene expression profiles in bone, liver and kidney
According to the microarray measurements, the per-centages of genes called present in the normal femur, liver and kidney, and in thesfx femur, liver and kidney were 53.3%, 38.1%, 53.1%, and 43.9%, 42.0%, 46.9%, respec-tively.It is known that Gulo catalyzes the terminal step in vitamin C biosynthesis. AlthoughGulois expressed exclu-sively in murine liver, vitamin C is required in various tis-sues. So, we expected to find different effects of aGulo mutation on the gene expression in different tissues. Our data suggest that, in addition to the difference in phenotype, there were also differences in the gene expression profiles in the femur, kidney and liver between normal andsfxmice (Table S1). Table 2 summarizes the gene expression changes in three different tissues fromsfxmice. Although bone fracture is the most obvious pathologic phenotype, the number of dysregulated genes in the femur was smaller (n = 316) than in the liver (n = 398) and kidneys (n = 451).
Interestingly, few common gene expression changes were identified among the different types of tissues. Only one gene (Cyp51)was downregulated in all three tissues. There were 22 transcripts (7 upregulated, 15 downregu-lated) that showed similar changes between bone and liver, 12 (5 upregulated, 7 downregulated) between liver and ney, and 7 (2 upregulated, 3 downregulated) between kid-ney and bone.
To display the distinct gene expression patterns of the murine femur, liver and kidney and to find clues of a gene interaction network based on the transcript level, Cluster and TreeView software was applied for hierarchical clus-tering. Examples of six main clusters with more than 10 genes are shown in ± 1. The biological meaning of these gene expression changes was further investigated by GO functional annotation (Table 3).
Table 2- Genes differ by more than a 2-fold value betweensfxand normal control.
Ratio ofsfx/normal signals Bone Liver Kidney
Range 0.03 to 5.3 0.01 to 362.0 0.02 to 139.4
≤0.5 226 200 155
> 2 90 198 296
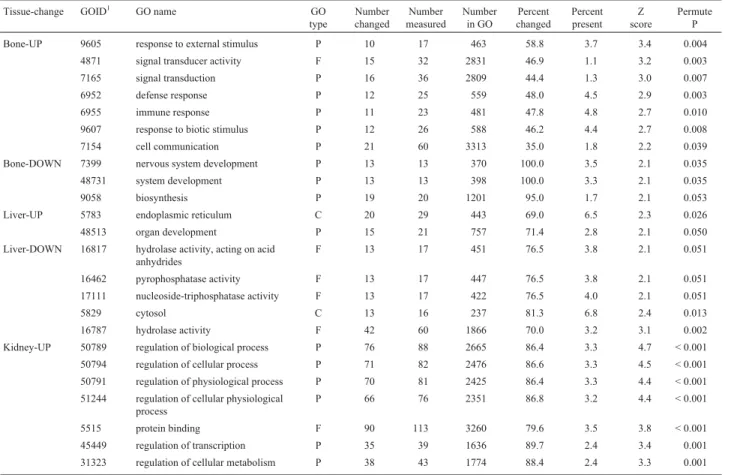
Table 3- Gene Ontology biological profiling of different tissues insfxmice.
Tissue-change GOID1
GO name GO
type
Number changed
Number measured
Number in GO
Percent changed
Percent present
Z score
Permute P
Bone-UP 9605 response to external stimulus P 10 17 463 58.8 3.7 3.4 0.004
4871 signal transducer activity F 15 32 2831 46.9 1.1 3.2 0.003
7165 signal transduction P 16 36 2809 44.4 1.3 3.0 0.007
6952 defense response P 12 25 559 48.0 4.5 2.9 0.003
6955 immune response P 11 23 481 47.8 4.8 2.7 0.010
9607 response to biotic stimulus P 12 26 588 46.2 4.4 2.7 0.008
7154 cell communication P 21 60 3313 35.0 1.8 2.2 0.039
Bone-DOWN 7399 nervous system development P 13 13 370 100.0 3.5 2.1 0.035
48731 system development P 13 13 398 100.0 3.3 2.1 0.035
9058 biosynthesis P 19 20 1201 95.0 1.7 2.1 0.053
Liver-UP 5783 endoplasmic reticulum C 20 29 443 69.0 6.5 2.3 0.026
48513 organ development P 15 21 757 71.4 2.8 2.1 0.050
Liver-DOWN 16817 hydrolase activity, acting on acid anhydrides
F 13 17 451 76.5 3.8 2.1 0.051
16462 pyrophosphatase activity F 13 17 447 76.5 3.8 2.1 0.051
17111 nucleoside-triphosphatase activity F 13 17 422 76.5 4.0 2.1 0.051
5829 cytosol C 13 16 237 81.3 6.8 2.4 0.013
16787 hydrolase activity F 42 60 1866 70.0 3.2 3.1 0.002
Kidney-UP 50789 regulation of biological process P 76 88 2665 86.4 3.3 4.7 < 0.001
50794 regulation of cellular process P 71 82 2476 86.6 3.3 4.5 < 0.001
50791 regulation of physiological process P 70 81 2425 86.4 3.3 4.4 < 0.001
51244 regulation of cellular physiological process
P 66 76 2351 86.8 3.2 4.4 < 0.001
5515 protein binding F 90 113 3260 79.6 3.5 3.8 < 0.001
45449 regulation of transcription P 35 39 1636 89.7 2.4 3.4 0.001
Gene expression profiling in femurs ofsfxmice
In this study, 316 transcripts were found to be differ-entially expressed in femurs from thesfxmice. Many dys-regulated genes in mutant femurs are involved in biosyn-thesis, response to external stimulus, signal transduction, and nervous system development (Table 3). Two major clusters are shown in Figure 1. The gene expression profile
seems highly informative for osteoblasts, as the transcripts of several major genes known to be involved in the regula-tion of osteoblast differentiaregula-tion and funcregula-tions were found to be reduced in SFX mutant bones. These genes include distal-less homeobox 5 (Dlx5) (Sakaguchi and Melchers, 1986; Masudaet al., 2001),Twist1(Sadofsky, 2001; Brun-neret al., 2003), member 1 of melanoma antigen family D Table 3 (cont.)
Tissue-change GOID1
GO name GO
type
Number changed
Number measured
Number in GO
Percent changed
Percent present
Z score
Permute P
7165 signal transduction P 49 58 2809 84.5 2.1 3.3 0.001
7154 cell communication P 63 78 3313 80.8 2.4 3.2 < 0.001
Kidney-DOWN 9605 response to external stimulus P 18 27 463 66.7 5.8 3.6 < 0.001
9607 response to biotic stimulus P 22 36 588 61.1 6.1 3.4 < 0.001
6952 defense response P 21 35 559 60.0 6.3 3.3 0.001
6955 immune response P 20 34 481 58.8 7.1 3.0 0.001
1The detailed description of GO ID, GO type, number changed, number measured, number in GO, percent changed, percent present, Z score, and permute
P can be found on the website www.genmapp.org. The categories were selected based on Z score (≥2) and number changed (> 10). Redundant categories were disregarded.
(Maged1) (Ikeda et al., 1998), and v-ets avian erythro-blastosis virus E26 oncogene homolog 1 (Ets1)(Uchioet al., 2004) (Table 4; most of them are not shown, because their values were less than the cutoff value of two fold change used in this study). Thus, this model may be helpful for identifying transcriptional regulators of osteoblast dif-ferentiation and bone formation.
Recombination-activating gene 1(Rag1)was one of the most depressed genes in the diseased femurs, which was validated by RT-PCR (Table 5). Rag1 is critical for lym-phocyte development. We also noticed that the expression of immunoglobulin lambda chain 5 (Igll1), which is selec-tively transcribed in pre-B lymphocytes (Sakaguchi and Melchers, 1986), was moderately decreased. These find-ings suggest a clue to the mechanisms explaining the role of vitamin C in the regulation of immunity.
Gene expression profiling in liver ofsfxmice
Consistent with a previous report on the effect of ascorbic acid deficiency in the rat liver (Ikedaet al., 1998), we found that a panel of major urinary protein (Mup)genes, includingMup1-5, was significantly suppressed in thesfx mouse liver. The mouse Mups proteins are encoded by a family of about 35 to 40 highly conserved genes. They are expressed in a number of different secretory tissues of the mouse, including the mammary, parotid, sublingual, sub-maxillary and lachrymal glands, as well as in the liver (Shahan et al., 1987). Interestingly, we found a highly
abundant expression ofMup1/2in the wild-type mouse fe-mur. Moreover, a moderately decreased expression of Mup1/2andMup3was found in the femurs of thesfxmice (Table 5). Since Mups are generally regarded as male-preferentially expressed genes, we validated our finding by RT-PCR using individual male and female mice (Figure 1). To our knowledge, this is the first time that non-gland tis-sue was found to expressMupgenes in mammals.
Gene expression profiling in kidney ofsfxmice
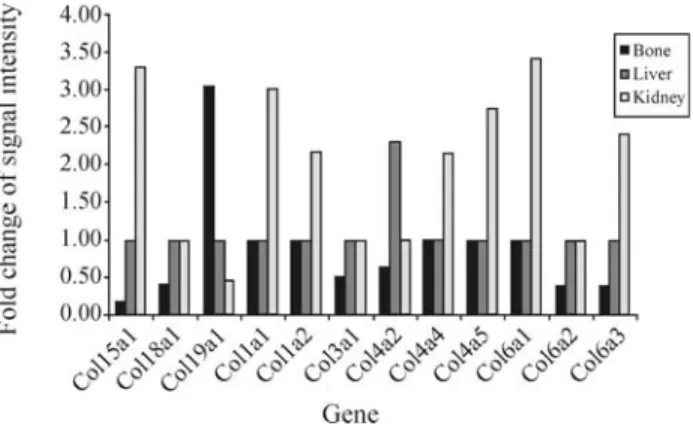
In the mutant kidney, the changes of gene expression were represented by decreased clusters 4-6 (Figure 2). It is clear that ascorbic acid deficiency exerts tissue-specific ef-fects on gene expression. An increased expression of colla-gen synthesis colla-genes such as Col15a1, Col1a1, Col1a2, Col4a4, Col4a5, Col6a1, and Col6a3mRNAs was found in thesfxmouse kidney (Figure 3). Since enhanced collagen in renal fibroblasts is a major cause for renal fibrosis (Uchio et al., 2004), this finding suggests a mechanism for the role of ascorbic acid in the prevention of chronic renal diseases. In this study, the hepatic and renal cyclophilin (CYP)gene expression patterns in thesfxmice showed downregulation of several CYPs that demonstrated tissue-preferential or abundant expression, includingCyp4a12andCyp7b1in the kidney.
RT-PCR confirmation of microarray data
We realized that the small number of animals per group and sample pooling might have biased the overall re-sults. To validate the sensitivity and accuracy of this study, five genes with different expression patterns across differ-ent tissues were selected for semi-quantitative RT-PCR confirmation, using RNAs from femur, liver and kidney. Particularly,Rag1was chosen because of its absence of
ex-Table 4- Bone-specific gene expression in different tissues evaluated by microarray analysis.
Tissue type Gene1
Dlx5 Twist1 Osteocalcin
Bone 0.56 0.63 0.14
Liver N/A2 N/A N/A
Kidney N/A N/A N/A
1
The value represents a ratio of SFX vs WT tissue signal intensity.
2N/A indicates undetectable values using this method.
Table 5- Comparison of some gene expressions in diseased femurs, measured by microarray and semi-quantitative RT-PCR.
Gene Array-based measurement1 PCR-based measurement
Mup1/2 0.2 0.53
Mup3 0.2 0.36
Rag1 0.03 -∞2
Hp 2 1.8
Pou2af1 0.43 0.40
Gapdh Internal control
1The value of measurement represents the ratio of SFX vs WT signal
in-tensity.
2Undetectable in the diseased femurs.
pression in the femurs ofsfxmice.Mup1 andMup3 were chosen because of their gender expression specificity. The class 2 pou domain associating factor 1 (Pou2af1)was cho-sen for its significance in B cell response. Haptoglobin(Hp) was chosen because of its high expression in thesfxmice and in the rats lacking theGulogene (Ellender and Gaze-lakis, 1996; Ikedaet al., 1998). Their relation to Gulo defi-ciency ranges from well-documented to none reported, as will be discussed (in our) later on (see Discussion). As shown in Figure 3 and Table 5, most of the expression pat-terns of these genes were validated, except for genes Mup1/2andMup3, for which microarray analysis showed an opposite change trend in the diseased kidney.
Gender specificity ofMup1andMup3genes in mouse kidney
Gender specificity ofMupgenes expression has been reported previously (Mucignat-Carettaet al., 1998). How-ever, our initial analysis in femurs using RT-PCR (Figure 3A) indicated that the expression levels of Mup1/2 and Mup3were similar between male and female mice in both normal andsfxmice. Therefore, more RT-PCR assays were conducted, using RNAs from another panel of normal and diseased femurs, livers and kidneys. It turned out that gen-der specificity appeared mainly in the kidney, partially in the liver, but not in the femurs. As shown in Figure 3B, these two genes were highly expressed in the liver of male and female normal mice. However, in the kidney, they were only highly expressed in normal male mice. In the femur, their expressions showed a moderate level in both genders,
compared to that in the liver and kidney. Insfxmice, the ex-pression of these two genes was suppressed in both males and females in all three tissues.
Discussion
This is a primary microarray study of thesfxmodel, which we have recently confirmed to be a model of ascor-bic acid deficiency (scurvy). Scurvy is typically character-ized by a weakening of collagenous structures. The well-known function of ascorbic acid is the synthesis of collagen through post-translational modification, by promoting the formation of hydroxyproline. Our results agree with previ-ous reports about the impact of scurvy on major molecules, especially in bone. In this study, our data indicated a signif-icant effect of ascorbic acid deficiency on the regulation of the expression of several major subfamilies of collagen genes in bone and kidney, with both fibril-forming and non-fibril-forming collagen genes being affected (Figure 2). Collagen plays an important role in building up the body structure, including the skin, bones, teeth, blood vessels, cartilage, tendons and ligaments. The downregulation of Col15a1, Col3a1, Col4a5, Col6a2, andCol6a3 may ac-count for the reported poor bone formation.
While most of the array data need to be validated, we confirmed the expression levels of several important genes, which are worthy of future study. The effects of ascorbic acid deficiency onMupgene expression suggest the possi-bility of ascorbic acid involvement in the transcriptional regulation of hormone metabolism. The precise role of al-teredMupsexpression in the development of scurvy is
un-Figure 3- Validation of microarray data using semi-quantitative RT-PCR. Five genes with different expression patterns across femur, liver and kidney, identified by microarray analysis, were selected for validating the microarray assay used, by semi-quantitative RT-PCR. Instead of using pooled samples, as in the microarray analysis, individual age-matched samples were used for the confirmation. The downregulation ofMup1/2, Mup3, Rag1,andPou2af1
clear. One of the well-documented functions of Mups is in chemical communication (Beynon and Hurst, 2003). The identification ofMup1/2expression in the femur provides a clue for their possible role in bone formation. Previously, Metcalfet al.(2000) demonstrated a reduced level ofMup expression in mice lacking a suppressor of cytokine signal-ing-2 (SOCS-2). SOCS members are considered negative regulators of cytokine receptor signaling via the Janus kinase/signal transducer and activation of transcription (STAT) pathway (the JAK/STAT pathway) (Yoshikawaet al., 2001). Interestingly, SOCS-2-/-mice grow significantly more than normal mice, particularly regarding the length of their femurs and humeri (Metcalfet al., 2000). In thesfx mouse, the length of the femurs and humeri is significantly reduced (Beameret al., 2000). No abnormalities in bone ar-chitecture were evident in adult SOSC2 mice, while thesfx mice have extremely fragile bones. Considering the nega-tive effect of SOCS-2 on growth hormones (Turnleyet al., 2002; Greenhalghet al., 2005), Mup is potentially involved in the growth of skeletal tissues, especially the length of fe-murs and humeri, through the hormone metabolism. How-ever, much work needs to be done to clarify the pathologi-cal significance of this unique change in the mouse with Gulo deficiency.
A previous study reveals that the hepaticHpmRNA level is elevated in rats that are defective in ascorbic acid biosynthesis (Ikedaet al., 1998). Our data indicated that the expression level ofHpin the femur was slightly higher in the mutant mice. Since we had chosen a sample pooling ap-proach, we thought that we might miss a lot of important genes with low-fold changes. So we did semi-quantitative RT-PCR to evaluate the expression status ofHp in these three tissues. Interestingly, we did confirm the upregulation ofHpin the femur. It has been recently reported that IL-6 induced the expression of theHpand the suppression of the Mupgene in mice (Gervoiset al., 2004). The upregulation ofHpand downregulation ofMupin the femur of theGulo deficiency mouse raise the interesting question of whether they are functionally connected in the same pathway that is regulated by Gulo in the bone or skeletal development.
SinceRag1plays an essential role in the diversity of cellular and humoral immunity (Sadofsky, 2001), the sup-pressed expression ofRag1may be related to the decrease ofIgl-5. By checking more evidence for dysregulated B cell development, we found thatPou2af1, which plays an im-portant role in B cell development and function (Brunneret al., 2003), was slightly decreased in thesfxmouse femurs. Importantly, this finding was well confirmed by semi-quantitative RT-PCR (Figure 3, Table 5). This finding raises the possibility of ascorbic acid playing a role in the regulation of B lymphocyte development and functions.
Microarray analysis, however, could not distinguish between gene changes caused by the Gulo defect and changes resulting from the organism reacting to thesfx dis-ease state. Many down- or upregulated genes identified in
this study may be important for the physiology and pathol-ogy of bone, liver or kidney. However, further study is needed to clarify their exact role in the development of those organs. In the comparison of gene expression profiles in femurs, we were unable to wash away the bone marrow, because the bones ofsfx mice are extremely fragile. In-stead, we extracted RNA from whole bones. We feel that our approach likely probes the real biological events in the femur. An alternative way is using cultured osteoblasts, however, we are almost certain that the biology in cultured cells will differ from that of bone tissues. In this case, femur tissues and cultured cells each have their advantage and dis-advantage. Furthermore, our previous study indicated that sfxmice nearly have no osteoblasts in their femurs (Beamer et al., 2000). Therefore, we feel confident that this study provides useful information on thesfxmouse.
Acknowledgments
Supported funding for WKG comes from the Center of Excellence for Genomics and Bioinformatics, Center of Excellence for Diseases of Connective Tissues at the Uni-versity of Tennessee Health Science Center, and the Vet-erans Administration Medical Center, Memphis, TN; and from NIH (AR51190). Funding for WGB is from NIH AR43618 (WGB) and CA43619 (CORE grant, The Jack-son Laboratory).
References
Beamer WG, Rosen CJ, Bronson RT, Gu W-K, Donahue LR, Baylink DJ, Richardson CC, Crawford GC and Barker JE (2000) Spontaneous fracture (sfx): A mouse genetic model of defective peripubertal bone formation. Bone 27:619-626. Beynon RJ and Hurst JL (2003) Multiple roles of major urinary
proteins in the house mouse,Mus domesticus. Biochem Soc Trans, Part 1:142-146.
Brunner C, Laumen H, Nielsen PJ, Kraut N and Wirth T (2003) Expression of the aldehyde dehydrogenase 2-like gene is controlled by BOB.1/OBF.1 in B lymphocytes. J Biol Chem 278:45231-45239.
Eisen MB, Spellman PT, Brown PO and and Botstein D. (1998) Cluster analysis and display of genome-wide expression pat-terns. Proc Natl Acad Sci USA 95:14863-14868.
Ellender G and Gazelakis T (1996) Growth and bone remodeling in a scorbutic rat model. Aust Dent J 41:97-106.
Gervois P, Kleemann R, Pilon A, Percevault F, Koenig W, Staels B and Kooistra T (2004) Global suppression of IL-6-indu-ced acute phase response gene expression after chronicin vivotreatment with the peroxisome proliferator-activated re-ceptor-alpha activator fenofibrate. J Biol Chem 279:16154-16160.
Greenhalgh CJ, Rico-Bautista E, Lorentzon M, Thaus AL, Mor-gan PO, Willson TA, Zervoudakis P, Metcalf D, Street I, Nicola NA, Nash AD, Fabri LJ, Norstedt G, Ohlsson C, Flores-Morales A, Alexander WS and Hilton DJ (2005) SOCS2 negatively regulates growth hormone actionin vitro
Gu W, Li XM, Edderkaoui B, Strong DD, Lau KH, Beamer WG, Donahue LR, Mohan S and Baylink DJ (2002a) Construc-tion of a BAC contig for a 3 cM biologically significant re-gion of mouse chromosome 1. Genetica 114:1-9.
Gu W, Li X, Lau KH, Edderkaoui B, Donahue LR, Rosen CJ, Beamer WG, Shultz KL, Srivastava A, Mohan S and Baylink DJ (2002b) Gene expression between a congenic strain that contains a quantitative trait locus of high bone density from CAST/EiJ and its wild-type strain C57BL/6J. Funct Integr Genomics 1:375-386.
Gu W, Li X-M, Roe BA, Lau K-H, Edderkaoui B, Mohan S and Baylink DJ (2003). Application of genomic resources and gene expression profiles to identify genes that regulate bone density. Current Genomics 4:75-102.
Ikeda S, Horio F and Kakinuma A (1998) Ascorbic acid defi-ciency changes hepatic gene expression of acute phase pro-teins in scurvy-prone ODS rats. J Nutr128:832-838. Jiao Y, Li X, Beamer WG, Yan J, Tong Y, Goldowitz D, Roe B
and Gu W (2005) A deletion causing spontaneous fracture identified from a candidate region of mouse chromosome 14. Mamm Genome 16:20-31.
Masuda Y, Sasaki A, Shibuya H, Ueno N, Ikeda K and Watanabe K (2001) Dlxin-1, a novel protein that binds Dlx5 and regu-lates its transcriptional function. J Biol Chem 276:5331-5338.
Metcalf D, Greenhalgh CJ, Viney E, Willson TA, Starr R, Nicola NA, Hilton DJ and Alexander WS (2000) Gigantism in mice lacking suppressor of cytokine signalling-2. Nature 405:1069-1073.
Mucignat-Caretta C, Caretta A and Baldini E (1998) Protein-bound male urinary pheromones: Differential responses ac-cording to age and gender. Chem Senses 23:67-70.
Sadofsky MJ (2001) The RAG proteins in V(D)J recombination: More than just a nuclease. Nucleic Acids Res 29:1399-409. Sakaguchi N and Melchers F (1986) Lambda 5, a new light-chain-related locus selectively expressed in pre-B lympho-cytes. Nature 324:579-82.
Schena M, Shalon D, Davis RW and Brown PO (1995) Quantita-tive monitoring of gene expression patterns with a comple-mentary DNA microarray. Science 270:467-470.
Shahan K, Denaro M, Gilmartin M, Shi Y and Derman E (1987) Expression of six mouse major urinary protein genes in the mammary, parotid, sublingual, submaxillary, and lachrymal glands and in the liver. Mol Cell Biol 7:1947-54.
Turnley AM, Faux CH, Rietze RL, Coonan JR and Bartlett PF (2002) Suppressor of cytokine signaling 2 regulates neuro-nal differentiation by inhibiting growth hormone signeuro-naling. Nat Neurosci 5:1155-1162.
Uchio K, Manabe N, Yamaguchi-Yamada M, Goto Y, Yamamoto Y, Ogura A and Miyamoto H (2004) Changes in the local-ization of type I, III and IV collagen mRNAs in the kidneys of hereditary nephritic (ICGN) mice with renal fibrosis. J Vet Med Sci 66:123-8.
Yoshikawa H, Matsubara K, Qian G.-S, Jackson P, Groopman JD, Manning JE, Harris CC and Herman JG (2001) SOCS-1, a negative regulator of the JAK/STAT pathway, is silenced by methylation in human hepatocellular carcinoma and shows growth-suppression activity. Nature Genet 28:29-35.
Supplementary Material
- Table S1
This material is available as part of the online article from http://www.scielo.br/gmb