Luiza Nayara Almeida Lyra CORREIA(a)
Silvia Augusta Braga REIS(b)
Ana Claudia de Castro Ferreira CONTI(a)
Leopoldino CAPELOZZA FILHO(a)
Renata Rodrigues ALMEIDA-PEDRIN(a)
(a) Universidade Sagrado Coração - USC, Faculdade de Odontologia, Departamento de Ortodontia, Bauru, SP, Brazil.
(b) Private practice, Belo Horizonte, MG, Brazil.
Age-related changes in the Brazilian
woman’s smile
Abstract: The aim of this research was to evaluate age-related changes
in the smile of Brazilian women. The sample consisted of 249 Brazilian women who had not undergone previous orthodontic treatment or facial surgery. They were divided into four groups, according to age: G1 (20-29), G2 (30-39), G3 (40-49) and G4 (50 or older). Standardized front view photographs were taken while smiling and at rest. Measurements were evaluated by ANOVA and post-hoc Tukey. The Chi-square test was applied for qualitative variables. Upper lip thickness at rest and exposure of upper incisors on smiling decreased with age. Most individuals (60.9%) exhibited a medium smile. High smiles were more often seen in G1 (45%) and less frequently in G4 (18.8%), whereas the opposite occurred with the low smile, i.e., G4 (21.9%) and G1 (6.7%). Variations among the groups were observed in the transverse exposure of the teeth on smiling. In G1 and G3, there was a balance between tooth exposures, so that the teeth were exposed as far as the premolars and/or molars. Most of the women (56.3%) in G2 exposed their teeth
as far as the irst molars on smiling, whereas most of those (40.6%) in G4 exposed their teeth only as far as the irst premolars on smiling.
As age increased, there was decreased exposure of the upper incisors, decreased upper lip thickness and lower exposure of teeth vertically and transversely.
Keywords: Dentistry; Aging; Smiling; Age effects.
Introduction
Encouraged by advances in technology and inluenced by the media,
people are increasingly seeking a good appearance, especially adult patients.1 The mouth and the teeth are the key components of facial beauty, and, just like all other body tissues, they change with age. Certain precautions should be adopted to preserve the youthfulness of a smile when planning and performing aesthetic treatment.
Smile aesthetics depends on the interaction of structures such as lips, teeth and cheeks. Professionals should focus their attention on the morphology, length, width, volume and exposure of the lips.2,3 The amount of incisor exposure when the lips are at rest or smiling
can inluence the perception of facial attractiveness, and should be
part of any orthodontic evaluation.4,5 However, this is not a static relationship. Incisor exposure at rest is closely related to age, caused by decreasing muscle function over the years, which increases the Declaration of Interests: The authors
certify that they have no commercial or associative interest that represents a conflict of interest in connection with the manuscript.
Corresponding Author:
Renata Rodrigues de Almeida-Pedrin E-mail: [email protected]
DOI: 10.1590/1807-3107BOR-2016.vol30.0035
Submitted: Jun 26, 2015
length of the upper lip, consequently decreasing upper incisor exposure.6,7 Other factors such as intercommissural distance and interlabial distance should be also considered, since they may affect the smile throughout life.8,9
The literature reports different smile classiication
methods. One method involves the degree of awareness. Thus, a smile may be posed or voluntary, if not involving emotion, and, in this case, is easily reproducible. It may also be involuntary, when induced by pleasure; in this case, it is dynamic and cannot be sustained for a very long time.8
From an anatomical point of view, a smile may
be classiied as high, medium or low, according
to the location of the gingiva and the relationship between the lower border of the upper lip and the upper incisal edges.8 The ideal smile arc and the parallel smile arc are also important components, usually seen in younger patients.10,11,12 However, if the upper incisal margins are straight, the smile is called a straight smile, and if the incisal margins form a reverse curve, it is called a reverse smile.13,14,15
During diagnosis and planning for treatment procedures, orthodontists should evaluate the facial hard and soft tissues in three dimensions, sagittal, vertical and transversal. A fourth dimension warranting evaluation is the time factor.7
The aim of this study was to assess some of the changes that have been occurring in the smile of
Brazilian women over the years. Identiication of the
features likely to change as faces age is essential to preserving a youthful smile when setting treatment goals for adult patients.
Methododology
The sample consisted of 249 adult Brazilian women, randomly selected from the general population. All individuals who agreed to participate in this study signed an informed consent form that explained the research objectives. The research project was approved by the Research Ethics Committee of the
Universidade Sagrado Coração - USC, under protocol number 118/11.
Inclusion criteria included women no younger than 20 years of age, no skeletal discrepancy, and willingness to participate in the study. Exclusion
criteria were individuals with missing teeth, previous orthodontic treatment and/or facial surgery, and facial asymmetry.
The sample (minimum age of 20 and maximum age of 69) was divided into 4 groups according to age: G1 (20-29 years), G2 (30-39 years), G3 (40-49 years), and G4 (50-69 years) (Table 1). In regard to the sample size, at least 30 individuals were required to achieve a 0.80 effect size with a power of 80% among the age
groups (signiicance level set at 5%).
Two photographs were taken of each individual in front view, during the posed (voluntary) smile and at rest. The posed smile is voluntary and static, in the sense that it can be sustained. In orthodontic smile analysis, the posed smile is commonly evaluated because it is reproducible.8
Photographs were acquired using a Canon EOS Rebel XTi digital camera with Macro 100/35 mm lens
and a Canon circular lash. The camera was adjusted
to an exposure time of 1/60 second and aperture of 5.6. A black #5 string with a weight on one end was hung from the ceiling and served as a plumb line, simulating the true vertical line. Thus, throughout the snapshots, the patient’s head was positioned parallel to this line (Figure 1). The subjects remained in a standing position, at a distance of 1.27 m from the camera. The individuals from the sample were asked to keep their teeth in occlusion for the rest capture, spontaneously revealing a competent or incompetent lip seal. The posed smile is voluntary and need not be elicited
or accompanied by emotion; it was obtained
asking the patient to smile as for school picture photographs8 (Figures 2, 3, 4 and 5).
The camera was screwed onto a professional Vivitar tripod with vertical and horizontal leveling. A mirror was placed behind the camera to induce the
individual to look directly at her relected image, in
order to determine her natural head position (NHP)16 (Figure 1). All measurements were performed with Radiocef Studio 2 software.
following structures were evaluated on smiling: (1) upper lip length, (2) upper lip thickness, (3) exposure of upper incisors, from the stomion superius to the incisal edge of the upper incisor, (4) interlabial gap, distance between the upper and lower stomion, (5) outer intercommissural width, (6) distance between the incisal edge of the upper incisors and the lower lip, (Figure 7), (7) type of smile, rated as high, medium or low,17 (8) smile arc, rated as straight, reverse or
parallel, (9) transverse exposure of teeth, showing the most posterior teeth exposed on smiling.
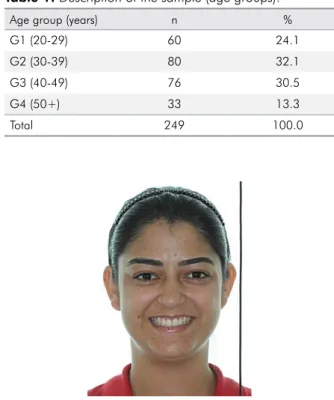
Table 1. Description of the sample (age groups).
Age group (years) n %
G1 (20-29) 60 24.1
G2 (30-39) 80 32.1
G3 (40-49) 76 30.5
G4 (50+) 33 13.3
Total 249 100.0 Figure 1.27.camera placed on the tripod. Patient positioned in front of light box with
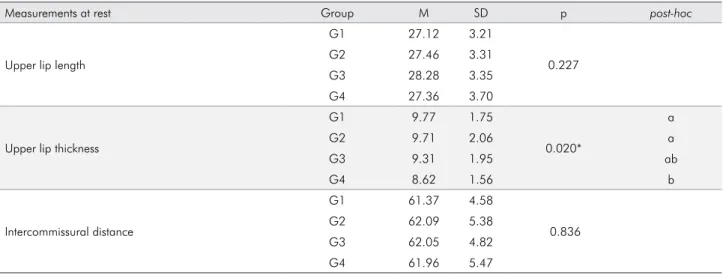
Figure 2. Examples of data collected. Group 1 (age 20-29).
Figure 3. Examples of data collected. Group 2 (age 30-39).
Figure 4. Examples of data collected. Group 3 (age 40-49).
Statistical Analysis
The data were described by means and standard deviations. In examining reliability, the same examiner
(LNALC) measured the irst 50 subjects at two periods
(1 month apart). Accordingly to the Pearson correlation test, the intraexaminer error was highly acceptable,
i.e., from 0.86 to 0.98.
Analysis of variance with one criterion and the
post-hoc Tukey test were used to compare the groups using quantitative measurements. The Chi-square test was used to compare the groups using qualitative
variables. A level of signiicance of 5% (p < 0.05) was
adopted for all the tests. All statistical procedures were performed with Statistica version 5.1 software (StatSoft Inc., Tulsa, USA).
Results
The study results are shown in Tables 2-6. The upper lip length at rest tended to increase
with age; however, no signiicant differences were
found among the groups (p > 0.05) (Table 2). A decrease in the upper lip thickness at rest was found. Post-hoc analyses showed a signiicant
difference in upper lip thickness between G1 and G4, and between G2 and G4 (Table 2).
At rest, the intercommissural distance tended to increase from G1 to G2 and from G3 to G4. However,
this change was not statistically signiicant (Table 2).
Interlabial gap while smiling increased when comparing G1 with G2. Furthermore, there was a decrease from G2 to G3 and to G4. However, no
statistically signiicant differences were noted across
the groups (p = 0.362) (Table 3).
Regarding the exposure of upper incisors, a statistically significant decrease (p = 0.034) was
observed among the groups. However, this inding was statistically signiicant only when comparing
G1 to G4 (Table 3).
When assessing a variable called upper incisor
edge, no statistically signiicant differences were found
among the groups (p = 0.411). The upper lip length showed a progressive increase, although this difference
was not statistically signiicant (p = 0.769) (Table 3).
On smiling, the upper lip thickness varied and the outer intercommissural distance widened, among the
groups, both results having no signiicance (p = 0.491
and p = 0.636, respectively) (Table 3).
In relation to the smile arc, most individuals showed parallel arcs. G3 presented the highest percentage of individuals with a straight smile arc, and G2, with a harmonious smile arc; however, no statistical differences were found (Table 4).
The highest percentage of subjects evaluated had a medium smile. Most of the individuals who had a high smile were in G1 (45%), and the least number were in G4 (18.8%) (Table 5).
Table 3. Measurement results obtained by age group on smiling - Mean (M), Standard Deviation (SD), p-value (p).
Smile measurements G1 M SD p post-hoc
Interlabial gap
16.92 3.96
0.362
G2 17.10 4.68
G3 17.02 4.13
G4 15.57 4.75
Exposure of upper incisors
G1 13.97 3.59
0,034*
a
G2 13.31 2.47 ab
G3 13.09 2.60 ab
G4 12.11 3.09 b
Distance from the edge of the upper incisors to the lower lip
G1 7.41 1.90
0.411
G2 8.12 2.68
G3 7.87 2.24
G4 7.75 2.93
Length of upper lip
G1 19.21 3.45
0.769
G2 19.58 3.20
G3 19.72 3.37
G4 19.88 3.29
Upper lip thickness
G1 8.18 1.89
0.491
G2 8.30 2.08
G3 8.24 2.29
G4 7.66 1.63
Intercommissural distance
G1 84.00 7.32
0.636
G2 84.24 7.49
G3 84.28 7.40
G4 82.37 8.57
*Statistically significant difference (p < 0.05). Groups with the same letter do not differ significantly.
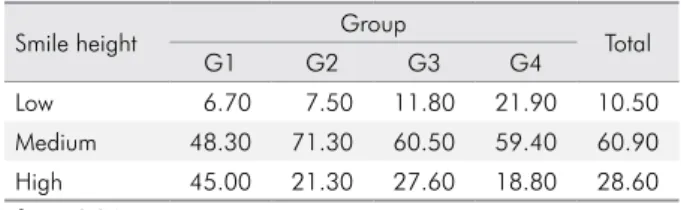
Table 2. Measurement results obtained by the group at rest, Mean (M), Standard Deviation (SD), p-value (p).
Measurements at rest Group M SD p post-hoc
Upper lip length
G1 27.12 3.21
0.227
G2 27.46 3.31
G3 28.28 3.35
G4 27.36 3.70
Upper lip thickness
G1 9.77 1.75
0.020*
a
G2 9.71 2.06 a
G3 9.31 1.95 ab
G4 8.62 1.56 b
Intercommissural distance
G1 61.37 4.58
0.836
G2 62.09 5.38
G3 62.05 4.82
G4 61.96 5.47
* Statistically significant difference (p < 0.05). ns = No statistically significant difference.
Assessing the transverse exposure of teeth on smiling, G1 had only 3.3% of subjects with exposed
upper canines, whereas the exposure of irst premolars,
second premolars and first molars was balanced among the subjects in this group. (Table 6).
Discussion
The smile is the best known facial expression of the human being, and every individual has the innate ability to recognize its beauty.7,8,9,18,19,20 Improving one’s smile is the key purpose compelling patients to seek orthodontic treatment. Since the aging process can change the characteristics of the smile, this process should be evaluated to provide adequate treatment planning for adult patients.
In this study, the parameters of Brazilian women’s faces were measured to evaluate whether or not
aging would inluence the smile. Since the sample
comprised only women, gender differences were not considered in this study.
Regarding the length of the upper lip at rest (Table 1), an increase of 0.24 mm from the youngest to the oldest group was observed, but it was not statistically significant (p > 0.05). These results corroborate those by Formby et al.,21 (0.83 mm from 18 to 42 years old), and by Desai et al.,9 who noted an increase of 1.11 mm in the older group vs. the
younger group, also with no statistical signiicance.
Upper lip length on smiling increased progressively with age (Table 3), although this difference was not
statistically signiicant (p = 0.769). Similar results
showed that lip length tends to increase with age.9 Moreover, aging leads to loss of muscle tone and increasingly greater lip sagging. This probably increases the length of the lips, causing less exposure of the upper anterior teeth.
The relationship between youth, beautiful faces and plumper lips has been highlighted by the media.
A signiicant decrease in upper lip thickness at rest
was found among the groups (p = 0.020). However
these differences were not signiicant among G1, G2
and G3, or between G3 and G4. Post hoc analysis showed that upper lip thickness decreased by a
signiicant 1.15 mm between G1 and G4, and 1.09 mm between G2 and G4. A similar inding on lip thinning
between young and older groups was also reported.9 These results lend further credibility to the empirical observation that older people develop thinner lips.
The literature reports that the intrinsic ibers of the
labial muscles, responsible for maintaining upper lip thickness, are affected by age.21 This measurement is different when individuals with a voluntary smile were assessed (Table 2). The data regarding upper lip thickness on smiling showed an increase among G1, G2 and G3, and a decrease only for G4. However the
Table 4. Percentages of arc types by group.
Arc type Group Total
G1 G2 G3 G4
Straight 33.90 31.60 35.60 32.30 33.50
Reverse 16.10 11.80 16.40 22.60 15.70
Parallel 50.00 56.60 48.00 45.20 50.90
c2 = 2.70; p = 0.845 ns – No statistically significant difference.
Table 5. Percentages of smile heights by group. p =0.010 (significant).
Smile height Group Total
G1 G2 G3 G4
Low 6.70 7.50 11.80 21.90 10.50
Medium 48.30 71.30 60.50 59.40 60.90
High 45.00 21.30 27.60 18.80 28.60
c2 = 16.84.
Table 6. Percentages of the transverse smile by group. p =0.004 (significant).
Transverse Group Total
G1 G2 G3 G4
As far as upper canines 3.30 3.80 7.90 12.50 6.10
As far as upper 1st premolars 33.30 20.00 31.60 40.60 29.40
As far as upper 2nd premolars 30.00 20.00 35.50 18.80 27.00
As far as upper 1st molars 33.30 56.30 25.00 28.10 37.50
differences among the groups were not statistically
signiicant (p = 0.491).
Initially, the goal was to evaluate changes in the intercommissural distance in relation to perioral muscles affected by age. As the skin loses volume and elasticity, it can contribute to increasing the wrinkles at the corners of the mouth, thus masking comissures.22 Nonetheless, the intercommissural distance was measured at rest and showed an increasing trend from G1 to G2 and from G3 to G4, but this change
was not statistically signiicant across the groups. Similar indings reported an increase of 2.71 mm.9 On the other hand, the outer intercommissural distance on smiling increased among the groups, with no
signiicant difference (p = 0.636) (Table 3).
The interlabial gap on smiling tended to increase with age (Table 3), but this was not considered a
statistically signiicant inding. These results do not support those that reported a signiicant age-related
decrease in interlabial gap height, a widening of the smile in the transverse direction and a narrowing of the smile in the vertical direction.9
The literature emphasizes that the upper incisor display is directly related to age.4,6,7,8,9,13,21,22,23,24,25,26,27,28,29 This feature is important not only for the aesthetics of the smile, but also for the attractiveness of the face.25 Regarding the exposure of upper incisors while smiling (Table 2), a statistically significant decrease was found (p = 0.034). However, a decrease
in this variable was statistically signiicant only when
Group 1 was compared with Group 4 (1.86 mm). Vig and Brundo13 reported similar results; they noted a decrease of approximately 3.41 mm in the incisor exposure in younger patients (29 years old) compared with those over 60 years of age. Dong et al.26 described a 2 mm reduction in the exposure of upper incisors between the groups aged 20-29 years and 60-69 years. These results are also consistent with previous studies,6,13,24,25,26,27 thus conirming that young people expose their incisors more prominently when smiling than older people do. These changes are not determined by teeth position variation but rather by the impact of aging on facial tissues, and the effect of gravity on the lips.24,28 These data are of utmost importance for orthodontic diagnosis and planning,
in order to fulill patient expectations regarding the
youthfulness of the smile in the long term.
Changes in the distance from the upper incisor
edge to the lower lip were not statistically signiicant
among the groups (p = 0.411) (Table 3). There was an increase in this distance from G1 to G4. Although
not statistically signiicant this inding conlicts
with that of other studies.9,17,26 In the latter, the authors curiously suggested that people become more aware of their smile as they mature, and shy away from showing their teeth if they do not like how they look, by covering the incisal edges with the lower lip.
In this study, smile arc assessment showed that most of the individuals in all the groups displayed parallel or harmonious arcs (Table 4). This observation agrees with that of other authors9,17,26 who evaluated the smile arc, except for Maulik and Nanda,29 who reported a straight smile in most subjects (49%). The percentage of subjects with reverse smile arcs was lower in all the groups; this finding corroborates other studies (3.6%,9 1.32%,17 and 5%26). Although bearing no statistical
signiicance, the highest percentage of harmonious smiles was found in G2 (56.6%); this inding is in
agreement with other studies, and shows that young patients usually have parallel arcs.2,10,29
In relation to the gum line, the smile can be classified as high (100% of upper incisors plus gingiva are exposed), medium (75 to 100% of upper incisors are exposed) or low (less than 75% of upper incisors are exposed).13,17,19,29 This information is of great clinical relevance, since a high smile undergoes a certain degree of spontaneous correction over time.9 In general, the highest percentage of subjects evaluated exhibited a medium smile (60.9%). These data are consistent with those of other authors, who found 73.8%,9 56.9%,29 68.9%17 and 56%.26 Most individuals with a high smile were from G1 (45%), whereas the least were from G4 (18.8%). These
indings suggest that the upper lips increasingly
cover the upper incisors with age.
In assessing the transverse exposure of the teeth on smiling, it was noted that only 3.3% of the subjects in G1 exposed their upper canines, whereas the exposure
was balanced. Most of the individuals from G2 (56.3%)
exposed their teeth as far as the irst molars on smiling.
In G3 there was a balance between the exposures of the different teeth, that is, the subjects exposed their teeth as far as the premolars and/or molars. Most of the individuals in G4 (52.1%) exposed their teeth
only as far as the irst premolars on smiling. When
investigating changes in the intercommissural distance, a decrease was found that could explain the exposure of lower teeth in older women. It is also speculated that changes in muscle tone may occur; this could interfere in the ranges of this distance. Dental casts plus photographs are strongly advised in order to obtain more accurate assessments. This procedure would allow more reliable conclusions to be drawn
regarding this speciic feature of the smile. This is
important, bearing in mind that the aging process affects the perioral tissues and, consequently, the smile. The differences in sociocultural backgrounds and racial origin traits support the importance to study the age-related changes in different populations.
The present study showed that changes do occur as Brazilian women age; thus, a better understanding of this process and an individual approach are necessary to provide cost-effective treatment. The limitation of this study was the static protocol of the smile evaluation. An ideal situation would be to capture and analyze the smile with videography and computer software, as reported in other studies. The advantage of the smile evaluation conducted in this study regards the picture captured from digital videos of the best snapshots.9,12
Conclusions
The major changes observed in the smile of aging Brazilian women were:
a. Reduced upper lip thickness at rest – from G2 to G4, respectively (0.6%, 4.7%, 11.8%)
b. Reduced exposure of the upper incisors on smiling – from G2 to G4, respectively (4.7%, 6.3%, 13.3%).
c. Less exposure of the teeth in the transverse and vertical directions.
1. Bernabé E, Flores-Mir C. Influence of anterior occlusal characteristics on self-perceived dental appearance in young adults. Angle Orthod. 2007;77(5):831-6. doi:10.2319/082506-348.1
2. Davis NC. Smile Design. Dent Clin North Am. 2007;51(2):299-319.
3. Nanda RS, Ghosh NR. Facial soft tissue harmony and growth in orthodontic treatment. Semin Orthod. 1995;1(2):67-81. doi:10.1016/S1073-8746(95)80094-8 4. Sarver DM, Ackerman JL. Orthodontics about face: the
re-emergence of esthetic paradigm. Am J Orthod Dentofacial Orthop. 2000;117(5):575-6. doi:10.1016/S0889-5406(00)70204-6 5. Mack MR. Perspective of facial esthetics in dental
treatment planning. J Prosthet Dent. 1996;75(2):169-76. doi:10.1016/S0022-3913(96)90095-5
6. Peck S, Peck L, Kataja M. Some vertical lineaments of lip position. Am J Orthod Dentofacial Orthop. 1992;101(6):519-24. 7. Sarver DM, Ackerman MB. Dynamic smile
visualization and quantification: part 1. Evolution of the concept and dynamic records for smile capture. Am J Orthod Dentofacial Orthop. 2003;124(1):4-12. doi:10.1016/S0889-5406(03)00306-8
8. Sarver DM. The importance of incisor positioning in the esthetic smile: the smile arc. Am J Orthod Dentofacial Orthop. 2000;120(2):98-111. doi:10.1067/mod.2001.114301
9. Desai S, Upadhyay M, Nanda R. Dynamic smile analysis: changes with age. Am J Orthod Dentofacial Orthop. 2009;136(3):310.e1-10. doi:10.1016/j.ajodo.2009.01.021 10. Frush JO, Fisher RD. The dynesthetic interpretation of
the dentogenic concept. J Prosthet Dent. 1958;8(4):558-81. doi:10.1016/0022-3913(58)90043-X
11. Morley J, Eubank J. Macroesthetic elements of smile design. J Am Dent Assoc. 2001;132(1):39-45. doi:10.14219/jada.archive.2001.0023
12. Chetan P, Tandon P, Singh GK, Nagar A, Prasad V, Chugh VK. Dynamics of a smile in different age groups. Angle Orthod. 2013;83(1):90-6. doi:10.2319/040112-268.1 13. Vig RG, Brundo GC. The kinetics of anterior
tooth display. J Prosthet Dent. 1978;39(5):502-4. doi:10.1016/S0022-3913(78)80179-6
14. Matthews TG. The anatomy of a smile. J Prosthet Dent. 1978;39(2):128-34.
15. Ker AJ, Chan R, Fields HW, Beck M, Rosentiel S. Esthetics and smile characteristics from laypersons perspective: a computer-based survey study. J Am Dent Assoc. 2008;139(10):1318-27. doi:10.14219/jada.archive.2008.0043 16. Cooke MS, Orth D, Wei SHY. The reproducibility
of natural head posture: a methodological study. Am J Orthod Dentofacial Orthop.1988;93(4):280-8. doi:10.1016/0889-5406(88)90157-6
17. Tjan AH, Miller GD, The JGP. Some esthetic factors in a smile. J Prosthet Dent.1984;51(1):24-8. doi:10.1016/S0022-3913(84)80097-9
18. Peck S, Peck L. Selected aspect of the art and science of facial esthetic. Semin Orthod. 1995;1(2):105-26. doi:10.1016/S1073-8746(95)80097-2
19. Sarver DM, Ackerman MB. Dynamic smile visualization and quantification: part 2. Smile analysis and
treatment strategies. Am J Orthod Dentofacial Orthop. 2003;124(2):116-27. doi:10.1016/S0889-5406(03)00307-X 20. Kokich VO Jr, Kiyak HA, Shapiro PA. Comparing
the perception of dentists and lay people to altered dental esthetics. J Esthetic Dent. 1999;11(6):311-24. doi:10.1111/j.1708-8240.1999.tb00414.x
21. Formby WA, Nanda RS, Currier GF. Longitudinal changes in the adult facial profile. Am J
Orthod Dentofacial Orthop. 1994;105(5):464-76. doi:0.1016/S0889-5406(94)70007-9
22. Singh B, Ahluwalia R, Verma D, Grewal SB, Goel R, Kumar PS. Perioral age-related changes in smile dynamics along vertical plane. a videographic cross-sectional study. Angle Orthod. 2013;83(3):468-75. doi:10.2319/061212-488.1
23. Hulsey CM. An esthetic evaluation of lip-teeth
relationships present in smile. Am J Orthod. 1970;57(2):132-44. doi:10.1016/0002-9416(70)90260-5
24. Peck S, Peck L, Kataja M. The gingival smile line. Angle Orthod. 1992;62(2):91-100.
25. Spear FM, Kokich VG, Mathews DP. Interdisciplinary management of anterior dental esthetics. J Am Dent Assoc. 2006;137(2):160-9. doi:10.14219/jada. archive.2006.0140
26. Dong JK, Jin TH, Cho HW, Oh SC. The esthetics of the smile: a review of some recent studies. Int J Prosthodont. 1999;12(1):9-19.
27. Dickens S, Sarver DM, Proffit WR. The dynamics of the maxillary incisor and the upper lip: a cross-sectional study of resting and smile hard tissue characteristics. World J Orthod. 2002;3(4):313-20.
28. Fudalej P. Long-term changes of upper lip position relative to the incisal edge. Am J Orthod Dentofacial Orthop. 2008;133(2):204-9. doi:10.1016/j.ajodo.2006.04.040 29. Maulik C, Nanda R. Dynamic smile analysis in young