Artigo Original
Weslania Viviane Do Nascimento1 Rachel De Aguiar Cassiani2 Roberto Oliveira Dantas3
Keywords
Anthropometry Gender Face Height Adult
Descritores
Antropometria Gênero Face Estatura Adulto
Correspondence adress: Weslania Viviane do Nascimento R. Franklin Magalhães 720/33B, Vila Santa Catarina, São Paulo (SP), Brasil, CEP: 04374-000.
E-mail: [email protected] Received: 22/12/2011
Accepted: 13/9/2012
Study carried out at the Department of Ophthalmology, Otolaryngology and Head and Neck Surgery and at the Department of Medical Clinic, Medical School of Ribeirão Preto, Universidade de São Paulo – FMRPUSP – Ribeirão Preto (SP), Brazil.
(1) Graduate Program in Biosciences applied to Medical Clinic, Medical School of Ribeirão Preto, Universidade de São Paulo – FMRPUSP – Ribeirão Preto (SP), Brazil.
(2) Medical School of Ribeirão Preto, Universidade de São Paulo – FMRPUSP – Ribeirão Preto (SP), Brazil. Speech Language Pathologist at Centro Integrado de Reabilitação do Hospital Estadual de Ribeirão Preto - CIRHERP - Ribeirão Preto (SP), Brazil.
(3) Department of Medical Clinic, Medical School of Ribeirão Preto, Universidade de São Paulo – FMRPUSP – Ribeirão Preto (SP), Brazil.
Conlict of interests: nothing to declare.
measurements
Efeito do gênero, da altura corporal e da etnia nas medidas
antropométricas orofaciais
ABSTRACT
Purpose: The aim of this study was to assess the inluence of gender, height and ethnicity on anthropometric orofacial measures in the adult population, and the possible correlation between these measures. Methods: Anthropometric orofacial measurements were performed in asymptomatic volunteers, being 56 women and 44 men, aged 19 to 53 years. The measure were: upper lip height (sn-sto); lower lip height (sto-gn); ilter height (sn-ls); upper third of the face (tr-g); middle third of the face (g-sn); lower third of the face (sn-gn); and distance between the outer canthus (ex) and cheilion (ch). Results: All measurements were larger for men than for women. There was a positive correlation between most of the measures. There was no correlation between height and anthropometric orofacial measures, except for the middle third of the face (g-sn) of men, which had a weak positive correlation. Afro-Brazilian subjects presented larger measures for the lower third of the face (sn-gn) and for the distance between the outer canthus (ex) and the left cheilion (ch) than white subjects. Conclusion: Men have greater orofacial anthropometric measures than women. Height does not seem to have an inluence on such measures.
RESUMO
INTRODUCTION
Many studies reveal anatomical and functional differences between men and women in relation to the mouth, pharynx, upper esophageal sphincter, esophagus and deglutition(1-5).
Anthropometry offers several advantages for the morpho-logical study of the craniofacial complex(6) because it uses
simple, non-invasive and no-risk techniques at low cost(7).
Literature describes the effects of gender on anthropometric orofacial measures, mentioning larger measures for men when compared to women(8,9-11). Also, studies reveal
differ-ences between anthropometric orofacial measures in different ethnicities(6,8,12,13).
The proposal is that these measures are important to the speech therapy examination, being increasingly used for as-sessment, prognosis, planning(7) and therapeutic follow-up. It
is known that the coniguration of craniofacial structures, as well as orofacial musculature and dental occlusion, directly impact on chewing, deglutition, breathing, speech and voice functions(14).
A recent study about the degree of variability of orofacial measures among speech therapists specialized in orofacial motricity showed good reproducibility of the performed measurements, except for the opening of the mouth with the tongue in the papillae, indicating that data produced by different professionals are reliable(15).
The purpose of this study was to assess the differences between anthropometric orofacial measures of adult men and women, the correlation between these measures and the inlu-ence of height and ethnicity. The hypothesis was that gender and height inluence anthropometric orofacial measures.
METHODS
The research project was approved by the Ethics Research Committee of the clinical hospital at the medical school of Ribeirão Preto, Universidade de São Paulo, process n. 5226/2008. All the volunteers signed the informed consent form. Fifty-six females aged between 19 and 53 years, mean age of 31.5±10.2 years old, participated in the study, as well as 44 males aged between 19 and 53 years , mean age of 32.4±10,2 years. People living in the state of São Paulo belonging to all social classes were included. Among men, 33 were white and 11 were Afro-Brazilians, and among women, 39 were white and 17 were Afro-Brazilians.
People with craniofacial anomalies/alterations, with skel-etal occlusion disorders or any anatomical change that could interfere with anthropometric measures were excluded. All subjects were measured and divided into two groups: those whose height ranged from 1.49 to 1.65 m, mean of 1.59±0.05 m,
and those whose height ranged from 1.66 and 1.89 m, mean of 1.76±0.06 m.
In order to collect anthropometric orofacial measures, a Vonder® metallic caliper (Brazil) was used. Before the
mea-surements were performed, volunteers were asked to remain seated, with their feet on the ground, head at rest position and occluded lips. They were also asked to remove their glasses, and afterwards the caliper and its function were shown to them. Then, the following measures were taken: upper lip height (sn-sto), which corresponds to the distance between the subnasal point (sn) and the lowest point of the upper lip (sto); lower lip height (sto-gn), which corresponds to the distance between the highest point of the lower lip (sto) and gnathion (gn); ilter height (sn-ls), which corresponds to the distance between the subnasal point (sn) and the upper lip point; the upper third of the face (tr-g), which corresponds to the measure of the trichion (tr) to the glabella (g); the middle third of the face (g-sn), which corresponds to the measure of the glabella (g) to the subnasal point (sn); the lower third of the face (sn-gn), which corresponds to the measure of the subnasal point (sn) to the gnathion (gn); and the distance between the outer canthus (ex) and cheilion (ch), which corresponds to the dis-tance between these facial points(7). The orofacial proportions
of the upper third of the face/lower third of the face (tr-g/g-sn) and the middle third of the face/lower third of the face (g-sn/ sn-gn), were also analyzed. All measurements were taken at the same time.
Statistical analysis was conducted at the center of quan-titative methods of the medical school of Ribeirão Preto (CEMEQ). The linear regression model with mixed effects (random and ixed effects)(16) was used. This model presupposes
that the residue obtained from the difference between values predicted by the model and the observed values should have normal distribution with zero mean and constant variance. The model was adjusted by the SAS software, version 9.0. Also, the Wilcoxon non-parametric test was used. to compare two distributions. Therefore, it does not require assumptions as to data distribution. Correlations between the different measure-ments and between height and measuremeasure-ments were assessed and , the Pearson’s correlation coeficient (r) was calculated. The analyses were carried out with the SAS® 9.0 software, with
the PROC IML. Results are presented in mean, mean standard deviation, 95% conidence interval and Pearson’s correlation coeficient (r).
RESULTS
The distribution of participants’ height is presented in Table 1. Concerning anthropometric orofacial measures, greater val-ues were found for men in relation to women (p≤0.02) (Table 2).
Table 1. Distribution of the height of the participants in relation to gender
Height from 1.49 to 1.65 m Height from 1.66 to 1.89 m
Women Men Total Women Men Total
Number 37 4 41 19 40 59
Height (mean±SD) 1.59±0.05 1.60±0.06 1.59±0.05 1.69±0.04 1.77±0.06 1.75±0.06
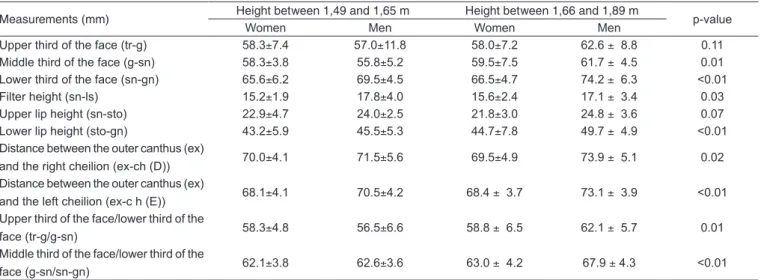
Among subjects with heights between 1.66 and 1.89 m, there was a difference between men and women, with greater values found for men (p<0.03) (Table 2). There were no dif-ferences among women with heights between 1.49 and 1.65 m (n=37), and among subjects with heights between 1.66 and 1.89 m (n=19) (p>0.05) (Table 3).
There was a positive correlation between most of the performed measurements. Table 4 presents the measures with Pearson’s correlation coeficient (r) higher than 0.715, consid-ering all the 100 subjects, thus indicating a strong correlation between them (p<0,001).
There was no correlation (coeficient correlation between 0 and 0.183) between the measuresof the middle third of the face (g-sn): ilter height (sn-ls); middle third of the face (g-sn): lower lip height (sto-gn); ilter height (sn-sto): upper third of the face (tr-g); ilter height (sn-sto): lower lip height (sto-gn); ilter height (sn-sto): upper third of the face (tr-g) (p>0.07).
Among women, there was no correlation between height and orofacial measures, but among men there was a weak posi-tive correlation between height and measures of the middle third of the face (g-sn), distance between the outer canthus (ex) and the left cheilion (ch), and the proportion between the middle third and the lower third of the face (g-sn/sn-gn) (p<0.04). With the multivariate regression analysis, it was observed that, among men the measures of the middle third of the face (g-sn) had a positive correlation with height (r=0.410, p<0.01), and the other correlations with signiicant results are a consequence of the measures of the middle third of the face (g-sn).
Afro-Brazilian subjects presented larger measurements of the lower third of the face (sn-gn) (Afro-Brazilian: men: 77.8 mm, women: 66.6 mm; white: men: 72.5 mm, women: 65.3 mm) and the distance between the outer canthus (ex) and the left cheilion (ch) (Afro-Brazilian: men: 73.6 mm, women 70.1 mm; white: men: 72.7 mm, women: 67.3 mm)
Table 2. Comparing anthropometric orofacial measurements according to gender
Measurements (mm) Women Men p-value*
Mean±SD 95%CI Mean±SD 95%CI
Upper third of the face (tr-g) 58.2±7.2 56.3—60.1 62.1±9.1 59.3—64.8 0.02 Middle third of the face (g-sn) 58.7±5.3 57.3—60.2 61.1±4.8 59.7—62.6 0.01 Lower third of the face (sn-gn) 65.9±5.7 64.4—67.4 73.8±6.3 71.8—75.7 <0.01 Filter height (sn-ls) 15.3±2.0 14.8—15.9 17.2±3.4 16.2—18.2 <0.01 Upper lip height (sn-sto) 22.5±4.2 21.4—23.7 24.7±3.5 23.6—25.8 <0.01
Lower lip height (sto-gn) 43.7±5.3 42.3—45.1 49.3±5.1 47.7—50.8 <0.01 Distance between the outer canthus
(ex) and the right cheilion (ch) (ex-ch(D)) 69.9±4.4 68.7—71.0 73.7±5.2 72.1—75.3 <0.01 Distance between the outer canthus
(ex) and the left cheilion (ch) (ex-ch(E)) 68.2±3.9 67.2—69.3 72.8±4.0 71.6—74.0 <0.01 Upper third of the face/lower third of the
face (tr-g/g-sn) 58.5±5.4 57.0—59.9 61.6±6.0 59.8—63.4 0.01
Middle third of the face/lower third of the
face (g-sn/sn-gn) 62.9±4.0 61.3—63.4 67.5±4.5 66.0—68.8 <0.01
*p-value refers to the comparison between men and women Legends: SD = standard deviation; CI = confidence interval
Table 3. Comparison of anthropometric orofacial measurements according to gender and height
Measurements (mm) Height between 1,49 and 1,65 m Height between 1,66 and 1,89 m p-value
Women Men Women Men
Upper third of the face (tr-g) 58.3±7.4 57.0±11.8 58.0±7.2 62.6 ± 8.8 0.11 Middle third of the face (g-sn) 58.3±3.8 55.8±5.2 59.5±7.5 61.7 ± 4.5 0.01 Lower third of the face (sn-gn) 65.6±6.2 69.5±4.5 66.5±4.7 74.2 ± 6.3 <0.01 Filter height (sn-ls) 15.2±1.9 17.8±4.0 15.6±2.4 17.1 ± 3.4 0.03 Upper lip height (sn-sto) 22.9±4.7 24.0±2.5 21.8±3.0 24.8 ± 3.6 0.07 Lower lip height (sto-gn) 43.2±5.9 45.5±5.3 44.7±7.8 49.7 ± 4.9 <0.01 Distance between the outer canthus (ex)
and the right cheilion (ex-ch (D)) 70.0±4.1 71.5±5.6 69.5±4.9 73.9 ± 5.1 0.02 Distance between the outer canthus (ex)
and the left cheilion (ex-c h (E)) 68.1±4.1 70.5±4.2 68.4 ± 3.7 73.1 ± 3.9 <0.01 Upper third of the face/lower third of the
face (tr-g/g-sn) 58.3±4.8 56.5±6.6 58.8 ± 6.5 62.1 ± 5.7 0.01 Middle third of the face/lower third of the
face (g-sn/sn-gn) 62.1±3.8 62.6±3.6 63.0 ± 4.2 67.9 ± 4.3 <0.01
than white subjects (p<0.04), with the difference observed between men and women also observed between Afro-Brazilian and white people.
DISCUSSION
Results showed a tendency to greater measures for male faces in comparison to female faces. These data are in accor-dance with previous research(9-11). Literature points out to
differ-ences in facial growth between genders from the age of ten(17).
It was observed that even when men and women had similar height, anthropometric orofacial measures were different; and that among women with different heights, taller or shorter than 1.65 m, results of anthropometric orofacial measures were the same. Results were consistent for women, once the number of assessed men shorter than 1.65 wassmall.
The obtained results were similar to those described for the upper lip height (sn-sto) (women: 17 to 23 mm, men: 21 to 26 mm)(9,10) and the lower lip height (sto-gn) (women: 38
to 55 mm, men: 42 to 58 mm)(10).We could not ind studies in
literature relating height with facial growth, but it is known that such growth is inluenced by gender(17,18).
The observed differences can explain the behavior of men and women during deglutition(1,2,5). Men swallow a greater
vol-ume of water in each deglutition, with larger low, in relation to women(1,2), and women have longer oral and pharyngeal transit
in comparison to men(5). Larger orofacial measurements can
also justify the observation that men are able to tolerate a larger volume of water in the oral cavity in comparison to women(19,20).
A previous study describes that height has no signiicant inluence on deglutition(1), as it has no inluence on orofacial
measures, which reinforces the hypothesis that the differences
described in deglutition of men and women should be a conse-quence of or be associated with different orofacial measures, and not related to height.
A study about morphology and changes in facial proile dur-ing growth reports that gender dimorphism starts to be noticed from ages of 10 to 12, when the male gender growth, especially in linear measures, is responsible for facial differentiation. It was also observed that the soft proile becomes more convex while the opposite happens with the skeletal proile(17).
The main difference of gender dimorphism is the size and coniguration of the nose, which leads to collateral differences in other topographic structures of the face. The group of all regional topographic differences makes the female face latter, proportionally wider and more delicate, unlike males, whose face is deeper, more irregular, protuberant and rustic(18).
Also, the differences found between ethnicities are in ac-cordance with literature(6,8,12,13), with larger measurements of the
lower third of the face in people with African backgound(13).
As to the correlation between anthropometric measures, we observed that there was a positive correlation between most of them, demonstrating that when one measure increases, the other also increases proportionally. Therefore, we can infer that such proportion between measures creates an harmonic facial pattern, which should interfere with stomatognathic functions. We should consider that, in order to this harmonic facial pattern to develop there is the inluence of occlusion and orofacial musculature.
The anthropometric orofacial measures can inluence not only deglutition, but chewing also. It has been demonstrated that men have stronger bites in relation to women, and that the total facial height is not correlated with bite strength. Transverse facial dimensions affect bite strength only for men, indicating
Table 4. Anthropometric orofacial measurements with correlation superior to 0.715 (Pearson’s Correlation Coefficient – r), indicating strong cor-relation between them (p<0.001)
Measurements Women Men Total p-value
ex-ch E:ex-ch D 0.753 0.854 0.830 <0.001
sn-gn:sto-gn 0.666 0.821 0.800 <0.001
g-sn:g-sn sn-gn 0.700 0.748 0.716 <0.001
g-sn:tr-g g-sn 0.808 0.709 0.776 <0.001
g-sn sn-g:sn-g 0.739 0.861 0.856 <0.001
tr-g:tr-g g-sn 0.901 0.927 0.917 <0.001
Table 5. Correlation between anthropometric orofacial measurements and height (Pearson’s Correlation Coefficient – r)
Measurements Women Men
r p-value r p-value
Upper third of the face (tr-g) 0.048 0.724 -0.032 0.835
Middle third of the face (g-sn) 0.091 0.504 0.410 0.006
Lower third of the face (sn-gn) 0.121 0.375 0.169 0.271
Filter height (sn-ls) 0.157 0.249 -0.197 0.199
Upper lip height (sn-sto) 0.014 0.917 -0.116 0.452
Lower lip height (sto-gn) 0.040 0.769 0.270 0.076
that men with long faces have weaker bites in relation to men with regular faces(21).
Anthropometric orofacial measures were taken once for each subject. There is a good correlation between the results ob-tained by different professionals(15); so, repetitions of
measure-ments taken by the same person should obtainsimilar results. There was a natural limitation to determine ethnicity, once it was only conducted by skin color. Only this was possible, due to the frequent miscegenation of Brazilian population. Those who were clearly Afro-Brazilians were classiied as Afro-Brazilians, and the others were classiied as white.
The idea is that these results have clinical importance, since it is essential for the speech-language pathology examination concerning the assessment, prognosis, planning and therapeutic follow-up in orofacial motricity.
CONCLUSION
There are differences in anthropometric orofacial measures of men and women, and men present larger values when com-pared to women. There is a positive correlation between most anthropometric orofacial measures. The height of the subjects seems not to inluence such measures. In comparison to white subjects, Afro-Brazilian people present larger measures of the lower third of the face and the distance between the outer canthus and the left cheilion.
ACKNOWLEDGEMENTS
We thank the inancial supported conceived by the São Paulo Research Foundation (FAPESP) for the development of this project (FAPESP process n. 08/58805-6).
* WVN contributed with the organization of the project, data collection, analysis of results and writing; RAC collaborated with the organization of the project, data collection; ROD contributed with the organization of the project, analysis of results and writing.
REFERENCES
1. Hughes TA, Wiles CM. Clinical measurement of swallowing in health and in neurogenic dysphagia. Q J Med. 1996;89(2):109-16.
2. Alves LMT, Cassiani RA, Santos, CM, Dantas, RO. Gender effect on the clinical measurement of swallowing. Arq Gastroenterol. 2007;44(3):227-9.
3. Dantas RO, Ferriolli E, Souza MAN. Gender effects on esophageal motility. Braz J Med Biol Res. 1998;31(4):539-44.
4. Gluckman A. Sexual dimorphism in human and mammalian biology and pathology. New York: Academic Press; 1981.
5. Dantas RO, Cassiani, RA, Santos CM, Gonzaga GC, Alves, LMT, Mazin, SC. Effect of gender on swallow event duration assessed by videoluoroscopy. Dysphagia. 2008;24(3):280-4.
6. Farkas LG, Katic MJ, Forrest CR, Alt KW, Bagic I, Baltadjiev G, et. al. International anthropometric study of facial morphology in various ethnic groups/races. J Craniofac Surg. 2005;16(4):615-46.
7. Cattoni, DM. O uso do paquímetro na motricidade orofacial: procedimentos de avaliação. Barueri: Pró Fono; 2006.
8. Zhuang A, Landsittel D, Benson S, Roberge R, Shaffer R. Facial anthropometric differences among gender, ethnicity, and age groups. Ann Occup Hyg. 2010;54(4):391-402.
9. Psillakis JM, Lucardi V. Proporções estéticas da face. In: Psillakis JM, Zanini SA, Mélega JM, Costa EA, Cruz RL. Cirurgia craniomaxilofacial: osteotomias estéticas da face. Rio de Janeiro: Medsi; 1987. p. 297-313.
10. Langlade M. Análise da estética. In: Langlade M. Diagnóstico ortodôntico. São Paulo: Santos; 1995. p. 129-60.
11. Sunguino R, Ramos AL, Terada HH, Furquim LZ, Maeda L, Silva Filho OG. Análise facial. Rev. Dent. Press Ortodon. Ortop. Maxilar. 1996;1(1):86-107.
12. Farkas LG, Katic MJ, Forrest CR. Comparison of craniofacial measurements of young adult African-American and North American white males and females. Ann Plast Surg. 2007;59(6): 692-8.
13. Parro FM, Toledo MR, Gomes ICD, Marchesan IQ. Diferenças antropométricas entre mulheres brancas e negras após crescimento puberal. Rev CEFAC. 2005;7(4):458-65.
14. Ramires RR, Ferreira LP, Marchesan IQ, Cattoni DM, Silva MAA. Tipologia facial aplicada à fonoaudiologia: revisão de literatura. Rev Soc Bras Fonoaudiolol. 2010;15(1):140-5.
15. Rodrigues FV, Monção FRC, Moreira MBR, Motta AR. Variabilidade na mensuração das medidas orofaciais. Rev Soc Bras Fonoaudiol. 2008;13(4):332-7.
16. Schall R. Estimation in generalized linear models with random effects. Biometrika. 1991;78(4):719-27.
17. Herdy JLA, Nouer PRA, Junqueira JLC, Gumieiro EH. Morfologia e alterações do peril facial durante o crescimento. Ortodontia, São Paulo. 2002;35(2):109-19.
18. Enlow DH, Hans MG. Forma e padrão da face. In: Enlow, DH; Hans, MG. Noções básicas sobre crescimento facial. São Paulo: Santos; 2003. p. 130-1.
19. Nascimento WV, Cassiani RA, Dantas RO. Gender effect on oral volume capacity. Dysphagia. 2011 (in press) DOI: 10.1007/s00455-011-9379-4. 20. Lawless HT, Bender S, Oman C, Pelletier C. Gender, age, vessel size,
cup vs. straw sipping, and sequence effects on sip volume. Dysphagia. 2003;18(3):196-202.