AR
TICLE
1 Departamento de Medicina Preventiva, Universidade Federal de São Paulo. R. Botucatu 740, Vila Clementino. 04038-034 São Paulo SP Brasil.
[email protected] 2 Faculdade de Nutrição, Universidade Federal de Alagoas.
3 Núcleo de Educação Permanente, Secretaria Municipal de Saúde de Mauá.
4 Atenção Básica de Diadema, Secretaria Municipal de Saúde de Diadema.
Food and Nutrition Surveillance System/SISVAN: getting to know
the feeding habits of infants under 24 months of age
Abstract The objective of the Food and Nutrition Surveillance System (SISVAN) is to monitor the food intake of individuals attended by the Brazil-ian Unified Health System (SUS). The objective of this research was to identify the feeding practices of children under 24 months of age who were at-tended at Primary Healthcare Units (UBS), us-ing SISVAN, and to assess the relationship with maternal sociodemographic profiles. A cross-sec-tional study was conducted in order to evaluate 350 children using the Food Consumption Mark-er Form of SISVAN, and matMark-ernal demographic data to identify sociodemographic profiles by ex-ploratory factor analysis. Of the children assessed, 41.1% were under 6 months of age and 98.7% of those between 6 and 23 months had an inade-quate intake. Two sociodemographic profiles were found: Profile 1 (mothers with lower income, less education, and recipients of the ‘Bolsa Família’ conditional family grant program) associated with the consumption of water/tea, cow’s milk and salty baby food; and Profile 2 (older moth-ers with many children and with a larger num-ber of residents in the household) associated with breast milk consumption (p = 0.048). The use of SISVAN made it possible to identify that children had inadequate feeding practices, and Profile 1 appears to be a risk profile for weaning.
Key words Nutritional surveillance, Breast-fed infant, Food consumption
Luciola de Castro Coelho 1
Leiko Asakura 2
Anita Sachs 1
Ingrid Erbert 3
Claudia dos Reis Lisboa Novaes 4
C
o
e
lho L
Introduction
The National Food and Nutrition Policy (Políti-ca Nacional de Alimentação e Nutrição; PNAN
2012)1 was instituted to improve the dietary,
nutritional and health status of the Brazilian population. Food and nutrition surveillance, the third PNAN directive, involves the collection, analysis and interpretation of data to determine individuals’ nutritional status and eating habits. Of special interest are children younger than 24 months, about whom data regarding the preva-lence of breastfeeding (BF) and exclusive breast-feeding (EBF); the introduction of complemen-tary feeding (CF); and diet quality, measured by the presence of fruits and vegetables, sodium, fats and simple sugars, are collected. The Food and Nutrition Surveillance System (Sistema de Vig-ilância Alimentar e Nutricional, SISVAN) was de-signed to monitor the nutritional status and food intake characteristics of individuals receiving care within the Public Health System (Sistema
Único de Saúde, SUS)2.
The nutritional status of children, especially those in the irst years of life, is considered the primary indicator of the health of this population because it reveals the environmental conditions to which they are exposed, including diet, illness, housing and basic sanitation conditions. It is also known that the nutritional status of children may be affected by maternal age and education level,
socioeconomic status and family structure3-5.
Improper eating habits or nutritional dei-ciencies may increase infant mortality rates be-cause these factors have a direct and immediate impact on children’s health and long-term con-sequences, including increased risk of chronic
noncommunicable diseases6.
Thus, city managers should identify and ad-dress situations of nutritional risk; collect food consumption data; and combine, monitor and assess food and nutrition indicators. They should also provide information to the healthcare
in-formation systems7 to support the mission of
PNAN 20121. To facilitate information sharing,
SISVAN-Web, operated by the Primary Health-care program (Atenção Primária à Saúde, APS), was created by the Brazilian Ministry of Health (Ministério da Saúde, MS) based on food intake
indicators provided by the System itself8.
The MS advocates surveillance at both com-munity and individual levels because long-term measures and immediate action are required at
both levels to address existing issues2. At a
com-munity level, some initiatives may take a longer
time to be implemented. At an individual level, however, they can be implemented almost im-mediately after identifying the issue because after the data are entered into the computer system, they can be analyzed and interpreted, and the ex-act location of the individual can be identiied, facilitating the efforts of Family Health teams
(equipes de Saúde da Família, eSF)2.
The eSF are a component of the Family Health Strategy (Estratégia de Saúde da Família), which aims to reorganize the APS through ex-pansion, training and consolidation. Its goal is to enhance the problem-solving capacity and im-prove the health status of individuals and
com-munities through regional healthcare9.
Identifying regions based on epidemiologi-cal and nutritional indicators provides a greater awareness and understanding of individuals’ so-cial context, which can improve response to and
resolution of identiied issues10. In addition, the
relationship between these indicators and mater-nal sociodemographic factors, which may lead to increased risk of health problems among the in-fant population, promotes rapid decision-mak-ing and prevention.
Therefore, the present study aimed to identi-fy the eating habits of children younger than 24 months who were treated at Primary Healthcare Units (Unidades Básicas de Saúde, UBS). The SIS-VAN was used to assess the relationship of these habits to maternal sociodemographic proiles.
Methods
This cross-sectional study was conducted in six UBS in the city of Diadema, a municipality of the State of São Paulo (SP), between April and De-cember 2012 in response to a request from the municipal Primary Healthcare Coordinator.
Di-adema has a land area of 30.840 km2; in 201011,
census data indicated that the total population of the city was 386,089 inhabitants, with a
popu-lation density of 12,519.10 inhabitants/km2. The
municipality has 20 UBS, including 96 eSF con-sisting of physicians, nurses, nursing technicians and assistants and community health agents (Agentes Comunitários de Saúde, ACS). The quar-terly average number of children younger than two years monitored by the six UBS during the study period was 833, according to the Primary Healthcare Information System.
collec-aúd
e C
ole
tiv
a,
20(3):727-738,
2015
tion participants in the Family Allowance Pro-gram (ProPro-grama Bolsa Família, PBF) were ana-lyzed. The children’s mothers or guardians were informed about the study, and those who con-sented to have their child participate in the study freely signed the Informed Consent Form when the data were collected.
The data were collected by nutritionists, ACS and other duly trained eSF professionals.
Data on maternal socioeconomic and de-mographic variables (age, education level, fam-ily status, famfam-ily income, PBF beneiciary status, number of living children, household size and housing conditions) and infant variables (gen-der, age and food intake) were collected. The data on food intake were collected using the Food Intake Markers for Children Younger Than Five
Years form, available through SISVAN8 and
SIS-VAN-Web and adapted by the author.
This form consists of questions about the sur-veyed child and is organized by age group: young-er than six months, between six months and two years and between two years and ive years.
The questions relevant to children younger than six months focus on breastfeeding practic-es and identify the type of complementary foods
currently offered to the infant8. The questions
de-signed for children between six months and two years gather data about the introduction of com-plementary feeding, identify the current type of feeding and assess the adoption of risk behaviors that lead to the development of iron-deiciency
anemia and childhood obesity8. Most questions
concerning both age groups refer to the day be-fore the survey.
The recommendations outlined in “Ten steps
to a healthy diet, 2nd edition”6 were used in each
question to classify food intake as either adequate or inadequate for both age groups. Step 1 (strict-ly breastfeeding until 6 months of age, without providing water, teas or any other foods) was the standard for children younger than six months. Steps 2 (slowly and gradually introducing other foods while maintaining breastfeeding from six months to two years or older), 3 (offering com-plementary foods, such as cereals, tubers, meat, legumes, fruits and vegetables three times a day, if the child is breastfeeding, after six months) and 8 (avoiding sugar, coffee, canned or fried foods, soft drinks, candy, salty snacks and other treats in the early years of life and using salt sparingly) were the standard for children between six and 24 months. Supplement V, which provides guid-ance on “Speciic weight control practices,” was also referred to.
Exploratory factor analysis was used to iden-tify the maternal sociodemographic proiles. A Kaiser-Meyer-Olkin (KMO) test was used to
as-sess the applicability of this method12; the result
was 0.52 (values close to 1 indicate a good it). Two main factors were further analyzed because together, they accounted for 35% of the total data variability; combined, the remaining factors accounted for only 14% of this variability. Factor rotation (varimax orthogonal rotation) was per-formed to assess which factors were independent from each other. Scores were generated for each factor following the rotation. These scores repre-sent the degree to which each factor differs from the average of each score (expressed as the stan-dard deviation); higher scores indicate greater adherence to the proile.
Central tendency (mean) and dispersion (standard deviation) measures were used for quantitative variables and absolute and relative frequencies were used for qualitative variables in the data description. Chi-square and Student’s t statistics were used, and the signiicance level was assumed to be equal to 5%. The sample size of the association analyses between the variables of interest varied according to the number of re-cords with complete data.
The statistical software Stata (10.0) was used in the data analysis.
This study’s authors declare no conlicts of interest. The study was approved by the Research Ethics Committee of the Federal University of São Paulo (Comitê de Ética em Pesquisa da Uni-versidade Federal de São Paulo).
Results
Of the 350 children included in the study, 51.7% were girls. The mean age was 11.3 months (stan-dard deviation = 7.1 months), and 68% were be-tween the ages of six and 23 months. Regarding maternal characteristics, 66.3% of the mothers were between 20 and 35 years of age, 58.4% had attended high school (dropped out/graduated) and 71.4% lived with a partner. Furthermore, 57.3% of the mothers lived with as many as four people, and 73.4% had a family income equal-ing as much as two minimum wages; 58.2% were not PBF beneiciaries, and 35.1% had one living child.
C
o
e
lho L
with more children and more household mem-bers (Proile 2).
The results of the survey showed that 56% of the children were being breastfed at the time of data collection. The prevalence of exclusive, predominant and complemented breastfeeding among children younger than six months (n = 112) was 41.1%, 9.8% and 30.4%, respectively. The prevalence of breastfeeding among children between six and 23 months old was 44.4%.
The results also showed that 58.0% of all children younger than six months had inad-equate nutrition intake for their age, and the most frequently consumed foods were water or tea (58.6%), infant formula (49.2%), cow’s milk (25%) and fruit juice (19%). Table 1 shows the
food intake the day before the data collection of all surveyed children younger than six months.
Among the children between six and 23 months old, 98.7% had inadequate diets, accord-ing to the guidelines for this age group. Among the children whose food intake was inadequate, the following items showed the highest frequency of inadequate levels: intake of juice or industri-alized soft drinks in the last month (60.8%), no breastfeeding during the previous day (56.9%), intake of porridge with milk or milk with thicken-er during the previous day (54.3%), intake of soft drink in the last month (54.2%), intake of salty porridge before six months of age (45.2%), hav-ing completed a meal watchhav-ing TV (33.3%) and eating sugar before six months of age (32.4%).
Variable Breastfeeding Yes No Total Water/tea Yes No Total Cow’s milk Yes No Total Infant formula Yes No Total Fruit juice Yes No Total Fruit Yes No Total Salty porridge Yes No Total Other foods Yes No Total n 45 9 54 19 34 53 8 46 54 16 37 53 6 47 53 3 51 54 4 50 54 -53 53 % 83.3 16.7 100 35.9 64.1 100 14.8 85.2 100 30.2 69.8 100 11.3 88.7 100 5.6 94.4 100 7.4 92.6 100 -100 100
Table 1. Number and percentage of children younger than six months by gender and dietary intake on the previous day. Diadema/SP, 2012.
p 0.525 0.484 0.842 0.552 0.801 0.119 0.357 0.073 Gender
Female Male Total
aúd e C ole tiv a, 20(3):727-738, 2015
Table 2 outlines the food intake characteris-tics the day before the data collection of children between six and 23 months old. A total of 55.6% of infants were not breastfed, 57.2% drank more than two glasses of non-human dry milk formu-la, 82.1% ate fruits, 74.1% ate legumes and vege-tables, 78.5% ate meat and 76.1% ate beans. Most children who were not fed beans (p < 0.01) or family meals at dinner (p < 0.01) but were breast-fed (p < 0.01) the previous day were between six and 11 months old.
The data on the introduction of foods to children between six and 23 months (Table 3) showed that 31.9% of children younger than six months were fed honey, sugar or molasses, and 44.4% were fed salty porridge. On average, 55.4% showed risk behaviors for obesity, with the excep-tion of eating while watching TV, which 67.4%
reported not doing. A comparison between age groups showed a signiicantly increased intake of soft drinks and processed juices and watching TV while eating among children between 12 and 23 months old, despite the already high intake of processed juices among children six to 11 months old (48.2%).
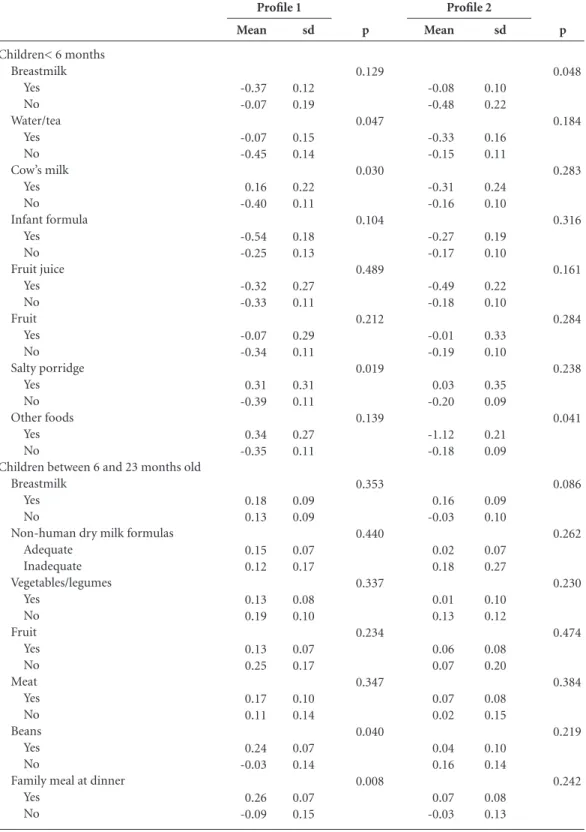
An analysis of the relationship between the sociodemographic proiles and dietary intake of children younger than six months (Table 4) showed that the mean value of the Proile 1 score was signiicantly higher among children fed wa-ter/tea (p = 0.047), cow’s milk (p = 0.030) and salty porridge (p = 0.019) than that observed among the children who were not fed such foods during the previous day. The mean value of the Proile 2 score was signiicantly higher among children breastfed on the previous day (p = 0.048)
Variable
Breastfeeding Yes No Total
Non-human dry milk formula More than two glasses Up to two glasses No intake Total Vegetables/legumes Yes No Total Fruit Yes No Total Meat Yes No Total Beans Yes No Total
Family meal at dinner Yes No Total n 53 31 84 44 13 25 82 58 20 78 63 18 81 59 22 81 49 32 81 47 34 81 % 63.1 36.9 100 53.7 15.8 30.5 100 74.4 25.6 100 77.8 22.2 100 72.8 27.2 100 60.5 39.5 100 58.0 42.0 100
Table 2. Number and percentage of children between six and 23 months old by age group and dietary intake on the previous day. Diadema/SP, 2012.
p 0.000 0.038 0.956 0.215 0.122 0.000 0.000 Age
6 to 11 months 12 to 23 months Total
C
o
e
lho L
and those who were not fed types of foods differ-ent from those previously introduced (p = 0.041).
Conversely, the mean value of the Proile 1 score of children between six and 23 months old who were fed beans (p = 0.040) and the family meal at dinner (p = 0.008) the previous day was signiicantly higher than the value of children not fed such foods (Table 4). No relationship be-tween Proile 2 and eating habits was observed in this age group.
No relationship was observed between pro-iles and introduction to foods or risk behaviors for obesity among children six to 23 months old.
Discussion
The use of the SISVAN protocol to assess the food intake of children younger than 24 months,
combined with the data collection performed by the eSF and the entry of these data into the computer system, renders the present study un-precedented because little of this information is currently available at the national, regional, and even municipal levels.
SISVAN generates data on the food and nu-trition status of the population, especially chil-dren younger than two years, using data collect-ed via the intake markers form. However, some
studies13,14 have found a low rate of food intake
data collection and inconsistent data entry into the System, which may result from a lack of po-litical commitment, the System’s complexity and the SISVAN’s exclusive technical and
administra-tive resources13.
Food intake data are scarce for the general population, as noted in the present study, and the inclusion of nutritionists in the APS is
inconsis-Variable
Intake of honey, sugar, molasses before six months
No Yes Total
Intake of salty porridge/family meal before six months
No Yes Total
Intake of processed juice/powdered drinks in the last month
No Yes Total
Intake of soft drinks in the last month No
Yes Total
Intake of porridge with milk or milk thickened with lour on the previous day
No Yes Total
Ate while watching TV on the previous day No
Yes Total
n
59 22 81
50 31 81
43 40 83
63 20 83
40 42 82
63 20 83
%
72.8 27.2 100
61.7 38.3 100
51.8 48.2 100
75.9 24.1 100
48.8 51.2 100
75.9 24.1 100
Table 3. Number and percentage of children between six and 23 months old by age group and characteristics of food introduction and feeding behaviors indicating obesity risk. Diadema/SP, 2012.
p
0.257
0.162
0.007
0.000
0.636
0.040 Age
6 to 11 months 12 to 23 months Total
n
95 50 145
75 69 144
48 95 143
44 102 146
66 79 145
96 57 153
%
65.5 34.5 100
52.1 47.9 100
33.6 66.4 100
30.1 69.9 100
45.5 54.5 100
62.8 37.2 100
n
154 72 226
125 100 225
91 135 226
107 122 229
106 121 227
159 77 236
%
68.1 31.9 100
55.6 44.4 100
40.3 59.7 100
46.7 53.3 100
46.7 53.3 100
aúd e C ole tiv a, 20(3):727-738, 2015
tent and insuficient; none of the UBS included in the study had such professionals on their staff.
The majority of professional nutritionists are involved only in the Support Center for Fami-Children< 6 months
Breastmilk Yes No Water/tea Yes No Cow’s milk Yes No Infant formula Yes No Fruit juice Yes No Fruit Yes No Salty porridge Yes No Other foods Yes No
Children between 6 and 23 months old Breastmilk
Yes No
Non-human dry milk formulas Adequate Inadequate Vegetables/legumes Yes No Fruit Yes No Meat Yes No Beans Yes No
Family meal at dinner Yes
No
Table 4. Means and standard deviations (sd) of the maternal socioeconomic proiles1 and 2 scores, based on the dietary intake of children between the ages of 0 and 23 months during the previous day. Diadema/SP, 2012.
C
o
e
lho L
ly Health (Núcleo de Apoio à Saúde da Família, NASF), which consists of professionals from var-ious ields who support the eSF professionals in
their healthcare practices7.
Therefore, because of the signiicance of food and nutrition surveillance and data to assessing nutrition and dietary status and implementing food and nutrition initiatives, food intake data
should be collected by healthcare professionals15
as part of their routine services.
The practice of collecting data for food and nutrition diagnosis by eSF professionals facil-itates the identiication of regional differences and risk groups, providing material for the op-eration of these teams, increasing their awareness and improving their services and
problem-solv-ing capabilities with regard to nutritional issues9.
Children were introduced to complementa-ry foods, typically water or tea and non-human milk, early in the present study. Most children between six and 23 months old were no longer breastfed; were insuficiently fed fruits, legumes/ vegetables, meats and beans; and were fed sugar, honey or molasses and salty porridge before six months. The most common inadequate feeding practices were the intake of processed juice or drinks, soft drinks, porridge with milk or milk with thickener.
Children’s eating habits are controlled by sev-eral factors. Socioeconomic, cultural and familial factors are especially inluential because children are still passive beings when new foods are intro-duced to their diets and are exclusively dependent
on their mother or guardian’s dietary choices16.
Some maternal factors assessed in isolation in the literature have been shown to be associated with the eating habits of young children. Ma-ternal primiparity, age, education level and job correlated with the intake of dairy and semi-sol-id meals in a study assessing infants between the
ages of six and 12 months17. Another study18
sug-gests that maternal education level has the great-est effect on the introduction of complementa-ry foods to a child’s diet in the irst year of life.
Other studies19,20 noted that the children of older
mothers, those working outside the home, and those with lower education levels were more like-ly to experience earlike-ly intake of solid foods.
A factor analysis of the maternal variables (social and environmental) was conducted to identify maternal risk proiles because food in-take has several determinants. The results suggest that the mothers described by Proile 1 (lower income rates, lower education levels and PBF beneiciaries) tend to introduce complementary
feeding early. Proile 2 mothers (older, with more children and larger household sizes) tend to breastfeed infants younger than six months. Con-versely, Proile 1 mothers tend to feed their six- to 23-month-old children beans and family meals at dinner. Children live in family contexts in which all of those factors are present. Therefore, knowing which combinations of factors further affect food intake and, consequently, nutritional status facilitates the development of adequate re-sponses to children’s health problems. No studies in the literature have applied factor analysis for the same purpose, precluding comparisons.
Children should be exclusively breastfed un-til six months of age and given complementary foods until two or more years old, according to the recommendations in “Ten steps to a healthy
diet”6. However, a low prevalence of EBF was
found in this study, similar to the levels found in
the PPAM 200921 (41.1% and 41.0%,
respective-ly). Nevertheless, despite the early introduction of other foods, the prevalence of breastfeeding in the study population was higher than that
observed in a national study5 (73.2% and 58.7%,
respectively) that analyzed data from infants be-tween 0 and 12 months old.
Several studies22-25 have also observed that
water/tea were the earliest complementary foods introduced, followed by fruits and non-human milk, among others, as observed in this study. The introduction of non-nutritious liquids, such as teas, before six months of age promotes the early interruption of breastfeeding and provides inadequate energy and nutrition, raising the
child’s morbidity risk24.
In this study, the frequency of non-human milk intake, with and without breastfeeding, among infants younger than six months was
lower than in other samples21,22,26; however, a
signiicant increase of non-human milk intake
occurred after six months. A systematic review27
that sought to identify the determinants of infant eating habits suggests that the early introduction of non-human milk (before 12 months) is relat-ed to low maternal relat-education level and low fami-ly socioeconomic status. A similar result was ob-served in the present study: mothers with lower education levels and lower income rates and who were PBF beneiciaries were signiicantly more likely to feed their children cow’s milk before they reached six months old. The intake of cow’s milk in the irst year of life is not recommended because it is nutritionally inadequate and may lead to negative consequences, such as the
aúd
e C
ole
tiv
a,
20(3):727-738,
2015
when breastfeeding is not possible, the best alter-native is modiied infant formula. The cost of this alternative is 3.3 times higher than the
expendi-ture of maintaining breastfeeding31. The cost of
using cow’s milk, however, is only 1.7 times high-er, explaining the prevalence of this choice.
Complementary foods should be introduced gradually and daily once the child reaches six months old. These foods must be healthy and varied and should include fruits, vegetables and legumes, meats or eggs and beans. Foods con-sidered to be risk factors for obesity, including sugar, soft drinks, and processed juices, should be
avoided in the irst years of life6,28. The
appropri-ate introduction of complementary foods tends to promote future healthy eating habits.
A high intake of foods considered healthy was observed in this study, although these levels were below the guideline values because the in-take should be 100% among children older than six months. Furthermore, the early introduc-tion of salty porridge and family meals (before six months) occurred in nearly half the children
studied, as found in the PPAM 200921. However,
food intake, including meat, beans and the family meal at dinner, signiicantly increased with age,
as was found in another study24.
Silveira and Lamounier22 also noted an
ear-ly and insuficient intake of healthy foods, in-cluding fruits, vegetables, rice, beans and meats, among children younger than 24 months, sug-gesting that such inadequate eating habits may be related to cultural factors, including the par-ents’ fear of feeding children between six and 12 months semi-solid or solid foods.
Saldiva et al.17 noted in their study of the
eat-ing habits of six- to 12-month-olds in the State of São Paulo that at six months, children were highly likely to be fed dairy-based meals, such as porridges and soups, and were less likely to be fed family meals.
The consistency of the salty porridge was not assessed in this study, although it should be pasty when irst introduced in complementary feeding and become increasingly solid as the child ages to reach the recommended energy density and meet
the child’s nutritional needs6,17,28,32. The intake
of the family meal at dinner was not prevalent among children between six and 12 months and occurred in three-fourths of the oldest children, indicating that it may be replaced by a non-hu-man milk-based meal. This practice may lead to nutritional deiciencies, especially of iron, because the meal containing foods rich in this
mineral has been suppressed. Other studies33-36
have also noted the prevalence of meals based on non-human milk, some of which are supple-mented with thickener, a practice also observed in this study. Thickeners are ultimately an energy supplement with low nutritional value.
As observed in this study, other research
studies37,38 have reported a high prevalence of the
early intake of sugar, soft drinks and processed juices among infants in the irst year of life. This may contribute to the establishment of unhealthy habits that persist into adulthood because chil-dren’s experiences in the irst ive years of life are crucial to the formation of preferences and food
aversions39.
The rates of watching TV while eating were signiicantly higher among the oldest children. This habit is concerning because it promotes excess weight in this age group, both because of its distracting nature and because it results in in-tensive exposure to obesogenic advertisements, which may affect food choices that contribute to
inadequate eating habits40.
The cross-sectional design of the study pre-cluded the identiication of the time of exposure to dietary risk or protection factors and its rela-tion to nutrirela-tional status.
The use of the SISVAN dietary intake mark-ers form to collect data precluded a comparison between intake and the nutritional recommen-dations for the age group, though it facilitated the identiication of intake trends. Moreover, no oth-er studies using this data collection instrument were found in the literature.
Furthermore, the form collects no data on the intake of foods with low nutritional value, including supplementation with sugar and thick-ener, among children younger than six months, though this practice is prevalent in everyday childcare. The lack of data on the consistency of foods fed to children younger than two years should also be noted because such information would indicate whether adequate energy
densi-ty has been achieved4. Moreover, the mean
du-ration of BF among children younger than two years of age and the prevalence of EBF among children between six months and two years could not be assessed because such data are collected by month and concern an event that occurred in the past; such data would therefore depend ex-clusively on maternal memory. Systematic food and nutrition surveillance is one way to gather more reliable information about such habits, as
proposed by the SISVAN8.
Currently, the dietary intake markers form is
C
o
e
lho L
some of the limitations of this study; however, it is premature to say that such changes will enable researchers to gather more information than the current form.
Notably, the ACS used the SISVAN to gath-er the data used in this study, as recommended by the Brazilian Ministry of Health. Although the SISVAN’s signiicant role in supporting health-promoting initiatives is recognized, this system has not been used to its full potential to generate information about one of the most im-portant determinants of health status.
Conclusion
This study identiies two maternal sociodemo-graphic proiles. The irst proile, comprising mothers with lower income rates, lower educa-tion levels and PBF beneiciaries, is apparently at risk for the early introduction of complementary foods.
Furthermore, infants between 0 and 23 months seen at the Diadema UBS included in
this study conclusively showed inadequate food intake. Weaning and the introduction of com-plementary feeding occurred early; the intake of fruits, legumes/vegetables, meats and beans was insuficient; and inadequate feeding practices, including the intake of processed juices or soft drinks, sodas, porridge with milk or milk thick-ened with lour, were common.
This study shows the feasibility of conduct-ing food and nutrition surveillance in prima-ry healthcare and generating data and research studies based on the SISVAN, which includes key components for the assessment of child nutri-tion, despite the aforementioned limitations of the instrument used.
Early identiication of unhealthy eating hab-its through the use of SISVAN by all eSF profes-sionals, combined with the implementation of public food and nutrition policies promoting breastfeeding and the timely and adequate intro-duction of complementary feeding and healthy eating habits, may improve the behavior of those responsible for infant feeding, thus improving the eating habits of the study population.
Collaborations
aúd
e C
ole
tiv
a,
20(3):727-738,
2015
Saldiva SRDM, Escuder MM, Mondini L, Levy RB, Venancio SI. Feeding habits of children aged 6 to 12 months and associate maternal factors. J Pediatr 2007; 83(1):53-58.
Corrêa EN, Corso ACT, Moreira EAM, Kazapi IAM. Complementary feeding and maternal characteristics of children younger than two years old in Florianó-polis, Santa Catarina, Brazil. Rev Paul Pediatr 2009; 27(3):258-264.
Silva LMP, Venancio SI, Marchioni DML. Práticas de alimentação complementar no primeiro ano de vida e fatores associados. Rev Nutr 2010; 23(6):983-992. Simon VGN, Souza JMP, Souza SB. Introdução de ali-mentos complementares e sua relação com variáveis demográicas e socioeconômicas, em crianças no pri-meiro ano de vida, nascidas em Hospital Universitário no município de São Paulo. Rev Bras Epidemiol 2003; 6(1):29-38.
Brasil. Ministério da Saúde (MS). II Pesquisa de Preva-lência de Aleitamento Materno nas Capitais Brasileiras
e Distrito Federal – II PPAM 2009. Brasília: MS; 2009.
Silveira FJF, Lamounier JA. Prevalência do aleitamento materno e práticas de alimentação complementar em crianças com até 24 meses de idade na região do Alto Jequitinhonha, Minas Gerais. Rev Nutr 2004; 17(4): 437-447.
Modesto SP, Devincenzi MU, Sigulem DM. Práticas ali-mentares e estado nutricional de crianças no segundo semestre de vida atendidas na rede pública de saúde.
Rev Nutr 2007; 20(4):405-415.
Parada CMGL, Carvalhaes MABL, Jamas MT. Práticas de alimentação complementar em crianças no primei-ro ano de vida. Rev Latino-am Enfermagem 2007 [aces-sado 2014 set 9]; 15(2): [cerca de 8 p.]. Disponível em: www.eerp.usp.br/rlae
Simon VGN, Souza JMP, Souza SB. Aleitamento mater-no, alimentação complementar, sobrepeso e obesidade em pré-escolares. RevSaude Publica 2009; 43(1):60-69. Bortolini GA, Vitolo MR, Gubert MB, Santos LMP. Early cow’s milk consumption among Brazilian chil-dren: results of a national survey. J Pediatr 2013, 89(6):608-613.
Wijndaele K, Lakshman R, Landsbaugh JR, Ong KK, Ogilvie D. Determinants of early weaning and use of unmodiied cow’s milk in infants: a systematic review. J
Am Diet Assoc 2009;109(12):2017-2028.
Brasil. Ministério da Saúde (MS). Saúde da criança: nutrição infantil: aleitamento materno e alimentação
complementar. Brasília: MS; 2009.
Brasil. Ministério da Saúde (MS), Organização Pan-A-mericana da Saúde. Guia alimentar para crianças
meno-res de 2 anos de idade. Brasília: MS; 2006.
Sociedade Brasileira de Pediatria (SBP). Manual de orientação para a alimentação do lactente, do
pré-esco-lar, do escopré-esco-lar, do adolescente e na escola. 3ª Edição. Rio
de Janeiro: SBP; 2012.
Barbosa MB, Palma D, Bataglin T, Taddei JAAC. Cus-to da alimentação no primeiro ano de vida. Rev Nutr
2007; 20(1):55-62. 17.
18.
19.
20.
21.
22.
23.
24.
25.
26.
27.
28.
29.
30.
31. References
Brasil. Ministério da Saúde (MS). Política Nacional de
Alimentação e Nutrição. Brasília: MS; 2012.
Brasil. Ministério da Saúde (MS). Indicadores de
Vi-gilância Alimentar e Nutricional: Brasil 2006. Brasília:
MS; 2009.
Damasceno RJP, Martins PA, Devincenzi MU. Estado nutricional de crianças atendidas na rede pública de saúde do município de Santos. Rev Paul Pediatr 2009; 27(2):139-147.
Cocetti M, Taddei JAAC, Konstantyner T, Konstantyner TCRO, Barros Filho AA. Prevalence and factors asso-ciated with overweight among Brazilian children youn-ger than 2 years. J Pediatr 2012; 88(6):503-508. Vitolo MR, Gama CM, Bortolini GA, Campagnolo PDB, Drachler ML. Some risk factors associated with overweight, stunting and wasting among children un-der 5 years old. J Pediatr 2008; 84(3):251-257. Brasil. Ministério da Saúde (MS). Dez passos para uma alimentação saudável: guia alimentar para menores de dois anos: um guia para o profissional da saúde na
aten-ção básica. Brasília: MS; 2010.
Brasil. Ministério da Saúde (MS). Matriz de ações de
alimentação e nutrição na atenção básica de saúde.
Bra-sília: MS; 2009.
Brasil. Ministério da Saúde (MS). Protocolos do Sistema de Vigilância Alimentar e Nutricional – SISVAN na
as-sistência à saúde. Brasília: MS; 2008.
Jung NM, Bairros FS, Neutzling MB. Utilização e co-bertura do Sistema de Vigilância Alimentar e Nutricio-nal no Estado do Rio Grande do Sul, Brasil. Cien Saude
Colet 2014; 19(5):1379-1388.
Mais LA, Domene SMA, Barbosa MB, Taddei JAAC. Diagnóstico das práticas de alimentação complemen-tar para o matriciamento das ações na Atenção Básica.
Cien Saude Colet 2014; 19(1):93-104.
Instituto Brasileiro de Geograia e Estatística (IBGE).
Cidades@. [acessado 2012 mar 8]. Disponível em: http://
www.ibge.gov.br/cidadesat/link.php?codmun=351380 Gimeno SGA, Andreoni S, Ferreira SRG, Franco LJ, Cardoso MA. Assessing food dietary intakes in Japane-se-Brazilians using factor analysis. CadSaude Publica
2010; 26(11):2157-2167.
Venâncio SI, Levy RB, Saldiva SRDM, Mondini L, Stefa-nini MLR. Sistema de vigilância alimentar e nutricional no Estado de São Paulo, Brasil: experiência da imple-mentação e avaliação do estado nutricional de crianças.
Rev. Bras. Saude Mater. Infant. 2007; 7(2):213-220.
Ferreira CS, Cherchiglia ML, César CC. O Sistema de Vigilância Alimentar e Nutricional como instrumento de monitoramento da Estratégia Nacional para Ali-mentação Complementar Saudável. Rev. Bras. Saude
Mater. Infant. 2013; 13(2):167-177.
Fundo das Nações Unidas para a Infância (Unicef). Sis-tema de Vigilância Alimentar e Nutricional: Orientações
para implementação nos municípios. Brasília: Ministério
da Saúde; 2010.
Torigoe CY, Asakura L, Sachs A, Demézio da Silva CV, Abrão ACFV, Santos GMS, Coelho LC. Inluence of the nutritional intervention in complementary feeding practices in infants. J Hum Growth Dev 2012; 22(1):85-92.
1. 2.
3.
4.
5.
6.
7.
8.
9.
10.
11.
12.
13.
14.
15.
C
o
e
lho L
Dias MCAP, Freire LMS, Franceschini SCC. Recomen-dações para alimentação complementar de crianças menores de dois anos. Rev Nutr 2010; 23(3):475-486. Oliveira LPM, Assis AMO, Pinheiro SMC, Prado MS, Barreto ML. Alimentação complementar nos primeiros dois anos de vida. Rev Nutr 2005; 18(4):459-469. Garcia MT, Granado FS, Cardoso MA. Alimentação complementar e estado nutricional de crianças me-nores de dois anos atendidas no Programa Saúde da Família em Acrelândia, Acre, Amazônia Ocidental Bra-sileira. CadSaude Publica 2011; 27(2):305-316. Palmeira PA, Santos SMC, Vianna RPT. Prática ali-mentar entre crianças menores de dois anos de idade residentes em municípios do semiárido do Estado da Paraíba, Brasil. Rev Nutr 2011; 24(4):553-563. Lindsay AC, Machado MT, Sussner KM, Hardwick CK, Peterson KE. Infant-feeding practices and beliefs about complementary feeding among low-income Brazi-lian mothers: a qualitative study. Food Nutr Bull 2008; 29(1):15-24.
Caetano MC, Ortiz TTO, Silva SGL, Souza FIS, Sarni ROS. Complementary feeding: inappropriate practices in infants. J Pediatr 2010; 86(3):196-201.
Campagnolo PDB, Louzada MLC, Silveira EL, Vitolo MR. Práticas alimentares no primeiro ano de vida e fatores associados em amostra representativa da cida-de cida-de Porto Alegre, Rio Grancida-de do Sul. Rev Nutr 2012; 25(4):431-439.
Farias Júnior G, Osório MM. Padrão alimentar de crian-ças menores de cinco anos. Rev Nutr 2005;18(6):793-802. Rossi CE, Albernaz DO, Vasconcelos FAG, Assis MAA, Di Pietro PF. Inluência da televisão no consumo ali-mentar e na obesidade em crianças e adolescentes: uma revisão sistemática. Rev Nutr 2010; 23(4):607-620. Brasil. Ministério da Saúde (MS). Secretaria de Atenção à Saúde. Departamento de Atenção Básica. Nota Téc-nica de 23 de dezembro de 2013. Assunto: Avaliação de marcadores do consumo alimentar e registro nos Sistemas
de Informação da Atenção Básica. [acessado 2014 set 9].
Disponível em: http://189.28.128.100/dab/docs/portal-dab/notas_tecnicas/nt_consumo_alimentar.pdf
Article submitted on 10/10/2014 Accepted for publication of 12/13/2014 Final version submitted on 12/15/2014 32.
33.
34.
35.
36.
37.
38.
39. 40.