Effect of additional filtration on radiation doses
and image quality in videofluoroscopic studies*
Efeito da filtração adicional nas doses de radiação e na qualidade das imagens nos exames videofluoroscópicosMilton Melciades Barbosa Costa1, João Luiz Leocadio da Nova2, Lucía Viviana Canevaro3
OBJECTIVE: The purpose of thys study was to investigate the effect of the addition of aluminum (1 mm) and copper (0.4 mm) filters on effective radiation doses and image quality in videofluoroscopy. MATERIALS AND METHODS: An ionization chamber coupled with an electrometer was added to x-ray tube to measure the kerma area product with 65 kV and 0.7 mA technique, without and with additional filtration. Low contrast, gray scale and spatial resolution were measured utilizing Leeds test objects. Fifteen volunteers underwent pharynx study, ten without and five with aluminum and cooper filters associated, and had the kerma area product/minute compared. RESULTS: The specified filters addition, either separated or associated, allowed an expressive decrease in kerma area product besides an actual improvement in the videofluoroscopic images quality determined by a better gray tones differentiation and increased brightness contrast ratio in the gray curve. CONCLUSION: Additional aluminum and copper filters interposition, especially when associated, results in improved image quality with expressive reduction in the required radiation doses.
Keywords: Videofluoroscopy; Kerma area product; X-ray; Radiological image; Radiation dose.
OBJETIVO: Investigar o efeito da adição de filtros de alumínio (1 mm) e cobre (0,4 mm) na redução das doses efetivas de radiação e na qualidade das imagens em exames videofluoroscópicos. MATERIAIS E MÉTODOS: Ao tubo de raios X adicionou-se câmara de ionização conectada a um eletrômetro para medir o produto kerma-área, com técnica de 65 kVp e 0,7 mA, sem e com adição dos filtros. Foi medida resolução espacial, a de baixo contraste e tons de cinza, utilizando os objetos de teste de Leeds. Quinze voluntários tiveram o produto kerma-área/minuto do estudo faríngeo comparados, dez com filtração e base e cinco com adição dos filtros associados. RESULTADOS: A adição dos filtros separados ou associados produziu expres-siva redução do produto kerma-área, com ganho na qualidade das imagens videofluoroscópicas determinado pela maior separação dos tons de cinza e aumento da relação brilho/contraste da curva de cinza. CONCLU-SÃO: A interposição adicional de filtros de alumínio e cobre, em especial quando associados, melhora a qualidade das imagens, com expressiva redução das doses de radiação necessárias à sua geração.
Unitermos: Videofluoroscopia; Produto kerma-área; Raios X; Imagem radiológica; Dose de radiação.
Abstract
Resumo
* Study developed at Laboratório de Motilidade Digestiva e Imagem do Instituto de Ciências Biomédicas do Centro de Ciên-cias da Saúde da Universidade Federal do Rio de Janeiro (ICB/ CCS-UFRJ), Rio de Janeiro, RJ, Brazil. Financial support: Funda-ção Educacional Charles Darwin.
1. PhD, Titular Professor in charge of Laboratório de Motilidade Digestiva e Imagem do Instituto de Ciências Biomédicas do Centro de Ciências da Saúde da Universidade Federal do Rio de Janeiro (ICB/CCS-UFRJ), Rio de Janeiro, RJ, Brazil.
2. PhD in Sciences of Communication, Associate Professor at Universidade Federal Fluminense (UFF), Niterói, RJ, Brazil.
3. PhD, Physicist at Instituto de Radioproteção e Dosimetria/ Comissão Nacional de Energia Nuclear (IRD/CNEN), Rio de Ja-neiro, RJ, Brazil.
exposures. In the study of swallowing and related disorders, the method is considered and accepted as the best one amongst the available ones for the diagnosis and follow-up of dysphagias(6–9). Radiation doses
em-ployed in the performance of such exami-nations are considered to be low or totally acceptable, considering the amount of in-formation that the method provides. How-ever, it is important to know the doses ad-ministered to the patient, besides imple-menting measures for optimization of the practice(2,4,10–12).
If appropriately prescribed, radiological examinations produce invaluable informa-tion for disorders diagnosis and follow-up. However, the benefits from the use of x-rays should not lead to an attitude of under-Costa MMB, Nova JLL, Canevaro LV. Effect of additional filtration on radiation doses and image quality in videofluoroscopic studies. Radiol Bras. 2009;42(6):379–387.
exposure both for technicians and pa-tients(2–5). The transition from the
visualiza-tion of the images on a fluoroscopic screen in a totally dark room to the visualization on a television monitor, besides the doses reduction, represented the birth of video-fluoroscopy.
Videofluoroscopy allows the recording of fluoroscopic images on magnetic media. Its value resides in the feasibility of real-time analysis and reanalysis of the recorded dynamics, without the need for additional
Mailing address: Dr. Milton M.B. Costa. Laboratório de Moti-lidade Digestiva e Imagem, Departamento de Anatomia, ICB/CCS/ UFRJ. Cidade Universitária, Ilha do Fundão. Rio de Janeiro, RJ, Brazil, 21941-590. E-mail: [email protected]
Received May 12, 2009. Accepted after revision August 27, 2009.
INTRODUCTION
TV fluoroscopy has replaced dark room fluoroscopy(1,2). The use of image
estimating their risks. The International Commission on Radiological Protection (ICRP Publication 103)(13) understands
that when the benefits of the radiological examination are clinically justifiable, the associated radiation exposure risks are ac-ceptable. The general foundations of ra-diological protection define as one of its main objectives, the determination of an acceptable level of radiation exposure, without unduly limiting the benefits of the use of x-radiation. However, the magni-tude of such doses shall be kept as low as reasonably feasible. Dose limits are not ap-plicable in cases of medical patient’s ex-posure; for such individuals, diagnostic reference levels are utilized. The dose ref-erence level shall be the lowest sufficient exposure to obtain the required informa-tion for the indicainforma-tion and allowed by the appropriately proposed radiological ex-amination(13–16).
Due to the fact that no radiologic equip-ment has been specifically developed for this method, videofluoroscopy relies on apparatuses such as seriography and an-giography units, and C-arms, all of them in principle developed for other types of ex-aminations. Aluminum filters coupled with the x-ray tubes of such equipment filter the low-intensity radiation and attenuate higher intensity radiations, concentrating the in-tensity levels of the primary beam on the desired radiation range.
In specific cases, an increase in filtra-tion may be desirable in order to eliminate low energy photons, which is not done in equipment designed for multiple types of exams. The recommendation is that the total filtration in radiological diagnostic equipment be of at least 2.5 mm of alumi-num equivalent(17,18).
The relevance of additional filtration of the main x-ray beam was highlighted by Watanabe(19) as one of the primary means
of reducing the radiation exposure dose for radiodiagnosis, and the author further ob-serves that, with additional filtration pro-duced by 0.08 mm of copper, one obtains radiographic images with a 14% smaller radiation dose, with the same quality of films that received a 2.00 mm of aluminum filtered radiation dose.
Nicholson et al.(20) have obtained a dose
reduction between 75% and 80% by
re-moving the antiscattering grid and using additional filtration of 0.7 mm steel.
Morrell et al.(21) have identified, in
barium enema, a mean dose reduction in the order of 57% (from 17.7 Gy.cm2 to 7.6
Gy.cm2) by using additional filtration with
0.3 mm of copper. They also report that they did not observe any significant image degradation using the Leeds TO10 test object, with the radiological images being analyzed by a specialized radiologist.
Haiter(22), utilizing filters made from
aluminum and zinc alloys in dental x-ray apparatuses, have obtained a decrease in air kerma rate of up to 18.53%, without changes in the films contrast. Gonçalves(23),
on dental radiographic films, have ob-served a reduction of air kerma rate of up to 47.33% in relation to the aluminum fil-ter, with the same level of images contrast. Similarly, still with copper and aluminum alloy, Bóscolo et al.(24) have observed a
sig-nificant reduction of the air kerma rate without a comparable loss of images con-trast.
The objective of the present study was to investigate, on videofluoroscopic se-quences, the effect of adding aluminum and copper filters at the window of the x-ray tube, and evaluating the radiation dose re-duction as well as the images quality using Leeds test objects at videofluoroscopic studies of the cervical region in volunteers.
MATERIALS AND METHODS
The baseline equipment utilized was a Philips BV 22 C-arm (Philips; Holland) with a 100 kV, 20 mA maximum intensity bulb, Philips LR24424 intensifier (Philips; Holland), total nominal filtration of 2.5 mm of aluminum equivalent and 2.4 mm focal point, two-pulse rectification, fixed anode and 10° angle. The TV system of the equip-ment is of black & white type, based on the NTSC standard, comprising a black & white 20” Philips monitor (Philips; Hol-land) and a black & white CCD Sony Mythos B/W (Sony; USA) camera (0.1 lux; f = 3.6mm; 400-line resolution) coupled with the image intensifier.
The following devices were coupled with the baseline equipment: a VHS Pana-sonic NV-MV 40 video recorder (PanaPana-sonic; Brazil); a Philips DVD recorder DVDR
3455H (Philips; USA); a color 13” Pana-sonic CT-1383VY monitor (PanaPana-sonic; Mexico).
The images generated by the radiologi-cal equipment are captured on a video out-put (BNC) of the black & white monitor and directed for simultaneous analogical recording (VHS) and digital recording (DVD), with control images being dis-played on the color monitor screen.
To the x-ray tube cone a Diamentor M2 PTW (PTW; Freiburg, Germany) a con-nected ionization chamber was added to measure the kerma-area product (KAP), a quantity defined as the product of the ra-diation quantity emitted by the x-ray tube by the irradiated area(25,26). Additional
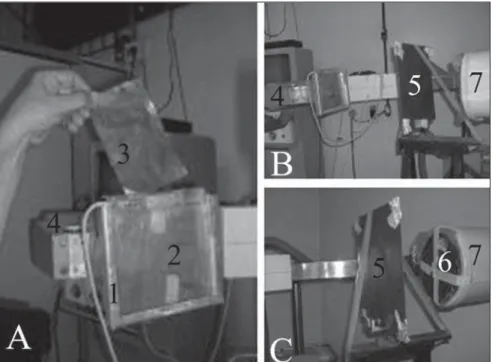
alu-minum and copper filters were alternatively placed before the ionization chamber, with the objective of evaluating the additional filtration effect. In this equipment, the size of the radiation field was maintained fixed by the collimation system (Figure 1).
KAP and Leeds test objects
The KAP measurement was performed with the technique of 65 kV (2.4 mmAl half-value layer) and 0.7 mA (nominal), as well as the spatial resolution evaluation, low-contrast and gray scale evaluation, using the TOR(TVF), TO10 and GS2 Leeds test objects(27).
The free space between the tube cone and the external surface of the image inten-sifier is 80 cm. In order to measure KAP, a 1 mm thick copper plate was placed at 60 cm from the external surface of the cone, which had been modified for the insertion of the ionization chamber, however keep-ing its original dimensions. This plate simulates the attenuation that would be produced by an adult weighting 70 kg and also serves as a protection for the image intensifier.
Figure 1. Illustration of the procedure. A: The metal housing is identified (1) where the ionization cham-ber is inserted (2), additional copper filter (3) and x-ray tube (4). B: One observes the interposition of the 1 mm copper plate (5) between the x-ray tube (4) and the image intensifier (7). C: The 1 mm copper plate (5) and one of the Leeds objects (6) are highlighted, attached to the anterior surface of the image intensifier (7).
irradiation time utilized in the four situa-tions was (127 ± 1) seconds, a long and continuous time sufficient for obtaining the KAP values in a way to express similarities or differences in a reliable manner.
In order to evaluate spatial and low con-trast resolution, the Leeds TOR(TVF) and TO10 test objects were attached, one at a time, to the entry surface of the image in-tensifier. The spatial resolution was evalu-ated by identification of the group of line pairs up to the point where the lines of the test object (Figure 2) were distinct(28). The
low contrast resolution was analyzed by the identification of the different circles that could be visualized in relation to the density of the plate containing them (background) (Figure 3). Because of the evaluation of the image quality in terms of spatial resolution and low contrast were performed with test objects with semi-quantitative characteris-tics, the evaluations were simultaneously carried out by three observers.
The gray tones were analyzed on images obtained from rectangular gray scales con-tained in the center of the GS2 Leeds test object (Figure 4). The object was placed in the entry of the image intensifier and was irradiated with the 65 kV and 0.7 mA
tech-Figure 3. TO10 Leeds test object (touched up frame) comprises discs with decreasing dimensions, and increasingly less distinctive densities from the background, organized into four groups. Each group presents three lines with nine discs that vertically decrease in dimensions and horizontally in contrast differentiation. Each one of the nine disc lines of the group (G1) is identified, literally, as A, B, C, from the largest to the smallest. The group (G2) allows the visualization of the decreasing discs D, E, F; the group (G3), G, H, I; and the group (G4), in the center of the field, practically undistinguishable from the background, the discs J, K, L. The number of discs identified by line on the images corresponds to percentage correlations based on a table which defines the low contrast ratio.
Figure 2. Part of the TOR(TVF) Leeds test object for semi-quantitative evaluation of spatial resolu-tion. A: 21 different sets of line pairs whose values of line pairs by millimeter (LP/mm) are defined on
B. Line pairs on A and values on B correspond to each other when seen from left to right and from top down. The digit 8 inserted on A identifies the 8th set of line pairs, corresponding to the limit that could be identified and, on B, the corresponding number of line pairs per millimeter.
nique, generating an image with different gray tones for each density level on value scale visualized in steps. These values were obtained by the analysis of the video sig-nal by using the luminance histogram analysis function of software Adobe Photoshop® 5.5 (Adobe; USA). Separate
measurements were performed for each of the gray tones in 460-pixel samples of the video signal, corresponding to each density of the rectangular bar. On each histogram the software calculates and provides the standard deviation for the measurement, expressing the dispersion around the mean level. The analysis for the entire bar was repeated for the four filtering situations. Data were recorded on a Microsoft Office Excel® 2003 (Microsoft Corp.; USA)
worksheet, allowing the generation of graphs in a logarithmic scale. The lumi-nance analysis of the video signal for de-termined areas was also utilized for the ten-step sets in the different filtration condi-tions, in 17,995 pixels samples related to the video signal of the capture of the whole rectangular bar.
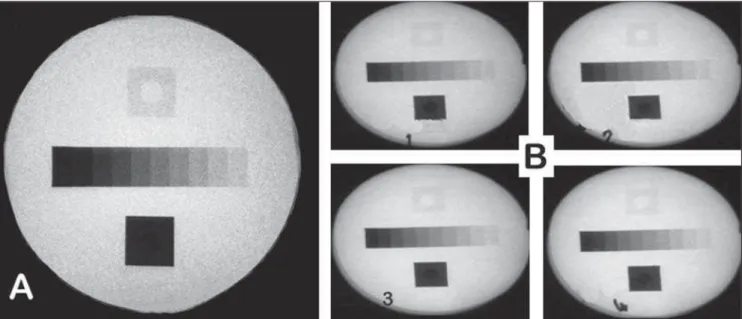
Figure 4. A: GS2 Leeds object (touched up frame). B: Images obtained in the pause function of videofluoroscopic studies resulting from filtration situations 1, 2, 3, and 4.
Table 1 KAP and spatial resolution in the four filtration conditions with the 65 kV and 0.7 mA techni-que. Lists the exposure time for each one of the filtration conditions, showing a gradual and remarkable KAP reduction and its relative percentage, considering the inherent filtration with the 100% value. Spa-tial relation data demonstrate the absence of interference from the different filtrations.
Filtration
Inherent
Inherent + 1 mmAl
Inherent + 0.4 mmCu
Inherent + 1 mmAl + 0.4 mmCu Time
(s)
128
128
126
125
KAP (cGy.cm2)
532
346
271
205
Relative KAP percentage
100%
65%
51%
39%
Spatial resolution (group / lp/mm)
8 / 1.12
8 / 1.12
8 / 1.12
8 / 1.12
Al, aluminum; Cu, copper; lp/mm, line pairs/millimeter.
and Engineering Medicine; UK)(29) was
utilized for analyzing x-ray spectra with a 65 keV peak.
The volunteers
The pharynx of 15 male volunteers with ages between 27 and 56 years were evalu-ated. The individuals, all of them profes-sional wind musicians, were submitted to videofluoroscopic study for morpho-func-tional analysis of the pharyngeal dynamics during effort.
Such project was approved by the Com-mittee for Ethic in Research of the institu-tion in compliance with the standards pro-posed by the World Medical Association (WMA Helsinki Declaration, Finland, 1995, supplemented by the 52nd WMA General Assembly, Edinburgh, United Kingdom, 2000, with amendments in Washington, 2002 and Tokyo, 2004). The musicians’ pharynges were evaluated on left lateral and anteroposterior views, with the same equipment utilized for KAP mea-surements and studies with the Leeds test objects. Ten of the volunteers had already had their pharynx previously evaluated at the baseline conditions of the equipment, without additional filtration, and with the exposure time and KAP recorded by the PTW-Diamentor M2 electrometer (PTW; Freiburg, Germany) coupled with the C-arm. The remaining five volunteers were submitted to the same protocol, except for
the association with aluminum (1 mm) and copper (0.4 mm) filtration. The examina-tion times were similar in most cases. How-ever, for the benefit of standardization, the KAP per minute of examination time (KAP rate) was considered for each patient.
RESULTS
KAP and Leeds test objects
Table 1 demonstrates the technique (65 kV, 0.7 mA) and the x-radiation exposure time (in seconds) with the four proposed filtration conditions, observing the KAP (cGy.cm2) and spatial resolution (TOR
(TVF) Leeds object) variations. Table 2 demonstrates the technique, exposure time and filtration conditions for observation of the variations in low-contrast ratio (TO10 Leeds object).
The graphic on Figure 5 was obtained with the Report 78 SRS-780(29) software
demonstrating the different x-ray spectra with 65 keV peak for the different filtra-tions. One observes the elimination of low-energy x-ray photons, as well as the beam hardening (dislocation of the spectrum peak to higher energies, with higher beam penetration).
Table 3 Lists the mean luminance values and standard deviations for each one of the ten gray levels (steps) of the GS2 Leeds test object, produced with 65 kV and 0.7 mA technique, for the four different filtration levels, obtained from the analysis of the histogram of a single area containing 460 pixels in each one of the steps by means of the Adobe Photoshop 5.5 luminosity channel.
Gray levels 1 2 3 4 5 6 7 8 9 10 Luminance Inherent
34.6 ± 4.7
45.5 ± 4.3
73.1 ± 3.8
99.2 ± 3.0
118.5 ± 3.4
136.7 ± 3.5
152.5 ± 2.9
167.6 ± 3.4
179.0 ± 3.6
183.7 ± 4.9 % SD 14% 9% 5% 3% 3% 3% 2% 2% 2% 3% Inherent + 1 mmAl
38.1 ± 4.9
53.2 ± 3.8
82.0 ± 4.7
106.1 ± 3.8
126.3 ± 4.1
145.6 ± 3.1
160.6 ± 3.8
177.3 ± 3.3
189.7 ± 3.8
195.9 ± 3.8 % SD 13% 7% 6% 4% 3% 2% 2% 2% 2% 2% Inherent + 0.4 mmCu
36.1 ± 4.8
50.6 ± 3.4
78.3 ± 3.3
104.9 ± 3.5
124.4 ± 4.0
143.3 ± 2.9
160.2 ± 3.5
177.4 ± 4.1
189.7 ± 3.3
195.5 ± 3.5 % SD 13% 7% 4% 3% 3% 2% 2% 2% 2% 2% Inherent + 1 mmAl + 0.4 mmCu
38.9 ± 3.9
54.4 ± 3.9
83.6 ± 4.5
109.0 ± 3.4
130.3 ± 3.4
148.9 ± 3.1
165.8 ± 3.6
181.9 ± 4.2
196.3 ± 3.2
200.2 ± 4.1
% SD 10% 7% 5% 3% 3% 2% 2% 2% 2% 2%
Al, aluminum; Cu, copper; SD, standard deviation.
Table 2 Low-contrast resolution (expressed in percentage) obtained from the identification of discs (objects) of different sizes in relation to the background contrast. This percentage is obtained from a table that correlates dimension and density of the discs observed on each line of each one of the groups (TO10 Leeds test object). Notice that percentages obtained for low contrast either do not change or improve with the additional filtration.
Filtration
Inherent
Inherent + 1 mmAl
Inherent + 0.4 mmCu
Inherent + 1 mmAl + 0.4 mmCu
Group (G1) % Group (G2) % Group (G3) % Group (G4) %
A B C A B C A B C A B C 4.5 3.2 3.2 4.5 3.2 3.2 4.5 4.5 4.5 6.6 4.5 6.6 4.5 4.5 6.6 4.5 4.5 4.5 4.5 4.5 6.6 4.5 6.6 8.6 D E F D E F D E F D E F G H I G H I G H I G H I 12.3 12.3 – 8.6 12.3 – 8.6 16 – 12.3 23 – J K L J K L J K L J K L – – – – – – – – – – – –
Al, aluminum; Cu, copper.
The gray tone histogram of the rectan-gular bar contained in the Leeds GS2 test object, allows the visualization, for each one of the different filtrations, the enhance-ment of the separation between the gray levels of each step, when one compares the histogram without filtration with the addi-tional filtration histogram, respectively at the left and at the right on Figure 7.
The volunteers
The KAP measurements, total and per minute, obtained in the evaluation of the volunteers submitted to pharyngeal videofluoroscopy without additional filtra-tion, are shown on Table 4, and those with additional filtration (copper + aluminum), on Table 5.
Table 4 Total KAP and KAP/minute without additional filtration. Demonstrates the time spent in video-fluoroscopic study of the pharynx, with KAP dose and respective KAP rates with inherent filtration and without additional filters.
Volunteers
1 – R.G.C.
2 – C.A.C.
3 – A.S.S.
4 – C.M.M.
5 – R.M.
6 – C.A.
7 – E.R.L.
8 – J.R.
9 – J.L.O.
10 – L.F.
Mean
Time (min)
3.7 ± 0.1
8.4 ± 0.1
2.7 ± 0.1
3.8 ± 0.1
3.3 ± 0.1
4.0 ± 0.1
4.2 ± 0.1
1.8 ± 0.1
3.1 ± 0.1
7.2 ± 0.1
4.2 ± 0.6
KAP (cGy.cm2)
1897 ± 57
4514 ± 135
1554 ± 47
2543 ± 76
1627 ± 49
1814 ± 54
2877 ± 86
1171 ± 35
1632 ± 49
3027 ± 91
2265 ± 315
KAP rate (cGy.cm2/min)
512 ± 20
537 ± 17
575 ± 29
669 ± 27
493 ± 20
453 ± 18
685 ± 27
650 ± 39
526 ± 21
420 ± 13
522 ± 29
Table 5 Total KAP and KAP/minute with additional aluminum and copper filtration. Demonstrates the time spent in videofluoroscopic study of the pharynx, with KAP dose and respective KAP rates with inhe-rent filtration and with additional filtration.
Volunteers
1 – W.R.B.
2 – M.S.M.
3 – F.A.F.
4 – H.L.F.
5 – L.P.F.
Mean
Time (min)
3.4 ± 0.1
2.6 ± 0.1
2.2 ± 0.1
1.5 ± 0.1
1.6 ± 0.1
2.3 ± 0.4
KAP (cGy.cm2)
347 ± 10
237 ± 7
233 ± 7
139 ± 4
209 ± 6
233 ± 33
KAP rate (cGy.cm2/min)
102 ± 4
91 ± 4
105 ± 6
92 ± 7
130 ± 9
104 ± 5
Figure 6. Graphic of the logarithmic curve of the gray scale luminance levels, obtained from Table 2, demonstrating that the associated copper and aluminum filtration enhances the gray levels curve. This apparently subtle graphic change represents a significant increase and separation of the gray tones that are now represented on the obtained images. Additionally, it is demonstrated that the aluminum filter more strongly contributes with the darkest gray tones.
Figure 7. Histograms of the gray scales without additional filtration (left) and with additional filtration (aluminum + copper) at right, obtained through the analysis of the Adobe Photoshop 5.5 luminosity channel. It allows the qualitative and quantitative visualization of a greater separation of the gray steps contained in the same 17,995 pixels of the central rectangular bar of the GS2 Leeds test object.
DISCUSSION
Radiodiagnostic studies represent the greatest cause of exposure to artificial sources of ionizing radiation(30,31).
How-ever, the daily contact with the radiation sources causes a lenient attitude towards the inherent risks(32). Additionally, it is
im-portant to mention the already mentioned possibility of high doses generated and delivered by defective equipment(12,13). In
spite of the conscience for the need of us-ing the lowest possible doses, examples of violation of this concept are repetitive(34,35).
Videofluoroscopy is the most appropri-ate radiological method for the study of dynamic biological processes, allowing noninvasive morpho-functional recording of the phenomena with low radiation doses as compared with fluoroscopy used for extended periods, for later radiographic recording, or with cineradiography which requires considerably higher doses(2,12,36). A
further reduction of required and delivered doses, maintaining the diagnostic quality without loss in the images quality, adds value to the method and contributes to the definition of reference levels for the videofluoroscopic swallowing study (4,10– 12). Such levels, still to be definitely
de-fined, tend to be established at lower val-ues due to the significant dose reduction achieved with the use of additional
filtra-tion such as those observed in the present study, and which have also been reported by other studies(19–24).
With same test object, the same techni-cal parameters (60 kV, 0.7 mA), and simi-lar exposure times and varying filtration systems, the authors observed that as the aluminum, copper or association of these
The obtained energy distribution curves allowed the observation of a curve’s peak dislocation to the right, which means that as the filtration increases, the quantity of low energy photons in the spectrum de-creases, reducing the total dose delivered to the patient with no loss in the image quality. This dislocation of the energy peak of the photons to higher values (beam hard-ening) caused the remaining beam spectrum to have a higher penetration capability.
The interposition of attenuating plates could interfere in the low contrast and spa-tial resolution of the images. However, the authors observed that the measured values for these parameters did not change with the interposition of the additional filtration. However, low contrast and spatial resolu-tion, most frequently explored in literature are semi-quantitative tests that present a certain degree of subjectivity. Frequently, health professionals associate the image quality with their capacity of seeing and identifying abnormalities on the images.
Thus, an objective quantification of the image quality may be better defined by the analysis of the luminance values and re-spective standard deviations, obtained by the gray tone histograms of the video sig-nal obtained from the Leeds GS2 test ob-jects. Luminance and gray levels are pa-rameters utilized to identify the best qual-ity of images(37–39).
The gray scale has been widely utilized in the study of video and television systems for more than 60 years, and has been adopted by several centers in the evaluation of radiological image systems(40). This
stan-dard, defined by the Electronic Industries Association (standard RS-189) and later adopted by the Society of Motion Picture of Television Engineering, allows for the evaluation of the behavior of the response curve between black and white in video capture and display devices. The relevance of this evaluation must be highlighted, as the cathode ray tubes utilized in video monitors, do not have a linear response to the black-to-white excursion, which re-quires a previous compensation in the cap-ture system. This compensation system is defined as the gamma parameter or factor, and is measured by the curvature of the gray scale in relation to a hypothetical straight line representing the
black-to-white excursion. As the gamma factor in-creases, the black & white curve differen-tiates further from a straight line.
It is important to observe that the varia-tion of the gamma factor changes the re-sponse of intermediate gray tones, while adjustment in brightness and contrast acts primarily in the limits of white and black on the same scale. Although these are dif-ferent parameters, there is a strong interac-tion among gamma factor, brightness and contrast. That is the reason why the high and low contrast response must be evalu-ated in association with the intermediate gray tone response.
The Electronic Industries Association scale for image quality control in profes-sional television, as well as the Leeds test object used in the present study present the same ten-level gray scale. In this standard there is a 10% variation between each step or level, in a way to cover the entire transi-tion between black and white. Each step has a maximum value deviation or differ-ential gain, ranging between 2% and 4%, that was evaluated by the standard devia-tion of the gray tones of each step.
For practical ends, the current intensity (mA) can be related to the black level, and the difference in potential (kV) to the white level. For that reason, when there is greater or lesser opacity of a radiological image under analysis, adjustments in kV or mA allow for improvements in the image sharp-ness.
Table 2 and the respective graphic (Fig-ure 6) demonstrate the gray scale modified by all the filters utilized. Mid-gray tones are more distinctive. Tone separation was greater in the mid values of the scale than those observed in the curve extremities (values for black and white). Both copper and aluminum filters decreased the stan-dard deviation for each gray level, increas-ing the separation of each level on the scale. The association of two filters contributed even further for the levels separation, as evidenced by the standard deviation per-centage for each one of the gray levels.
The analysis of the gray tone set histo-grams of the whole bar in the different simulated situations allows a clearer visu-alization of tones separation. Tones that in some cases were covered by the measure-ment dispersion of a given step became
sharper within the distribution. The im-provement in the definition between the different steps enhanced the frequency peaks and valleys between each one of the measurements presented on the histogram on Figure 7.
All the added filtrations produced changes in the gray scale curve, increasing the value of the gamma factor and ampli-fying the spectrum of the represented tones. The mean gray level ranged from 125.24 ± 49.10 to 136.96 ± 52.29. Aluminum was the greatest contributor for the curve ex-pansion, increasing the difference between the highest and lowest level represented in the scale by ten gray tones. Such curve expansion, with an increase in represented levels, in the case of association between aluminum and copper plates increases to 161.23 the obtained difference between the highest level of white and the lowest level of black represented in the Leeds test ob-ject scale.
The closest tones to white are more sharply enhanced when the filtration is made by the interposition of the copper fil-ter alone or in association with the alumi-num filter. This filtration enhances areas that are more permeable to x-radiation, where the tone separation effectively in-creases the demonstration of areas whose transparency was very close. This increase in contrast favors a better evaluation of the videofluoroscopic image.
The studies performed with all volun-teers had a same objective and followed the same protocol with anteroposterior and left lateral views. In order to independently evaluate the results regarding the different irradiation times, the KAP rates (cGy.cm2/
min) were calculated as shown on Tables 3 and 4, allowing the normalization of the radiation exposure time, independently from the total exposure time at the end of each volunteer examination.
The first ten volunteers were evaluated without any additional filtration besides the inherent one, and the exposure of this group was compared with that of the 5 volunteers group for which aluminum and copper filters in association were added to the inherent filtration.
minutes) required for the performance of the same evaluation protocol with the sec-ond group. How can this difference in re-quired time for the same protocol be ex-plained?
These videofluoroscopic examinations were aimed at understanding and recording the structural response of the pharynx to the increase in the pressure generated by the transit of two or three deglutitions of known volumes of 100% barium sulfide solution, and also the increase in pharyn-geal pressure increase caused by forced expiration against resistance in healthy wind musicians.
The establishment of the study protocol and morpho-functional analysis of the im-ages during their recording ended up gen-erating exposures above recommended and/or required for the protocol accomplish-ment, since the events could be recorded and analyzed in a considerably shorter time without any loss of information.
Certainly, this reduction of the time re-quired for the study performance had as one of its components, a greater experience in the execution of the protocol, however, undoubtedly, the knowledge of the fact that the radiation doses were being recorded brought a greater diligence in the protocol accomplishment, with a reduction of the total radiation exposure time and dose.
From the calculation of KAP rates, one observes that the second group exposure is 2.5 times lower than that observed in the first group. This KAP reduction can now be attributed to the additional filtration pro-duced by the association of the aluminum and copper plates. The KAP reduction of 2.5 times is practically the same observed with the interposition of the 1 mm copper plate, which was 2.7 times smaller when the copper and aluminum filters are associated, as compared with the inherent filtration.
In what concerns the quality of images obtained in the volunteer studies with the association of copper and aluminum plates, the improvement in the image quality with a better gray level resolution was perceived. Such subjective perception is confirmed by the results of the semi-quantitative test re-sults obtained with the use of the TOR (TVF) and TO10 Leeds test objects and by the gray scale luminance study of the GS2 Leeds object.
Besides demonstrating gains in images quality, such findings enhance the percep-tion of the fact that the consciousness of being measuring the radiation and the use of the plates is an important factor in the determination of the reference levels to be established for videofluoroscopic and cer-tainly for the other fluoroscopic studies.
CONCLUSIONS
The interposition of additional copper and aluminum filtration, particularly when associated, improves the images quality, with considerable reduction in the radiation doses required for their generation. These facts allow the conclusion that the addition of the filters to the radiological system is an important factor to be considered in the performance of videofluoroscopic studies.
Acknowledgements
To Mr. Tadeu José Dias, technician in charge of SJTR Equipamentos Médico Hospitalar Ltda., for the support in the ad-aptation and implementation of the neces-sary changes in the equipment for video-fluoroscopic study of deglutition, and to Leslie Silva Pereira, of Instituto de Radio-dosimetria do Rio de Janeiro, for the sup-port in the utilization of the software Re-port 78.
REFERENCES
1. Hofmann FW, Marhoff P. High resolution fluoro-scopic equipment. In: Quality control in diagnos-tic radiology. Conference Reports Series-26. Lon-don: The Hospital Physicists’ Association; 1976. p. 27–9.
2. Costa MMB, Nova JLL, Carlos MT, et al. Video-fluoroscopia: um novo método. Radiol Bras. 1992;25:11–8.
3. Airth GR. Image requirements. In: Quality con-trol in diagnostic radiology. Conference Reports Series-26. London: The Hospital Physicists’ As-sociation; 1976. p. 26–7.
4. Costa MMB, Canevaro LV, Azevedo ACP. Aná-lise dosimétrica do método videofluoroscópico aplicado ao estudo da dinâmica da deglutição. Radiol Bras. 2000;33:353–7.
5. American Association of Physicists in Medicine. AAPM Report No. 74. Quality control in diagnos-tic radiology. Report of Task Group #12. Diagnos-tic X-ray Imaging Committee. Madison: Medical Physics Publishing; 2002.
6. Beck TJ, Gayler BW. Image quality and radiation levels in videofluoroscopy for swallowing stud-ies: a review. Dysphagia. 1990;5:118–28. 7. Noll SF, Bender CE, Nelson MC. Rehabilitation
of patients with swallowing disorders. In: Braddom RL, editor. Physical medicine &
reha-bilitation. 2nd ed. Philadelphia: Saunders; 2000. p.535–60.
8. Costa MMB. Uso de bolo contrastado sólido, lí-quido e pastoso no estudo videofluoroscópico da dinâmica da deglutição. Radiol Bras. 1996;29: 35–9.
9. Macedo-Filho ED. Avaliação endoscópica da deglutição no diagnóstico da disfagia orofaríngea. In: Costa MMB, Lemme EPO, Koch HA, orga-nizadores. Temas em deglutição e disfagia: abor-dagem multidisciplinar. Rio de Janeiro: Supraset; 1998. p. 77–82.
10. Costa MMB, Canevaro LV, Azevedo ACP. Dosi-metric assessment of swallowing examinations with videofluoroscopy. In: International Confer-ence on the Radiological Protection of Patients in Diagnostic and Interventional Radiology, Nuclear Medicine and Radiation Therapy; 2001 Mar; Malaga, Spain.
11. Costa MMB, Canevaro LV, Azevedo ACP, et al. Valores típicos do “produto dose área” (DAP) obtidos durante o estudo videofluoroscópico da deglutição. Radiol Bras. 2003;36:17–20.
12. Costa MMB. Dose referência: quantificação das doses de raios-X necessárias ao estudo videofluo-roscópico da deglutição. SIICSalud, Expertos del Iberoamérica; 2004. [acessado em 3 de junho de 2009]. Disponível em: www.siicsalud.com/des/ des042/05414002.htm
13. International Commission on Radiological Pro-tection. ICRP Publication 103: The 2007 Recom-mendations of the International Commission on Radiological Protection. Oxford: Elsevier; 2007.
14. International Commission on Radiological Pro-tection. ICRP Publication 73: Radiological pro-tection and safety in medicine. Oxford: Elsevier; 1997.
15. European Commission. Guidance on diagnostic reference levels (DRLs) for medical exposures. Radiation Protection 109 Report. General Direc-torate Environment, Nuclear Safety and Civil Protection. Luxembourg: Commission of the European Community; 1999.
16. Faulkner K, Bosmans H, O’Brien R, et al. Opti-misation of dose and performance in interven-tional and digital imaging. Radiat Prot Dosimetry. 2005;117:1–2.
17. Brasil. Ministério da Saúde. Secretaria de Vigi-lância Sanitária. Diretrizes de proteção radioló-gica em radiodiagnóstico médico e odontológico. Portaria nº 453, de 1º de junho de 1998. Diário Oficial da União, Brasília, 2 de junho de 1998. 18. Economides S, Hourdakis CJ, Kalivas N, et al.
Image quality evaluation and patient dose assess-ment of medical fluoroscopic X-ray systems: a national study. Radiat Prot Dosimetry. 2008;129: 419–25.
19. Watanabe PCA. Filtração adicional da radiação X em odontologia. Estudo comparativo entre fil-tros de alumínio e cobre [tese de doutorado]. São Paulo: Universidade de São Paulo; 1999. 20. Nicholson RA, Thornton A, Akpan M. Radiation
dose reduction in paediatric fluoroscopy using added filtration. Br J Radiol. 1995;68:296–300. 21. Morrell RE, Rogers AT, Jobling JC, et al. Barium enema: use of increased copper filtration to opti-mize dose and image quality. Br J Radiol. 2004; 77:116–22.
[dissertação de mestrado]. Piracicaba: Universi-dade Estadual de Campinas; 2000.
23. Gonçalves A. Estudo da liga de alumínio-cobre, como filtração alternativa para radiação X [tese de doutorado]. Piracicaba: Universidade Estadual de Campinas; 2000.
24. Bóscolo FN, Gonçalves A, Rollo JMDA, et al. Effects of aluminum-copper alloy filtration on photon spectra, air kerma rate and image contrast. Braz Dent J. 2005;15:214–9.
25. International Atomic Energy Agency. Dosimetry in diagnostic radiology: an international code of practice. Technical Reports Series No. 457. Vienna: International Atomic Energy Agency; 2007.
26. Martin CJ. Radiation dosimetry for diagnostic medical exposures. Radiat Prot Dosimetry. 2008; 128:389–412.
27. Cowen AR, Clarke OF, Coleman NJ, et al. Leeds X-ray test objects instruction manual. Leeds: University of Leeds; 1992.
28. Tapiovaara MJ. Review of relationships between physical measurements and user evaluation of image quality. Radiat Prot Dosimetry. 2008;129: 244–8.
29. Cranley K, Gilmore BJ, Fogarty GWA, et al. Cata-logue of diagnostic X-ray spectra and other data. IPEM Report 78. SRS-780. York: Institute of Physics and Engineering in Medicine; 1997. 30. Pan American Health Organization. Protección
del paciente en radiodiagnóstico: informe del Comité de la CIPR, adoptado por la Comisión en mayo de 1982. Cuaderno Técnico 3. Washington: Pan American Health Organization; 1987.
31. Oliveira ML. Doses de entrada na pele de pacien-tes em radiologia pediátrica. Expertos de Ibero-américa, abril 2005. [acessado em 22 de junho de 2009]. Disponível em: http://www.siicsalud.com/ dato/dat043/05425015.htm
32. Vinhas L. Os raios não conhecem fronteiras. Ins-tituto de Radiodosimetria da Comissão Nacional de Energia Nuclear, em vídeo educativo. NUTES – Núcleo de Tecnologia Educacional para Saúde. Rio de Janeiro: Universidade Federal do Rio de Janeiro; 1990.
33. Magalhães R. Os raios não conhecem fronteiras. Secretaria de Saúde do Estado do Rio de Janeiro, em vídeo educativo. NUTES – Núcleo de Tecno-logia Educacional para Saúde. Rio de Janeiro: Universidade Federal do Rio de Janeiro; 1990.
34. Freitas MB, Yoshimura EM. Dose measurements in chest diagnostic X rays: adult and paediatric patients. Radiat Prot Dosimetry. 2004;111:73–6.
35. Travassos LV, Boechat MCB, Santos EM, et al. Avaliação das doses de radiação em uretrocisto-grafia miccional de crianças. Radiol Bras. 2009; 42:21–5.
36. Koch HA. Métodos radiológicos de investigação das doenças disfágicas. In: Costa MMB, Lemme EMO, Koch HA, organizadores. Deglutição e disfagia: abordagem multidisciplinar. Rio de Ja-neiro: Supraset; 1998. p. 93–8.
37. Nawfel RD, Chan KH, Wagenaar DJ, et al. Evalu-ation of video gray-scale display. Med Phys. 1992;19:561–7.
38. Caronna G, Santoro G, Testa P. Preference study of peak luminance vs. resolution for color televi-sion tubes. SMPTE J. 1998;107:538–43.
39. Nova JLL. Qualidade da imagem. In: Costa MMB, Lemme EMO, Koch HA, organizadores. Deglu-tição e disfagia: abordagem multidisciplinar. Rio de Janeiro: Supraset; 1998. p. 29–34. 40. Holmes B, Liggins R. A television x-ray image