Determination by CES-1 Snail
Bo Yan1,2, Nadin Memar1, Julia Gallinger2¤, Barbara Conradt1*
1Center for Integrated Protein Science, Department of Biology II, Ludwig-Maximilians-University, Munich, Planegg-Martinsried, Germany,2Department of Genetics, MCB Graduate Program, Geisel School of Medicine at Dartmouth, Hanover, New Hampshire, United States of America
Abstract
The coordination of cell proliferation and cell fate determination is critical during development but the mechanisms through which this is accomplished are unclear. We present evidence that the Snail-related transcription factor CES-1 of
Caenorhabditis eleganscoordinates these processes in a specific cell lineage. CES-1 can cause loss of cell polarity in the NSM neuroblast. By repressing the transcription of the BH3-only geneegl-1, CES-1 can also suppress apoptosis in the daughters of the NSM neuroblasts. We now demonstrate that CES-1 also affects cell cycle progression in this lineage. Specifically, we found that CES-1 can repress the transcription of the cdc-25.2gene, which encodes a Cdc25-like phosphatase, thereby enhancing the block in NSM neuroblast division caused by the partial loss ofcya-1, which encodes Cyclin A. Our results indicate that CDC-25.2 and CYA-1 control specific cell divisions and that the over-expression of theces-1 gene leads to incorrect regulation of this functional ‘module’. Finally, we provide evidence thatdnj-11 MIDA1 not only regulate CES-1 activity in the context of cell polarity and apoptosis but also in the context of cell cycle progression. In mammals, the over-expression of Snail-related genes has been implicated in tumorigenesis. Our findings support the notion that the oncogenic potential of Snail-related transcription factors lies in their capability to, simultaneously, affect cell cycle progression, cell polarity and apoptosis and, hence, the coordination of cell proliferation and cell fate determination.
Citation:Yan B, Memar N, Gallinger J, Conradt B (2013) Coordination of Cell Proliferation and Cell Fate Determination by CES-1 Snail. PLoS Genet 9(10): e1003884. doi:10.1371/journal.pgen.1003884
Editor:Stuart K. Kim, Stanford University Medical Center, United States of America
ReceivedOctober 18, 2012;AcceptedSeptember 3, 2013;PublishedOctober 31, 2013
Copyright:ß2013 Yan et al. This is an open-access article distributed under the terms of the Creative Commons Attribution License, which permits unrestricted use, distribution, and reproduction in any medium, provided the original author and source are credited.
Funding:This work was supported by National Institute of Health Grants GM069950 and GM076651, CIPSM, and funds from the Ludwig-Maximilians-University, Munich (Links: http://www.nih.gov/; http://www.uni-muenchen.de/index.html; http://www.cipsm.de/en/index.html). The funders had no role in study design, data collection and analysis, decision to publish, or preparation of the manuscript.
Competing Interests:The authors have declared that no competing interests exist. * E-mail: conradt@bio.lmu.de
¤a Current address: Institute for Anatomy and Cell Biology, Ludwig-Maximilians-University, Munich, Munich, Germany.
Introduction
Members of the Snail superfamily of zinc-finger transcription factors are essential during development and their deregulation has been implicated in various malignancies including tumorigen-esis [1–4]. One of the best known functions of Snail-related proteins is their role in the induction of epithelial-mesenchymal transitions (EMTs) [1,2,4,5]. EMTs are fundamentally important for normal development and, in particular, for processes such as mesoderm formation, gastrulation and neural tube formation. EMTs are also important for tumorigenesis since they are responsible for the invasive behavior of certain types of tumor cells [1,2,5]. Hallmarks of EMTs are the loss of apico-basal polarity and adhesive properties, which is critical for the ability of epithelial cells to become migratory. Snail-related proteins contribute to these cellular changes by repressing the transcription of genes that encode factors required for apico-basal polarity and cell adhesion, such asCrumbsandE-cadherin, respectively [6–8].
Snail-related proteins have additional cellular functions that can operate independently of the induction of EMT. In Drosophila melanogaster, for example, the Snail family members Snail, Worniu and Escargot are important for both the cell polarity of neuroblasts and the ability of these cells to divide [9,10]. Snail, Worniu and Escargot are required for the polarity of embryonic neuroblasts because they promote the expression of the geneinscuteable, which
by repressing the transcription of the pro-apoptotic BH3-only gene puma[16].
The ability of Snail-related transcription factors to block apoptosis was initially discovered in Caenorhabditis elegans and during the analysis of the NSM (NSM, neuro-secretory motoneu-ron) lineages (Two bilaterally symmetric NSM lineages exist, the left and right NSM lineage). About 410 min after the 1stdivision of the embryo (referred throughout the manuscript as ‘‘1stround of division’’), the two NSM neuroblasts (which are generated about 280 min after the 1st division) divide asymmetrically along the ventral-lateral dorsal-medial axis to each generate two daughter cells of different sizes and different cell fates, the larger NSM, which survives and differentiates into a serotonergic neuro-secretory motorneuron, and the smaller NSM sister cell, which undergoes apoptosis and forms a cell corpse about 30 min after the completion of the NSM neuroblast division [17,18]. A dominant gain-of-function (gf) mutation of theces-1(ces, cell-death specifi-cation) gene, which encodes a Snail-related protein, was found to block the death of the NSM sister cells and the I2 sister cells [19,20]. Otherwise, ces-1(n703gf) animals are indistinguishable from wild-type animals at least at the dissecting microscope level. Thisces-1gf mutation affects a regulatory region of theces-1locus, which is likely to results in the over-expression of theces-1gene in specific lineages, including the NSM lineage [20]. In ces-1 gf mutants, the CES-1 protein blocks the death of the NSM sister cells by binding to acis-acting element of the BH3-only geneegl-1 (egl, egg-laying defective), thereby preventing the HLH-2/HLH-3-(HLH, basic helix-loop-helix transcription factor) dependent activation of egl-1 transcription [21]. Interestingly, the ces-1 gf mutation also affects the cell polarity of the NSM neuroblast. Specifically, in ces-1 gf mutant animals, the NSM neuroblast divides symmetrically along randomly selected axes rather than dividing asymmetrically along the ventral-lateral dorsal-medial axis [17]. The same polarity defect is observed in animals that lack a functionalces-2ordnj-11(dnj, DnaJ domain) gene, which encode a HLF-like bZIP transcription and a MIDA1-like chaperone, respectively, and which act upstream of ces-1 to repress ces-1 transcription in the NSM neuroblast [17,19,20,22]. Furthermore,
in a wild-type background, expression from a functional P ces-1ces-1::yfpconstruct is detected only in the larger NSM daughter that is destined to survive (the NSM); however, in aces-2ordnj-11mutant background expression of this construct is detected in the NSM neuroblast as well as both daughter cells [17]. Based on these findings it has been proposed that in the NSM neuroblast, CES-2 and DNJ-11 maintainces-1expression below a certain level and that this is important for the establishment and/or maintenance of NSM neuroblast polarity and the ability of the NSM neuroblast to divide asymmetrically. After the NSM neuroblast divides, CES-1 protein is restricted to the NSM, where it acts as a direct repressor ofegl-1transcription and hence, apoptosis. Inces-2,dnj-11orces-1 gf mutant animals, the level of CES-1 protein in the NSM neuroblast is elevated and this leads to the symmetric, random division of the NSM neuroblast. This results in the formation of two daughters of similar sizes, both of which contain CES-1 protein and, consequently, survive [17,23].
We now demonstrate that CES-1 has an additional function in the NSM lineage. Specifically, we present evidence that CES-1 can also regulate cell cycle progression in the NSM neuroblast by functionally interacting with core components of the cell cycle machinery. By simultaneously controlling cell cycle progression, cell polarity and apoptosis, the Snail-related transcription factor CES-1 plays a crucial role in the coordination of cell proliferation and cell fate specification in the NSM lineage.
Results
Inces-1(n703gf); bc416animals, the division of the NSM
neuroblast is blocked
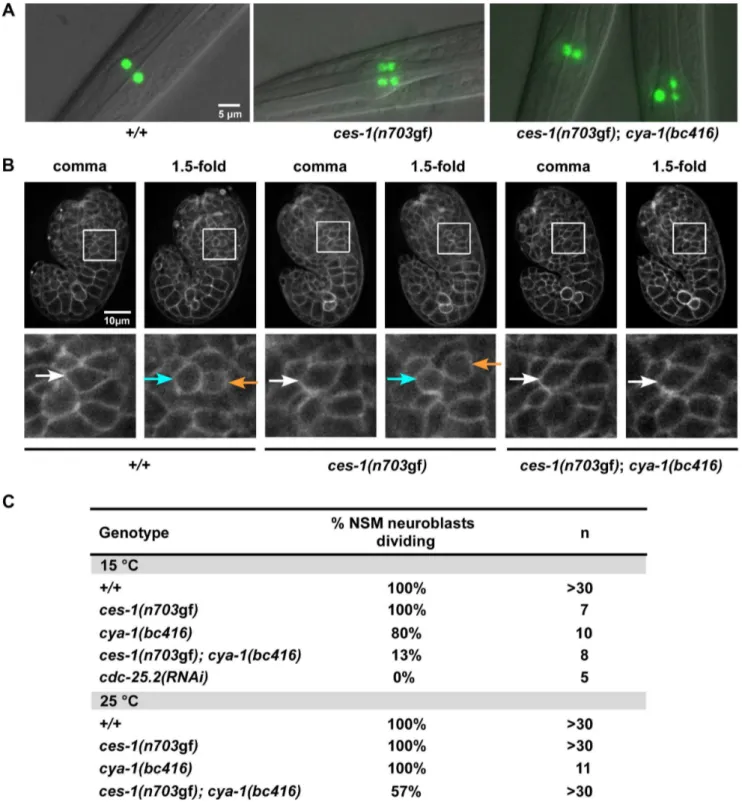
Wild-type larvae carrying the Ptph-1his-24::gfp reporter (tph, tryptophane hydroxylase; his, histone structural gene), which is specifically expressed in serotonergic neurons (and labels the nuclei of these neurons) [24], have two GFP-positive neurons in the anterior pharynx, the left and right NSM (Figure 1A, +/+). In animals carrying a gf mutation ofces-1,n703, the NSM neuroblast divides symmetrically, resulting in two daughter cells of similar sizes, both of which survive [17,19]. Therefore, ces-1(n703gf) larvae carrying the Ptph-1his-24::gfpreporter have four GFP-positive neurons in the head region, the left and right NSM and the left and right ‘undead’ NSM sister cell (Figure 1A,ces-1(n703gf)). To identify targets of the CES-1 protein involved in the asymmetric division of the NSM neuroblast, we performed a ces-1(n703gf) suppressor screen using the Ptph-1his-24::gfp reporter as a tool. Specifically, we screened mutagenized ces-1(n703gf) animals for mutations that cause a reduction in the number of GFP-positive NSMs and undead NSM sister cells (i.e.less than four GFP-positive cells in the anterior pharynx). Using this approach, we isolated the mutationbc416. At 15uC, 100% ofces-1(n703gf)larvae have four GFP-positive cells. In contrast, only 5% of ces-1(n703gf) larvae homozygous for bc416 (ces-1(n703gf); bc416) have four GFP-positive cells (Table 1). Thebc416mutation is recessive and does not show maternal rescue (data not shown; Table S1).
At 15uC, 33% of ces-1(n703gf);bc416 larvae have three GFP-positive cells (Table 1). Interestingly, based on Ptph-1his-24::gfp labeling, in these animals, one nucleus is larger than the other two nuclei (Figure 1A, ces-1(n703gf); bc416). This phenomenon is observed at a high frequency. Based on this observation, we hypothesized that instead of suppressing the inappropriate survival of NSM sister cells inces-1(n703gf) animals, the bc416mutation might affect the division of the NSM neuroblasts. To test this, we directly analyzed the division of the NSM neuroblasts in ces-1(n703gf); bc416embryos. To that end, we used a transgene that expresses a plasma membrane-targeted mCherry fusion protein as Author Summary
Animal development is a complex process and requires the coordination in space and time of various processes. These processes include the controlled production of cells, also referred to as ‘cell proliferation’, and the adoption by cells of specific fates, also referred to as ‘cell fate determination’. The observation that uncontrolled cell proliferation and cell fate determination contribute to conditions such as cancer, demonstrates that a precise coordination of these processes is not only important for development but for the prevention of disease throughout life. Snail-related transcription factors have previously been shown to be involved in the regulation of cell proliferation and cell fate determination. For example, the Caenorhabditis elegans
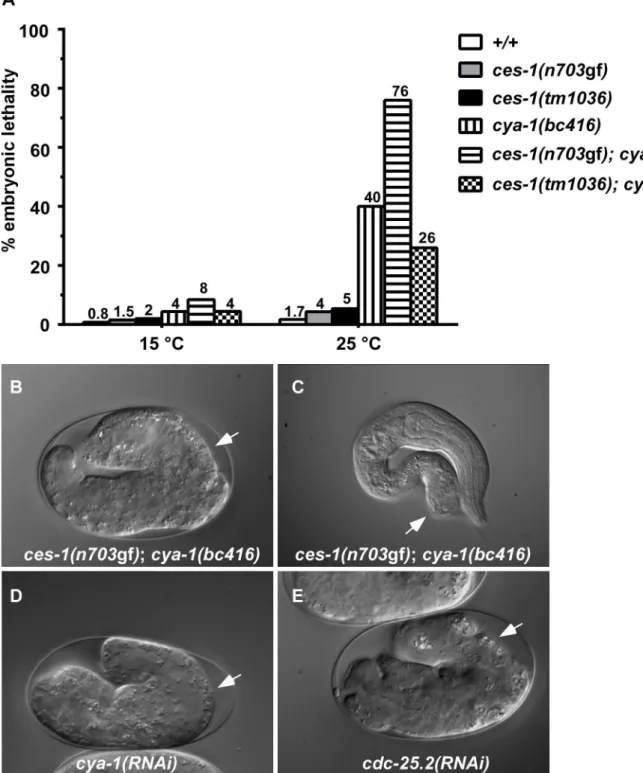
Figure 1.ces-1(n703gf);cya-1(bc416)affects the division of the NSM neuroblast.(A) The presence of NSMs, undead NSM sister cells, and non-dividing NSM neuroblasts was analyzed in L3, L4 larvae using the reporter Ptph-1his-24::gfp(bcIs66). All strains analyzed were homozygous forbcIs66. Epifluorescence images overlaid with DIC. (B) The NSM neuroblast division was analyzed in embryos using the reporter Ppie-1mCherry::phPLC1
d
(ltIs44) or Ppie-1gfp::phPLC1
d
(ltIs38). Epifluorescence images were taken before (‘comma’) and after the NSM neuroblast division (‘1.5-fold’). In the case of ces-1(n703gf);cya-1(bc416), the NSM neuroblasts had not divided at the time the analysis had to be terminated due to the beginning of muscle twitching (around the 2-fold stage). White arrows point to the NSM neuroblasts, blue and orange arrows point to the NSMs and NSM sister cells, respectively. All strains analyzed were homozygous forltIs44andbcIs66, exceptces-1(n703gf), which was homozygous forltIs38andbcIs66. (C) Quantification of the percentage of NSM neuroblasts dividing in wild-type,ces-1(n703gf), ces-1(n703gf); cya-1(bc416), cya-1(bc416)and cdc-25.2(RNAi) embryos. cdc-25.2(RNAi)was performed by injection. n indicates the number of NSM neuroblasts analyzed.
a tool [25]. We identified the NSM neuroblasts based on their positions during the comma stage of embryogenesis and tracked their fates until the 2-fold stage, which is the stage during which in wild-type animals, the NSM neuroblasts complete their division and the NSM sister cells undergo apoptosis [17,18]. We found that at 15uC, only 13% of the NSM neuroblasts divide inces-1(n703gf); bc416embryos (Figure 1B, C). To rule out the possibility that the division of the NSM neuroblasts inces-1(n703gf); bc416animals is delayed rather than blocked, we scored ces-1(n703gf); bc416 animals in the background of the ced-3loss-of-function mutation n717, which causes a general block in apoptosis [26]. If the NSM neuroblasts divided in late embryos or in larvae and the resulting NSM sister cells underwent apoptosis, using Ptph-1his-24::gfp as a tool, we should observed an increased number of animals with four GFP-positive cells in the ced-3(n717) background. However, we found that the percentage of animals with two, three, or four GFP-positive cells is not affected byced-3(n717)(Table 1,ces-1(n703gf); bc416;ced-3(n717)). Therefore, the reduction in GFP-positive cells observed inces-1(n703gf); bc416larvae is the result of a failure of the NSM neuroblasts to divide. For this reason, we are presenting the data acquired in larvae using Ptph-1his-24::gfpnot only in the form of ‘% animals with two, three, or four GFP-positive cells’ but also as ‘% NSM neuroblasts dividing’, which is defined as the percentage of the NSM neuroblasts that divide (Table 1).
The NSM neuroblast division is blocked between S phase and M phase
To further examine the cell cycle defect inces-1(n703gf); bc416 animals, we determined the relative DNA content in non-dividing NSM neuroblasts. We labeled DNA in ces-1(n703gf); bc416
animals with the fluorescent dye DAPI and measured fluorescence intensity in non-dividing NSM neuroblasts [27,28], in NSMs and in undead NSM sister cells. We found that inces-1(n703gf);bc416 mutants with three GFP-positive cells, the average DNA content of the cells with the larger nuclei (presumably the non-dividing NSM neuroblasts) is 1.8 times greater than the average DNA content of the cells with the smaller nuclei (presumably the NSMs and undead NSM sister cells) (Figure S1). Furthermore, in ces-1(n703gf);bc416animals with two GFP-positive cells, the average DNA content of both cells is about 2-fold higher than that of control pharyngeal muscle cells (data not shown). Taken together, these observations suggest that inces-1(n703gf);bc416animals, the NSM neuroblasts complete DNA replication but fail to undergo mitosis. Hence, in this mutant background, the NSM neuroblasts arrest between S phase and M phase. Interestingly, just like NSMs, the non-dividing, tetraploid NSM neuroblasts express the P tph-1his-24::gfp reporter during larval stages, which suggests that they differentiate into serotonergic neurons.
ces-1(n703gf); bc416 causes embryonic lethality and
sterility
Besides exhibiting a defect in NSM neuroblast division, ces-1(n703gf);bc416animals have additional defects. When raised at 15uC or 25uC, 8% or 76% of ces-1(n703gf); bc416 animals, respectively, exhibit an embryonic lethal (Emb) phenotype and arrest at the elongation stage during embryogenesis (Figure 2A, B). Arrested embryos have multiple defects in hypodermal morpho-genesis (Figure 2B). Since the Emb phenotype is temperature sensitive, we performed temperature-shift experiments to define the temperature-sensitive period (TSP) of ces-1(n703gf); bc416
Table 1.ces-1(n703gf); cya-1(bc416)affects the number of ‘NSM-like’ cells.
Genotype Transgene Line
% worms with X numbers of GFP+cells
n
% NSM neuroblasts dividing
2 3 4
+/+ - - 100 0 0 .200 100%
ces-1(n703gf) - - 0 0 100 .200 100%
ces-1(n703gf); cya-1(bc416) - - 62 33 5 .200 22%
ced-3(n717)a - - 0 0 100 70 100%
cya-1(bc416); ced-3(n717)a - - 1 15 84 115 92%
ces-1(n703gf); cya-1(bc416); ced-3(n717)a - - 56 37 7 89 25% ces-1(tm1036); cya-1(bc416); ced-3(n717)a - - 1 14 85
.200 92%
cdc-25.2(ok597)/+; cya-1(bc416); ced-3(n717)a - - 49 36 15 41 33% dnj-11(tm2859); cya-1(bc416); ced-3(n717)a, b - - 18 43 39 51 61%
ces-1(n703gf); control(RNAi)c - - 0 4 96 46 98%
ces-1(n703gf); cya-1(RNAi)c - - 82 18 0 51 9%
ces-1(n703gf); cya-1(bc416) cya-1d 1 0 9 91 22 95%
cya-1d 2 4 8 88 24 92%
ces-1(n703gf); cya-1(bc416) cdc-25.2 1 3 29 68 31 82%
Analysis of Ptph-1his-24::gfppositive cells in the anterior pharynx. All strains analyzed were homozygous for the integrationbcIs66(Ptph-1his-24::gfp) and were raised and
analyzed at 15uC. n indicates the number of L3 or L4 larvae analyzed. ‘% NSM neuroblast dividing’ is defined as the percentage of NSM neuroblasts that divide. aIn the cell-death defective
ced-3(n717)mutants, the NSM sister cells inappropriately survive.
bEmbryonic lethality was observed. The percentage shown in the table is the analysis of larvae survived. Indnj-11(tm2859); cya-1(bc416); ced-3(n717)animals that arrest during embyogenesis, only 30% of the NSM neuroblasts divide.
c
RNAi was carried out by feedingces-1(n703gf); rrf-3(pk1426)animals with bacteria expressing dsRNA.ZK512.1(RNAi)was used ascontrol(RNAi). dLine 1 and Line 2 are two independent transgenic lines generated by injecting the rescue DNA fragment into
ces-1(n703gf); cya-1(bc416)mutants. Transgenic animals were used for analysis.
animals. Embryos were shifted from 25uC to 15uC orvice versaat different stages during embryonic development, and viability was assessed 24 h to 48 h later. As shown in Figure S2, the TSP of ces-1(n703gf); bc416 animals lies between the 50-cell stage and the comma stage of embryogenesis. Therefore, at least in the ces-1(n703gf) mutant background, the gene defined by the bc416 mutation is essential and its activity required for embryonic
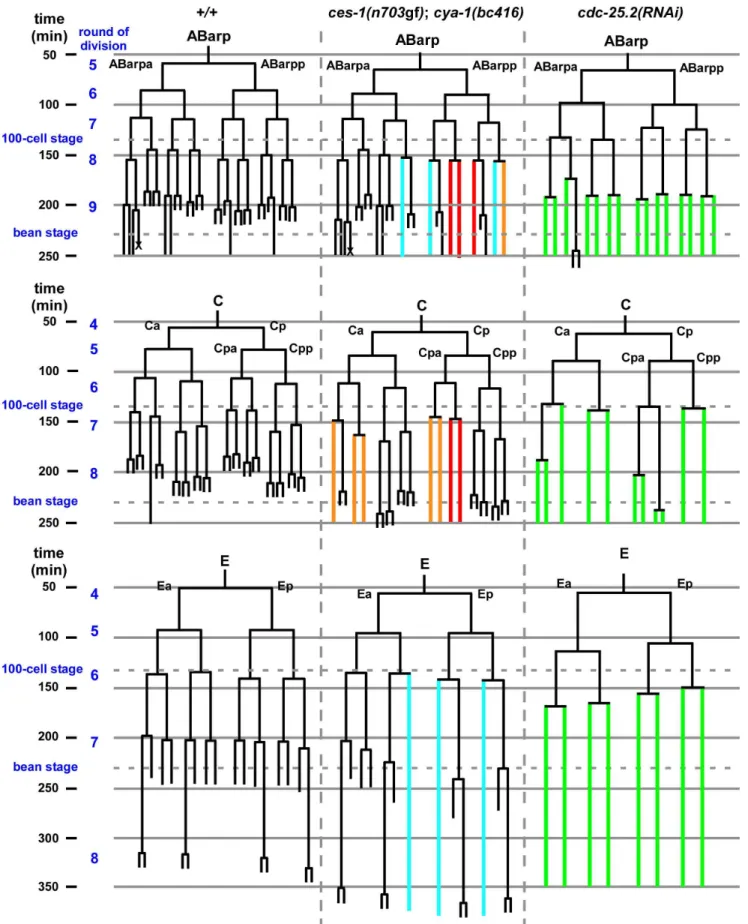
ces-1(n703gf);bc416mutants display cell division defects in the ABarp, C, and E lineages
Since a highly penetrant Emb phenotype was observed in ces-1(n703gf); bc416animals raised at 25uC, we investigated whether cell divisions other than the divisions of the NSM neuroblasts are affected in these animals. A systematic analysis of all cell lineages using 4D lineage analysis [29] showed that cell division defects are not restricted to the NSM lineage. We found that at 25uC, the ABarp, C and E lineages are also affected inces-1(n703gf);bc416 animals (Figure 3). All other lineages were not affected. ABarp is a major hypodermal precursor and the C founder cell generates additional posterior and dorsal hypodermal cells [18]. In the ABarp lineage, most cell divisions that give rise to ventrolateral ectoblasts (V1 to V6) are blocked (Figure 3). Furthermore, in the C lineage, many cell divisions that generate the embryonic large hypodermal syncytium (hyp7) fail to occur (Figure 3). The defects in the ABarp and C lineage most likely cause or contribute to the observed hypodermal abnormalities (Figure 2B, C). A failure in the formation of the hypodermis has previously been shown to cause embryonic lethality [30]. In addition, the phenotype of arrestedces-1(n703gf); bc416 embryos is similar to the phenotype of mutants with hypodermal defects [30]. Therefore, the cell division defects in the ABarp and C lineages observed inces-1(n703gf);bc416animals most probably cause the Emb phenotype exhibited by these animals. In addition, we identified variable defects in the E lineage. Specifically, some cell divisions of the 7th round of division duringC. elegans embryogenesis do not occur in the E lineage (Figure 3). Based on these observations, we conclude that in the ces-1(n703gf) back-ground and at 25uC,bc416affects the divisions of cells other than the NSM neuroblasts. (The defects caused bybc416in an otherwise wild-type background will be discussed below.)
bc416is a mutation in theC. elegansCyclin A homolog,
cya-1
Thebc416mutation was mapped genetically to a 900 kb region (between SNPs F22B7:15755 and ZK1098:19075) on LGIII using linkage analysis, three-factor mapping and SNP mapping (Figure S3A). In addition, we used Illumina deep sequencing technology to sequence the entire genome ofces-1(n703gf);bc416animals. In the F22B7:15755 - ZK1098:19075 region, we found a G to A transition at the conserved 59splice-donor site of the first intron of the gene cya-1 (ZK507.6), which encodes one of two C. elegans Cyclin A homologs, CYA-1 (Figure S3B) [31].
A 4.3 kb genomic DNA fragment that contains the entire coding region ofcya-1rescues the NSM neuroblast division defect (Table 1;ces-1(n703gf);bc416plus‘cya-1’transgene) and the Emb phenotype observed in ces-1(n703gf); bc416 animals (data not shown). Similar to bc416, partially reducing cya-1 function by RNA-mediated interference (RNAi) blocks 90% of the NSM neuroblast divisions in the ces-1(n703gf) mutant background (Table 1;ces-1(n703gf);cya-1(RNAi)). In addition,cya-1(RNAi) leads to embryonic lethality and the terminal phenotype of arrested embryos is similar to the terminal phenotype of arrested ces-1(n703gf); bc416 embryos (Figure 2D). (For the cya-1 RNAi experiment, sequences of exons 4 and 5 of cya-1 were used. Sequence alignments reveal that these two exons are highly homologous [$60%] tocya-2, the secondC. eleganscyclin A gene. For this reason, it is possible that cya-1(RNAi) also causes a decrease in cya-2function.) Finally, a null mutation of the cya-1 gene,he153, which causes embryonic lethality, fails to complement bc416in theces-1(n703gf)mutant background (data not shown; S. van der Heuvel, personal communication). In conclusion, the gene defined bybc416is identical to thecya-1gene.
Since the accuracy of the 59 splice-donor site is important for the recognition and removal of introns, we determined whether the bc416 mutation influences the splicing of the primary cya-1 transcript. Using reverse transcriptase PCR (RT-PCR), we found that, at both 15uC and 25uC,bc416affects the splicing of thecya-1 gene and results in aberrantly spliced messages, in which parts of the first intron are retained (Figure S3D). The translation of these aberrant messages is predicted to result in the synthesis of a truncated, non-functional CYA-1 protein that includes only the first 12 amino acids of the full-length protein. Using quantitative real-time PCR (qPCR), next, we determined the level of correctly spliced, wild-typecya-1transcript. We found that at both 15uC and 25uC, compared to wild-type (cya-1(+/+)) animals, the level of correctly splicedcya-1transcript is reduced by about 50% in cya-1(bc416) animals (Figure S3E). These results suggest that bc416 affects the pre-mRNA splicing of thecya-1 gene, resulting in a reduction of correctly spliced mRNA and hence, presumably, full-length CYA-1 protein. Therefore,bc416most likely represents a partial loss-of-function (lf) mutation ofcya-1.
ces-1(n703gf)enhances the phenotypes caused by
cya-1(bc416)
animals and ces-1(n703gf); cya-1(bc416) animals is reduced by about 2.5-fold when compared to the brood size of wild-type animals (Table S2).
ces-1over-expression reduces the relative expression
level ofcdc-25.2
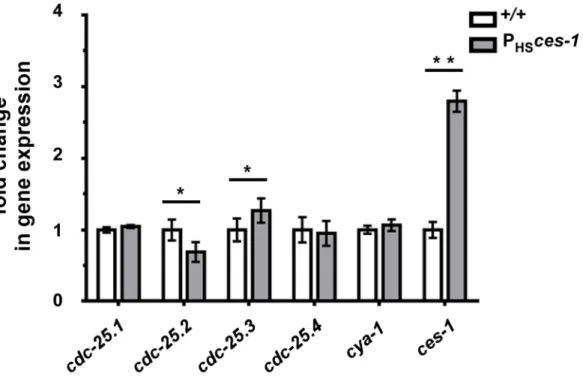
Snail-related transcription factors are thought to predominantly act as repressors of transcription [1]. To determine the mechanism through which ces-1(n703gf) enhancescya-1(bc416), we therefore analyzed the expression of candidate target genes. TheDrosophila melanogasterSnail family has been implicated in the control of the expression of the genecdc25string, which encodes theD. melanogaster ortholog of Cdc25 [10,13,14]. For this reason, we analyzed the level of expression of the fourC. elegans cdc25homologs (cdc-25.1, cdc-25.2, cdc-25.3 and cdc-25.4) [32] in wild-type animals and in animals over-expressing theces-1gene using qPCR. To that end, using a heat-inducible promoter,ces-1expression was induced for 1 h in embryos and embryos were collected after a 1.5 h recovery period. This induction scheme resulted in a 3-fold increase in the relative expression level ofces-1(Figure 4). Using this experimental set-up, we found that the relative expression levels ofcdc-25.1and cdc-25.4are not significantly changed in embryos over-expressing ces-1. In contrast, the relative expression level of cdc-25.2 is
significantly decreased, indicating that ces-1 over-expression can repress the expression ofcdc-25.2(Figure 4). We also found that the relative expression level ofcdc-25.3is significantly increased. Since CES-1 is thought to predominantly act as repressor of transcrip-tion and since it has been suggested that mammalian Cdc25A and Cdc25B may compensate for the loss of Cdc25C [33,34], we analyzed whether the increase in the relative expression level of cdc-25.3in embryos over-expressingces-1is an indirect effect that is triggered by decreased cdc-25.2 expression. We found that the relative expression level ofcdc-25.3is not increased in embryos in which cdc-25.2 function is knocked-down by RNAi (Figure S5). This suggests that, independently of decreasingcdc-25.2 expres-sion, ces-1over-expression increases cdc-25.3 expression. Finally, the relative expression level ofcya-1expression is not significantly changed in embryos over-expressingces-1(Figure 4). In summary, our data indicate that CES-1 directly or indirectly represses the expression ofcdc-25.2.
CES-1 binds to thecdc-25.2locusin vivo
To determine whether CES-1 directly controls the transcription of the cdc-25.2 gene, we analyzed CES-1 ChIP-seq (ChIP-seq, chromatin immunoprecipitation with massively parallel DNA sequencing) data acquired by the modENCODE Project (http://
two out of three embryos are depicted in blue, and defects found in one out of three embryos are depicted in orange. In the case ofcdc-25.2(RNAi), RNAi was carried out by injection. Since there is some variability of the RNAi effect, the lineage shown here was derived from the embryo with the strongest phenotype (cell division defects observed in this embryo are depicted in green), and the lineages from the other twocdc-25.2(RNAi)
embryos are shown in Figure S6. The severe cell division defects in the ABarp, C and E lineages were seen in all threecdc-25.2(RNAi)embryos. The cell death in the ABarp lineage is labeled with the cross. The defects in the C lineage and ABarp lineage result in a defect in the formation of the hypodermis (the mitoses that generate hyp7, hyp5, hyp11, H0, H1, H2, V1, V2, V4, and V6 fail to occur).
doi:10.1371/journal.pgen.1003884.g003
Figure 4.cdc-25.2expression is down-regulated byces-1over-expression.Transgenic animals carrying an extra-chromosomal array ofces-1
heat-shock plasmids and coinjection marker were used as the sample group (PHSces-1), while transgenic animals carrying an extra-chromosomal array
of only coinjection marker were used as control (+/+). Relative expression levels ofcdc-25genes andcya-1gene in control animals (+/+) and animals
over-expressingces-1(PHSces-1) were determined by real-time PCR (qPCR). Data are represented as fold change relative to control. Data shown are
the means6SEM from four independent repeats. Paired t-test was used to determine significance. The level ofcdc-25.2in PHSces-1is significantly
lower than in control. The level ofcdc-25.3in PHSces-1is significantly higher than in control. The levels ofcdc-25.1,cdc-25.4,cya-1are not significantly changed in response toces-1over-expression. *p,0.05, **p,0.01 significantly different from the control.
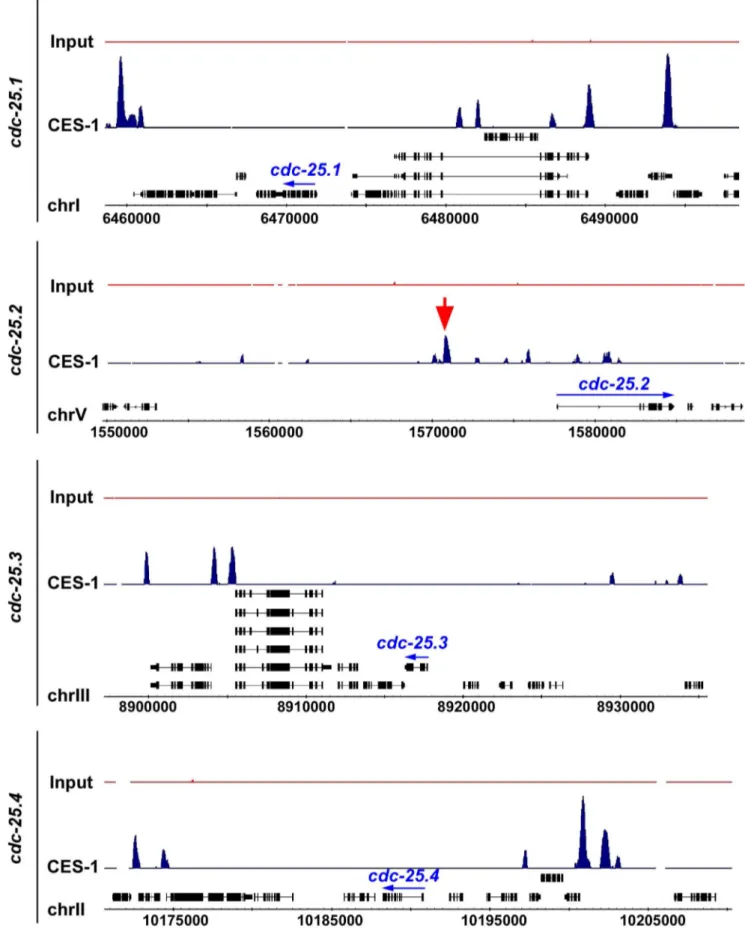
www.modencode.org/) [35,36] (M. Snyder, S. Kim, T. Kawli, personal communication). This data was acquired using, as starting material, embryos that harbor multiple copies of an engineered, stably integratedces-1fosmid, which expresses a ces-1::gfptransgene under the endogenousces-1promoter [37,38]. (We have previously shown that a Pces-1ces-1::yfptransgene can rescue the ces-1 loss-of-function mutant phenotype and, hence, is generating a fusion protein that is functional [17]. ) The ChIP-seq data obtained indicate that CES-1 binds to a 1.7 kb region that is located 4.8 kb to 6.5 kb upstream of the predicted transcriptional start site ofcdc-25.2(Figure 5) (Integrated Genome Browser [39]). In contrast, we did not identify peaks indicative of CES-1 binding sites in the immediate regions 59 or 39 of the predicted cdc-25.1, cdc-25.3 or cdc-25.4 transcription units, nor within their introns (Figure 5). Based on these findings we conclude thatcdc-25.2most likely is a direct target of CES-1 and, hence, that the effect of ces-1 over-expression on the relative expression level ofcdc-25.2is a direct effect.
cdc-25.2acts downstream of ces-1to promote cell cycle
progression
The over-expression ofces-1results in a reduction of the relative expression level ofcdc-25.2by about 30% (Figure 4). To determine whether a decrease in cdc-25.2 dosage by 50% is sufficient to enhance the NSM neuroblast division defect caused by cya-1(bc416), we analyzed cya-1(bc416) animals heterozygous for cdc-25.2(ok597), a deletion of thecdc-25.2gene that removes 2.7 kb of thecdc-25.2locus, including four of its six exons [40]. We found that cdc-25.2(ok597)/+; cya-1(bc416) animals exhibit a NSM neuroblast division defect similar to the defect observed in ces-1(n703gf); cya-1(bc416) animals. Specifically, at 15uC, 25% and 33% of the NSM neuroblasts divide inces-1(n703gf); cya-1(bc416) orcdc-25.2(ok597)/+; cya-1(bc416)animals, respectively (in the ced-3mutant background) (Table 1). Conversely, we tested whether the transgenic expression of thecdc-25.2transcription unit under the control of the endogenouscdc-25.2 promoter can rescue the NSM neuroblast division defect observed in ces-1(n703gf); cya-1(bc416) animals. We found that the expression of cdc-25.2 significantly reduces the NSM neuroblast division defect in ces-1(n703gf); cya-1(bc416)animals. Specifically, at 15uC, the expres-sion of cdc-25.2 increases the percentage of NSM neuroblasts dividing from 22% to 82% (Table 1; ces-1(n703gf); cya-1(bc416) plus ‘cdc-25.2’ transgene). Together, these findings support the notion that ces-1(n703gf)enhances the NSM neuroblast division defect caused bycya-1(bc416)by decreasingcdc-25.2expression.
ces-1,cdc-25.2andcya-1act together to control cell cycle
progression in specific lineages
Next, we analyzed the phenotypes caused by the downregula-tion of the fourcdc-25genes. We found that the downregulation by RNAi of cdc-25.1 or cdc-25.2 results in embryonic lethality. In contrast, the downregulation by RNAi ofcdc-25.3orcdc-25.4does not cause any obvious abnormalities, which is consistent with previous observations [32]. Whilecdc-25.1(RNAi) embryos arrest during early embryonic stages (as early as the 4-cell stage) (data not shown), cdc-25.2(RNAi) embryos arrest at the elongation stage during embryogenesis (Figure 2E,cdc-25.2(RNAi)). Using lineage analyses, we determined the phenotype ofcdc-25.2(RNAi)embryos in more detail. We found that the inactivation ofcdc-25.2causes an increase in cell cycle length in all lineages (Table S4). For example, in wild-type animals, the average time between the 6thand 7thand between the 7thand 8thround of division in the ABala lineage is 28 min and 36 min, respectively. In cdc-25.2(RNAi)animals, the
average time is 36 min and 52 min, respectively. In general, many cell divisions of the last three rounds of division during embryonic development are blocked (Figure 3 and Figure S6). For example, the divisions of the NSM neuroblasts are blocked incdc-25.2(RNAi) embryos (Figure 1C). In addition, the ABarp lineage is particularly sensitive to reduced levels ofcdc-25.2 function. Most of the cell divisions during the 9thround of division are blocked in the ABarp lineage (Table S3, Figure 3 and Figure S6). For comparison, in the case of other AB descendants, only half or less than half of the cell divisions during the 9thround of division are blocked (Table S3). We also observed severe cell division defects in the C and E lineages in cdc-25.2(RNAi) animals (Figure 3 and Figure S6). Interestingly, the cell lineages that exhibit increased sensitivity to reduced levels ofcdc-25.2activity are identical to the cell lineages that are affected in ces-1(n703gf); cya-1(bc416) animals. In summary, these findings support the notion that, in a specific set of lineages, ces-1, cdc-25.2 and cya-1 act together to control cell cycle progression. These lineages and cells include the ABarp, C and E lineages as well as the NSM neuroblasts.
Finally, to determine whether the loss of ces-1function affects the phenotype caused by cya-1(bc416), we analyzed the NSM neuroblast division in animals homozygous for cya-1(bc416) and theces-1deletion allele tm1036. tm1036is a 1.3 kb deletion that removes exons 2, 3 and 4 of theces-1transcription unit and that is predicted to result in the synthesis of a truncated protein lacking two of the five zinc-finger domains of the CES-1 protein [20]. ces-1(tm1036)animals are indistinguishable from wild-type animals at the dissection microscope level, and in an otherwise wild-type background, the loss ofces-1function causes no obvious phenotype in the NSM lineage [17,19,20]. We found that, in theced-3mutant background,ces-1(tm1036)does not suppress the NSM neuroblast division defect caused by cya-1(bc416) (Table 1). However, ces-1(tm1036)reduces the embryonic lethality caused bycya-1(bc416). While 40% of cya-1(bc416) animals exhibit an Emb phenotype, only 26% ofces-1(tm1036); cya-1(bc416)animals exhibit an Emb phenotype (Figure 2A). Based on these observations, we suggest thatces-1may play a role in the control of cell cycle progression at least in certain cell lineages.
Genetic interactions betweencya-1anddnj-11
Like ces-1(n703gf), the loss ofdnj-11function causes symmetric NSM neuroblast division and inappropriate NSM sister cell survival [17,19]. Therefore, we determined whether the loss of dnj-11 function also enhances the NSM neuroblast division defect caused by cya-1(bc416). We found that animals homozygous for cya-1(bc416)anddnj-11(tm2859), a deletion allele ofdnj-11that removes 614 base pairs of the coding region [17], exhibit a partially penetrant Emb phenotype (data not shown). Whereas in viable larvae 61% of the NSM neuroblasts had divided, only 30% of the NSM neuroblasts divide indnj-11(tm2859); cya-1(bc416)animals that arrest during embyogenesis (at 15uC, Table 1). For comparison, 92% of NSM neuroblasts divide incya-1(bc416)animals raised at 15uC. These findings demonstrate that, likeces-1(n703gf), the loss of dnj-11function enhances the NSM neuroblast division defect caused bycya-1(bc416). Based on these findings, we conclude that dnj-11 regulatesces-1function also in the context of cell cycle progression.
Discussion
Figure 5. CES-1 binds to an upstream region of thecdc-25.2locus.The genome-wide binding sites of the CES-1 protein were identified using ChIP-seq. Shown are the distributions of CES-1-bound regions around the genomic loci of the fourcdc-25genes, whose transcription units are indicated by blue arrows. The black boxes correspond to the gene exons. The red arrow points to the CES-1-bound region upstream ofcdc-25.2. Data was visualized using Integrated Genome Browser based on genome WS190 ofC. elegans[39].
cell lineage and within a short period of time (,150 min), CES-1 therefore impacts on at least three processes (cell cycle progression, cell polarity and apoptosis) that are fundamentally important to normal development. We speculate that it is through their ability to impact on these processes in a spatially and temporally coordinated manner that Snail-related transcription factors play a crucial role in normal development and tumorigenesis.
The role ofC. elegans Cyclin A in cell cycle progression
We have isolated and characterized a hypomorphic allele of the cya-1gene, one of twoC. elegans cyclin A genes [31]. Thiscya-1 mutation,bc416, presumably results in a reduction in the level of CYA-1 protein thereby causing cell division defects in specific lineages (ABarp, C, E and NSM lineages) and partially penetrant embryonic lethality. Given that animals homozygous for acya-1
Figure 6.ces-1Snail represents a functional link between cell cycle progression, cell polarity and apoptosis in the NSM lineage. Genetic model ofces-1Snail functions in the NSM neuroblast (top), the NSM and the NSM sister cell (bottom). In the NSM neuroblast,ces-1function is negatively regulated by the genesdnj-11MIDA1 andces-2bZIP.ces-1affects cell cycle progression in the NSM neuroblast by negatively regulating
cdc-25.2Cdc25.ces-1also affects the polarity of the NSM neuroblast. However, to date, it is unclear through what mechanism. After the asymmetric division of the NSM neuroblast, the level ofces-1activity is high in the larger NSM (left) and low in the smaller NSM sister cell (right). The activity of
ces-1in the NSM is sufficient to block the function ofhlh-2/3bHLH, thereby resulting in a level ofegl-1BH3-only activity that is too low to induce apoptosis. Conversely, in the NSM sister cell, the activity ofces-1is not sufficient to block the function ofhlh-2/3, thereby resulting in a level ofegl-1
deletion allele are not viable (S. van der Heuvel, personal communication), we conclude that cya-1is essential for embryo-genesis. We also present evidence thatcya-1(bc416)causes a block in cell cycle progression between S phase and M phase, which is consistent with the proposed function of the CYA-1 protein, as predicted based on the function of Cyclin A in other organisms [31,41]. Based on the function of Cyclin A in other organisms, we also speculate that it is theC. elegansCDKs CDK-1 and/or CDK-2 that CYA-1 binds to and activates [31,42]. Furthermore, we provide evidence that in the ABarp, C, E and NSM lineages,cya-1acts with cdc-25.2to cause CDK activation and, hence, cell cycle progression. Interestingly, incya-1(bc416)animals, at 15uC around 10% of the NSM neuroblast divisions are blocked, while no block in cell division was observed in the ABarp, C or E lineage (Table 1 and Figure 1C). However, at 25uC, a cell division defect was not observed for the NSM neuroblasts, while cell division defects were observed in the ABarp, C and E lineages in around 30% of the cya-1(bc416)embryos (Figure 1C and Figure S4). Therefore, the cell division defect in the NSM lineage is more severe at 15uC, whereas the cell division defects in the ABarp, C and E lineages are more severe at 25uC. We found that compared to wild-type animals, the reduction in the level of correctly splicedcya-1transcript is similar at both 15uC and 25uC incya-1(bc416)animals (Figure S3E). This suggests that the splicing defect is not temperature sensitive. Why different cell lineages (NSM neuroblast, ABarp, C and E lineages) respond differently to a reduction incya-1function and why their responses differ in their temperature sensitivity is unclear. Lineage or tissue-specific control of cell cycle progression has previously been observed inC. elegans[42–46]. One determining factor could be cell cycle length. Since cell cycle length is influenced by temperature and diverges greatly in different lineages, this behavior might reflect different CDK-activity thresholds for different lineages and/or differential regulation of CDKs within specific lineages at different temperatures [42–46].
The role of thednj-11MIDA1, ces-2HLF,ces-1Snail pathway in cell cycle progression
We propose that the dnj-11 MIDA1, ces-2 HLF, ces-1 Snail pathway, which has previously been shown to control asymmetric cell division and apoptosis in the NSM lineage [17,19,20], also controls cell cycle progression in this lineage (Figure 6). Specifi-cally, we demonstrate that the dnj-11 loss-of-function mutation tm2859 or the ces-1 gain-of-function mutation n703 enhances a defect in NSM neuroblast division caused by cya-1(bc416). Furthermore, we have uncovered the molecular mechanism through which this pathway controls cell cycle progression in this lineage. We provide evidence in support of the notion that the Snail-related transcriptional repressor CES-1 directly represses the transcription of thecdc-25.2 gene thereby decreasing the level of CDC-25.2. While in an otherwise wild-type background, this does not lead to a block in NSM neuroblast division, it does cause a block in NSM neuroblast division in a cya-1(bc416) mutant background, in which the level of CYA-1 presumably is reduced. The observation that the loss ofdnj-11function or theces-1 gain-of-function mutation n703 are synthetic lethal with cya-1(bc416) furthermore suggests that thednj-11MIDA1,ces-2HLF,ces-1Snail pathway may act to control cya-1- and cdc-25.2-dependent cell cycle progression in lineages other than the NSM lineage.
Unlikednj-11(tm2859)andces-1(n703gf), theces-1deletion allele tm1036did not affect the NSM neuroblast division defect caused by cya-1(bc416). This finding suggests thatces-1may not have a physiological role in cell cycle progression in the NSM neuroblast. Alternatively, the function ofces-1in cell cycle progression in the NSM neuroblast may be redundant with that of another gene or
genes. Interestingly, the functions of theD. melanogasterSnail-related genessnail,escargotandworniuin cell cycle progression and polarity in embryonic neuroblasts are redundant and defects are only observed in animals in which all three genes are inactivated [9,10]. Apart fromces-1, theC. elegansgenome contains at least two additional genes that encode Snail-related transcription factors, scrt-1 and K02D7.2(http://www.wormbase.org) [1]. Therefore, we speculate that the functions ofces-1 in cell cycle progression, polarity and apoptosis in the NSM lineage are redundant with the functions in these processes ofscrt-1andK02D7.2. Finally, the observation that ces-1(n703gf) enhances but ces-1(tm1036) partially suppresses the embryonic lethality caused bycya-1(bc416)supports the notion that ces-1has a physiological role in cell cycle progression in some cell lineages, such as the ABarp and C lineages.
The role of Snail-related transcription factors in the regulation of cell cycle progression
Members of the Snail superfamily have previously been shown to affect cell cycle progression. Mammalian Snail1 has been shown to block cell cycle progression in cultured epithelial cells or in mouse embryos, and this effect appears to be mediated through the direct repression ofcyclin D2 transcription [15]. In contrast, over-expression of the Snail1 gene in mouse epidermis causes hyperproliferation [47]. In D. melanogaster, the Snail-related proteins Snail, Escargot and Worniu have been shown to promote cell cycle progression in embryonic neuroblasts in part by, directly or indirectly, promotingcdc25stringexpression [10]. Cdc25stringis a critical regulator of M phase duringD. melanogasterdevelopment, whose activity is regulated at the transcriptional level [13,14]. In support of the model thatcdc25stringacts as an integrator of signals that regulate cell division duringD. melanogasterdevelopment, the cdc25string locus is subject to complex transcriptional regulation. Interestingly, it has been shown that in D. melanogaster larval neuroblasts, the level of Worniu has to be precisely regulated as well. A low level of Worniu in larval neuroblasts leads to a delay in cell cycle progression and premature differentiation, whereas an elevated level of Worniu results in cell cycle arrest due to increased Prospero expression [48]. These findings suggest that the roles of Snail-related proteins in cell cycle progression are complex and might be cell- or tissue-type specific.
Cdc25 phosphatase family ofC. elegans. Hence, depending on the cell lineage and cellular context, members of the Snail superfamily may enhance or repress the expression of Cdc25 phosphatases.
The role of the Snail-related transcription factors in tumorigenesis
The over-expression of Snail-related transcription factors has been implicated in the formation and progression of metastatic cancers, in part due to the ability of Snail-related transcription factors to induce EMTs [1–4,50]. Their potency as proto-oncogenes is thought to lie in their capability to cause loss of cell polarity and adhesive functions on the one hand and acquisition of migratory properties on the other. We argue that their ability to, within the same cell lineage, also block cell cycle progression and apoptosis is similarly important for the formation of metastases. Cells undergoing EMT have high invasive potential and are primarily found at the margins of tumors. Whether EMT has to be accompanied by a reduction in proliferation is a question still under debate. It has previously been shown that increased expression of the gene encoding the transcription factor YB-1 (Y-box binding protein), which is frequently observed in human cancers and which results in increasedSnail1expression, induces EMT accompanied by enhanced metastatic potential and reduced cellular proliferation [51,52]. Here we demonstrate that theces-1 gf mutation not only affects cell polarity and apoptosis in the NSM lineage but also enhances the defect in cell cycle progression caused by a partialcya-1loss-of-function mutation. These findings support the notion that a block in cell cycle progression and, hence, cell proliferation may be important for EMT. A block in cell cycle progression could, for example, provide the time necessary for cytoskeletal reorganizations or cell polarity transi-tions. Finally, Snail-related transcription factors have recently been implicated in the acquisition and maintenance of the stem cell fate in mammals [4,53–55]. We speculate that it is the ability of Snail-like transcription factors to coordinately influence cell cycle progression, cell polarity and apoptosis that allows specific cells to adopt and maintain the cancer stem cell fate.
Models of metastatic cancers have mainly focused on the analysis of the starting and end points of the cellular transformations that cells undergo during the formation of metastases (i.e.the epithelial and mesenchymal phenotype) [5]. There is a need forin vivomodels that allow the analysis of intermediate stages of this process. We suggest that the over-expression of the Snail-related geneces-1inC. elegans(i.e.theces-1gf phenotype) may serve as such a model at least for certain stages of this process. The ability to combine systems biology approaches (such as ChIP-seq analyses) with cell biological and genetic dissection at single cell resolution will allow us to further dissect the complex role of Snail-like transcription factors during normal development and tumorigenesis.
Materials and Methods
Strains and genetics
C. elegans strains were maintained and cultured as described [56]. Bristol N2 was used as the wild-type strain, unless noted otherwise. CB4856 (Hawaii) was used for SNP mapping. Mutations and transgenes used in this study are listed below and are described by Riddleet al.unless noted otherwise [57]: LGI: ces-1(n703gf), ces-1(tm1036)(National BioResource Project) (3 times backcrossed). LGII: rrf-3(pk1426) [58]. LGIII: dpy-17(e164), cya-1(bc416)(this study) (5 times backcrossed),bcIs66(Ptph-1his-24::gfp) (this study),unc-69(e587), ltIs38 (Ppie-1gfp::ph
PLC1d
) [25]. LGIV: ced-3(n717), dnj-11(tm2859) [17]. LGV: ltIs44 (Ppie-1mCherry::phPLC1d) [25],cdc-25.2(ok597)[40]. LGX:lin-15(n765ts).
Molecular analysis
The plasmids pBC1153 (cdc-25.2) and pBC1282 (cdc-25.3) used forin vitrotranscription of double-strand (ds) RNA were generated by cloning PCR fragments containing exons of the targeted genes into the EcoRV site of pBluescript II KS+. The plasmid pBC1098 (cya-1), which was used for RNAi by feeding as well as in vitro transcription of dsRNA, was generated by cloning a PCR fragment containing genomic DNA of the cya-1 locus into the NcoI and XmaI sites of pPD129.36 [59]. The plasmids pMM#47 (PHSces-1; pPD49.78 based) and pMM#48 (PHSces-1; pPD49.83 based) were generated using a full-length ces-1 cDNA (R.H. Horvitz and M.M. Metzstein, personal communication). For rescue experiments, DNA fragments containing the gene of interests (including regulatory regions) were amplified by PCR (NEB LongAmp Taq) and purified. The sequences of oligonucle-otides used for PCR are provided in Table S5.
RNA interference
RNAi by feeding was performed as described by Fire and co-workers [59] using 6 mM IPTG. For RNAi experiments by microinjection [60], pBC1153 (cdc-25.2) and pBC1282 (cdc-25.3) were used as templates and oligonucleotides 59 -ttgtaaaacgacggc-cag-39and 59-catgattacgccaagcgc-39as primers to generate PCR products containing at their ends, either the T3 or T7 promoter. pBC1098 (cya-1) was used as template and oligonucleotides 59 -taatacgactcactataggg-39 as primer to generate PCR products containing T7 promoter at both ends. These PCR products were used to synthesize dsRNAin vitro using T3 and T7 polymerase (Ambion). RNAi was performed by microinjection of dsRNA into young adults. Injected animals were incubated at 25uC for at least 20 h and the phenotype of their progeny was determined.
Transgenic animals
Germline transformation was performed as described [61]. For rescue experiments, ces-1(n703gf); cya-1(bc416) animals were injected with purified PCR products (0.5–6 ng/ml) using pRF4 (100 ng/ml) as coinjection marker, which confers a dominant Rol phenotype. For ces-1 over-expression experiment, pMM#47 (5 ng/ml) and pMM#48 (5 ng/ml) were injected into lin-15(n765ts)animals using pL15EK (80 ng/ml), which rescues the Muv phenotype caused bylin-15(n765ts), as coinjection marker.
Phenotypic analyses
The NSMs and the surviving NSM sister cells were identified in L3 or L4 larvae carrying the Ptph-1his-24::gfp reporter using fluorescence microscopy essentially as described for Ptph-1gfp[21]. The division of the NSM neuroblast was analyzed in embryos using a plasma membrane-targeted GFP fusion protein (P
pie-1gfp::ph PLC1d
) or mCherry fusion protein (Ppie-1mCherry::ph PLC1d
) as described [17,25]. Embryos were imaged using 4D microscopy and cell lineage analysis was performed using a Zeiss Imager microscope and SIMIBioCell software (Simi Reality Motion Systems GmbH, Unterschleissheim, Germany) as described [29].
DAPI staining and DNA content quantification
staining, and was used to identify the NSMs, NSM sister cells and non-dividing NSM neuroblasts.
RNA preparation and cDNA synthesis
Embryos were collected and frozen at 280uC in TRIzol (Invitrogen). Frozen embryo pellets were disrupted using a 7-ml tight Dounce tissue grinder (Fisher Scientific) and total RNA was prepared using the RNeasy Mini Kit (Qiagen). The first strand cDNA synthesis reaction was performed using the SuperScript III system (Invitrogen). For cDNA synthesis, an oligo (dT) primer was used.
ces-1over-expression experiment
Transgenic animals carrying an extra-chromosomal array of pMM#47, pMM#48 and the coinjection marker pL15EK were used as the sample group. Early stage embryos were isolated by bleaching synchronized hermaphrodites that contain four to six embryos. Isolated embryos were allowed to develop on large NGM plates at 20uC for 70 min.ces-1expression was induced by heat-shocking the embryos at 32uC for 1 h. After a 1.5 h recovery period at 20uC embryos were collected. RNA extraction and cDNA synthesis were performed as described above. Transgenic animals carrying an extra-chromosomal array of only coinjection marker pL15EK were used as control and were treated the same way.
Quantitative real-time PCR (qPCR)
Fast SYBR green master mix (Applied Biosystems) was used to amplify cDNA templates by real-time PCR. Each sample was performed in triplicate on a Biorad CFX96 real-time PCR machine. The sequences of the primers used are provided in Table S5. The ‘housekeeping’ gene act-1served as endogenous control [63]. Results were analyzed using the relative standard curve method. To produce the standard curve for each target sequence includingact-1, first, 5-fold dilution series of standard N2 cDNA were prepared and subjected to real-time PCR to determine Ct values for each dilution. Second, average Ct values were plotted versus the logarithm of the concentration (base 5) of the template. To determine the amounts of the target sequences in the starting samples, average Ct values for each sample were compared to the standard curve. To normalize the samples usingact-1, the result of a particular target sequence was divided by theact-1control result.
ChIP-seq (chromatin immunoprecipitation with massively parallel DNA sequencing)
Aces-1::gfpfosmid reporter was generated as described [37,38]. Briefly, using recombineering, a GFP::36FLAG tag was inserted in-frame to the C-terminus of the ces-1 transcription unit in a fosmid that contains the entire locus ofces-1. This fosmid reporter was integrated into the worm genome using the method of bombardment, which produces transgenic animals with low-copy integrated arrays. The in vivo binding sites of the CES-1::GFP::36FLAG fusion protein synthesized in these animals were then determined using the method of ChIP-seq as described [64].
Supporting Information
Figure S1 In ces-1(n703gf); cya-1(bc416) mutants, the non-dividing NSM neuroblasts have approximately 4C DNA content. The DNA content of nuclei in ces-1(n703gf); cya-1(bc416) bcIs66 animals with three GFP-positive cells was assayed by measuring the intensity of DAPI-stained nuclei. DNA content of non-dividing NSM neuroblasts, NSMs and NSM sister cells was normalized by
comparing it to the DNA content of nuclei of pharyngeal muscles that have 2C DNA content. A total of 26 animals were assayed this way. Each point represents the normalized DAPI intensity of the non-dividing NSM neuroblast or the average intensity of NSM and NSM sister cell from one animal. The significance was determined by paired t-test (***p,0.001). The non-dividing NSM neuroblasts have approximately 4C DNA content (1.80), and the NSMs and NSM sister cells have 2C DNA content (0.99). (TIF)
Figure S2 Determination of the temperature-sensitive period (TSP) of ces-1(n703gf); cya-1(bc416) and cya-1(bc416) animals. Embryos at different stages of embryonic development were dissected from (A)ces-1(n703gf); cya-1(bc416)and (B)cya-1(bc416) hermaphrodites and shifted from the permissive temperature of 15uC to the non-permissive temperature of 25uC or vice versa. Downshift experiments define the start of the TSP and upshift experiment the end of the TSP. About 60 embryos were assayed for each experimental set-up.
(TIF)
Figure S3 bc416is a mutation in theC. elegansCyclin A homolog, the gene cya-1. (A) Genes and single-nucleotide polymorphisms (SNPs, shown in bold) used for mappingbc416 are indicated. (B) Schematic of thecya-1transcription unit. Shown below is a partial sequence of the first intron (shown in small letters) and the second exon (shown in capital letters) of thecya-1gene.bc416is a G to A transition at the donor splice site (GT) in the first intron ofcya-1as indicated by the red arrow. (C) Primer_1 was used for reverse transcriptase PCR (RT-PCR). Primer_2 that amplifies only the correctly spliced transcript ofcya-1and Primer_3 that amplifies all transcripts ofcya-1were used for real-time PCR (qPCR). (D)bc416 affects the correct splicing of cya-1. All strains analyzed were homozygous for bcIs66. mRNA was extracted from mix-stage embryos of wild-type,ces-1(n703gf), ces-1(n703gf); cya-1(bc416)and cya-1(bc416)animals that were grown at 15uC and 25uC. RT-PCR products were separated using 8% polyacrylamide gels. The aberrant cya-1 transcripts in ces-1(n703gf); cya-1(bc416) and cya-1(bc416) animals, are pointed out by the red arrow heads. The black arrow head points to the correctly spliced wild-type message. The aberrant bands correspond to mRNAs that retain parts of the first intron. Due to the premature stop codon in the first intron, the translation of these aberrant mRNAs would result in the synthesis of a peptide that includes only the first 12 amino acids of the full-length CYA-1 protein. (E) mRNA levels were measured by qPCR. The level of correctly spliced transcript (amplified using Primer_2) of thecya-1 gene is normalized to the level of all the transcripts (amplified using Primer_3) of thecya-1gene. Data shown are the means6SEM from at least three independent repeats. Unpaired t-test was used to determine significance. **p,0.01, ***p,0.001 significantly different. (TIF)
Figure S4 cya-1(bc416)blocks cell divisions in the ABarp, C and E lineages. All strains analyzed were homozygous forbcIs66. Lineage analyses were performed for two (wild-type, +/+), three ( ces-1(n703gf)) and three (cya-1(bc416)) embryos raised at 25uC. Cell division defects observed in three out of three embryos are depicted in red, defects found in two out of three embryos are depicted in blue, and defects found in one out of three embryos are depicted in orange. More details are provided in the legend of Figure 3. (TIF)
uninjected N2 animals that were treated the same way were used as control. mRNA was extracted from embryos and mRNA levels of cdc-25.2 and cdc-25.3 were determined by real-time PCR (qPCR). Data are expressed as fold change relative to control.
Data shown are the means 6 SEM from three independent
repeats. Paired t-test was used to determine significance. **p,0.01 significantly different from the control.
(TIF)
Figure S6 cdc-25.2(RNAi) blocks cell divisions in the ABarp, C and E lineages. Lineages analysis were performed for two (wild-type, +/+) and three cdc-25.2(RNAi) embryos raised at 25uC. For the RNAi effect, there is some variability. The lineage ofcdc-25.2(RNAi) embryo with the strongest phenotype is shown in Figure 3, and the lineages of the other twocdc-25.2(RNAi)embryos are shown here (cell division defects observed in the embryo are depicted in green). More details are provided in the legend of Figure 3.
(TIF)
Table S1 ces-1(n703gf); cya-1(bc416) is not maternally rescued. All strains analyzed were homozygous for the integrationbcIs66, and were raised and analyzed at 15uC.ces-1(n703gf)males were crossed withces-1(n703gf); dpy-17(e164) cya-1(bc416) hermaphro-dites. Dpy F2 animals were scored for the number of GFP positive cells. n indicates the number of L3 or L4 larvae analyzed. (DOC)
Table S2 cya-1(bc416) causes a significant reduction in brood size at 25uC. Determination of brood size at 25uC. All strains analyzed were homozygous for the integrationbcIs66. Individual L4 larvae shifted to 25uC for 4 to 5 days. The brood size was determined by counting the eggs laid by one animal during its reproductive period. Someces-1(n703gf); cya-1(bc416), cya-1(bc416) and ces-1(n703gf n1434); cya-1(bc416) animals were sterile after shifting to 25uC. n indicates the number of fertile animals analyzed. The brood size indicated above is the average brood size of fertile animals. a n1434 is a ces-1 loss-of-function allele that converts an asparagine to a stop codon. This change is predicted to produce a truncated protein lacking all five zinc-fingers [20]. (DOC)
Table S3 Comparative analysis of the 9th round of division. Analysis of cell division defects by 4D lineage analysis. All strains analyzed were homozygous for bcIs66. Animals were raised and recordings were taken at 25uC.cdc-25.2(RNAi)was carried out by injection. Data shown was the analysis from two (wild-type,+/+) embryos, three (ces-1(n703gf); cya-1(bc416)) embryos, one ( cdc-25.2(RNAi)) embryo that has the strongest RNAi effect (the lineage
of this embryo is shown in Figure 3). The cell division in which P0 divides into AB and P1 is the 1stround of division. The names presented on the left correspond to the 8 AB descendants after the 4th round of division (e.g. ABala, ABalp). Each of them has 16 descendants after the 8thround of division. In wild-type, all these 16 descendants performed the 9th round of division. In ces-1(n703gf); cya-1(bc416)andcdc-25.2(RNAi)embryos, the number of descendants performing the 9thround of division is indicated. The severe cell division defects in the ABarp lineage are observed in bothces-1(n703gf); cya-1(bc416)andcdc-25.2(RNAi)embryos. (DOC)
Table S4 Comparison of the cell cycle length. Determination of cell cycle length. The Experiment was performed as described in the legend of Table S3. Data shown was the analysis from one (wild-type, +/+) embryo and one embryo (cdc-25.2(RNAi)) that has the strongest RNAi effect (the lineage of this embryo is shown in Figure 3 and Table S3). Cell cycle length is the time from the X round of division to the (X+1) round of division.aThe number is the average cell cycle length and deviation in the AB lineage only.bThe number is the average cell cycle length and deviation in the ABala lineage only. (DOC)
Table S5 Primers used in this study.aThe primers were used as describe [63].bThe primers were used as describe [40]. (DOC)
Acknowledgments
The authors thank E. Lambie, R. Saito, R. Schnabel, E. Zanin and members of the Conradt laboratory for comments on the manuscript; D. Mayka, N. Lebedeva and L. Jocham for excellent technical support; E. Lambie for use of the microinjection setup; O. Hobert for Illumina deep sequencing; M. Snyder, S. Kim and T. Kawli for performing ChIP-seq experiments; the modENCODE data coordination center (DCC) at Stanford for managing the ChIP-seq data; NHGRI for supporting the modENCODE program; B. Li, J. So¨ding and M. Siebert for help with ChIP-seq data analysis; A. Fire for plasmids; S. van der Heuvel for strain VW175; H. R. Horvitz and M. M. Metzstein for plasmids pMM#47 and pMM#48; S. Mitani and the National BioResource Center for alleles
tm1036andtm2859, and theC. elegansGenetics Center for strains.
Author Contributions
Conceived and designed the experiments: BY NM JG BC. Performed the experiments: BY NM JG. Analyzed the data: BY NM JG BC. Contributed reagents/materials/analysis tools: BY NM JG BC. Wrote the paper: BY NM BC.
References
1. Nieto MA (2002) The Snail superfamily of zinc-finger transcription factors. Nature reviews Molecular cell biology 3: 155–166.
2. Barrallo-Gimeno A, Nieto MA (2005) The Snail genes as inducers of cell movement and survival: implications in development and cancer. Development 132: 3151–3161.
3. Cobaleda C, Perez-Caro M, Vicente-Duenas C, Sanchez-Garcia I (2007) Function of the zinc-finger transcription factor SNAI2 in cancer and development. Annual review of genetics 41: 41–61.
4. Peinado H, Olmeda D, Cano A (2007) Snail, Zeb and bHLH factors in tumour progression: an alliance against the epithelial phenotype? Nature reviews Cancer 7: 415–428.
5. Nieto MA (2011) The ins and outs of the epithelial to mesenchymal transition in health and disease. Annual review of cell and developmental biology 27: 347– 376.
6. Whiteman EL, Liu CJ, Fearon ER, Margolis B (2008) The transcription factor snail repressesCrumbs3expression and disrupts apico-basal polarity complexes. Oncogene 27: 3875–3879.
7. Cano A, Perez-Moreno MA, Rodrigo I, Locascio A, Blanco MJ, et al. (2000) The transcription factor Snail controls epithelial-mesenchymal transitions by repressingE-cadherinexpression. Nature cell biology 2: 76–83.
8. Batlle E, Sancho E, Franci C, Dominguez D, Monfar M, et al. (2000) The transcription factor Snail is a repressor ofE-cadheringene expression in epithelial tumour cells. Nature cell biology 2: 84–89.
9. Cai Y, Chia W, Yang X (2001) A family of Snail-related zinc finger proteins regulates two distinct and parallel mechanisms that mediateDrosophilaneuroblast asymmetric divisions. The EMBO journal 20: 1704–1714.
10. Ashraf SI, Ip YT (2001) The Snail protein family regulates neuroblast expression of inscuteable and string, genes involved in asymmetry and cell division in
Drosophila. Development 128: 4757–4767.
11. Knoblich JA (2010) Asymmetric cell division: recent developments and their implications for tumour biology. Nature reviews Molecular cell biology 11: 849– 860.
12. Betschinger J, Knoblich JA (2004) Dare to be different: asymmetric cell division inDrosophila,C. elegansand vertebrates. Current biology : CB 14: R674–685. 13. Lehman DA, Patterson B, Johnston LA, Balzer T, Britton JS, et al. (1999)Cis
-regulatory elements of the mitotic regulator,string/Cdc25. Development 126: 1793–1803.