www.atmos-chem-phys.net/11/12339/2011/ doi:10.5194/acp-11-12339-2011
© Author(s) 2011. CC Attribution 3.0 License.
Chemistry
and Physics
Continental-scale enrichment of atmospheric
14
CO
2
from the
nuclear power industry: potential impact on the estimation of fossil
fuel-derived CO
2
H. D. Graven1,*and N. Gruber1
1Institute of Biogeochemistry and Pollutant Dynamics, ETH Zurich, Universit¨atstrasse 16, 8092 Zurich, Switzerland *now at: Scripps Institution of Oceanography, University of California-San Diego, 9500 Gilman Dr., La Jolla, CA 92093-0244, USA
Received: 26 April 2011 – Published in Atmos. Chem. Phys. Discuss.: 12 May 2011 Revised: 15 September 2011 – Accepted: 25 November 2011 – Published: 9 December 2011
Abstract. The14C-free fossil carbon added to atmospheric CO2 by combustion dilutes the atmospheric 14C/C ratio (114C), potentially providing a means to verify fossil CO2 emissions calculated using economic inventories. However, sources of 14C from nuclear power generation and spent fuel reprocessing can counteract this dilution and may bias 14C/C-based estimates of fossil fuel-derived CO2 if these nuclear influences are not correctly accounted for. Previous studies have examined nuclear influences on local scales, but the potential for continental-scale influences on 114C has not yet been explored. We estimate annual14C emissions from each nuclear site in the world and conduct an Eulerian transport modeling study to investigate the continental-scale, steady-state gradients of114C caused by nuclear activities and fossil fuel combustion. Over large regions of Europe, North America and East Asia, nuclear enrichment may offset at least 20 % of the fossil fuel dilution in114C, correspond-ing to potential biases of more than−0.25 ppm in the CO2 attributed to fossil fuel emissions, larger than the bias from plant and soil respiration in some areas. Model grid cells in-cluding high14C-release reactors or fuel reprocessing sites showed much larger nuclear enrichment, despite the coarse model resolution of 1.8◦×1.8◦. The recent growth of nu-clear14C emissions increased the potential nuclear bias over 1985–2005, suggesting that changing nuclear activities may complicate the use of114C observations to identify trends in fossil fuel emissions. The magnitude of the potential
nu-Correspondence to:H. D. Graven
clear bias is largely independent of the choice of reference station in the context of continental-scale Eulerian transport and inversion studies, but could potentially be reduced by an appropriate choice of reference station in the context of local-scale assessments.
1 Introduction
Since radiocarbon (14C) is absent in highly aged fossil fu-els, fossil fuel combustion strongly dilutes the ratio of14C/C in atmospheric CO2, reported as114C including corrections for age and fractionation. Atmospheric observations can be used to quantify the dilution of114C and thereby provide an estimate of the amount of CO2added by fossil fuel combus-tion, relative to a clean air reference site (e.g., Levin et al., 2003). Thus,114C observations and atmospheric transport modeling may provide a means for independently validating CO2emissions calculated from economic data (Pacala et al., 2010).
make such inversion-based estimates of fossil fuel fluxes on the basis of114C observations, all other influences on114C gradients must be known and corrected for.
One such influence is caused by activities of the nuclear power industry. Nuclear power and spent fuel reprocessing sites release14C in gaseous and liquid effluents, enriching 14C of CO2 in air and carbon in plant material and water surrounding nuclear sites by 4–20 000 ‰ (Levin et al., 1988, 2003; Dias et al., 2008).
Most prior studies of the nuclear influence on114C have focused on the impact of these emissions on CO2in the local areas surrounding nuclear sites, i.e., on scales of less than a hundred kilometers. For example, (Levin et al., 2003) cal-culated the influence of a nearby reactor on114C measured at the Heidelberg atmospheric sampling site in Germany us-ing dispersion modelus-ing of14C emissions observed at that reactor (Levin et al., 2003). Nuclear 14C emissions may also contribute to114C gradients at larger, i.e. continental, scales extending to several hundred or thousand kilometers; however, the potential for nuclear 14C emissions to influ-ence continental-scale gradients of 114C has not yet been explored. A previous modeling study found that the114C enrichment caused by the nuclear industry was negligible, but this study unrealistically applied14C emissions homoge-neously across northern continental regions without consid-ering the spatial distribution of individual nuclear sites (Turn-bull et al., 2009).
In this study, we consider the influence of14C emissions from nuclear sites on continental scales. When nuclear14C emissions are mixed into the larger atmosphere, will a high density of nuclear sources or even one large nuclear source create large-scale regions of high114C, relative to areas on the same continent without nuclear sites or relative to the free troposphere? An analogy could be made to SO2 emis-sions from coal-fired power plants causing acid rain depo-sition over a large-scale region that extends several hundred kilometers downwind of the power plants.
In order to investigate the potential for14C emissions from the nuclear energy industry to cause continental-scale gradi-ents in114C, we estimate14C emissions from individual nu-clear sites and conduct Eulerian atmospheric transport sim-ulations of spatially-resolved nuclear14CO2 and fossil fuel CO2 sources. We assess the potential for114C gradients from nuclear14C emissions to cause biases in fossil fuel CO2 at continental scales and compare the pattern and magnitude of the potential nuclear biases to those arising from14C ex-change with the ocean and terrestrial biosphere (Turnbull et al., 2009). By compiling observed14C emission rates, we also consider variability and uncertainty in nuclear14C emis-sions.
Unlike previous work examining the dispersion of tempo-rary, severe radioactive sources using Lagrangian approaches (e.g., Klug et al., 1992; Draxler and Hess, 1998), our study focuses on 14C emissions from multiple nuclear sites that occur continually within continental regions of the
North-ern Hemisphere. These14C emissions are part of the nor-mal operating procedures of the nuclear sites and are within government-imposed limits. We use an Eulerian framework, rather than a Lagrangian framework, to estimate steady-state gradients over large scales. This Eulerian framework is sim-ilar to that used in global and regional inversions of CO2that exploit gradients between observation stations located 200– 10 000 km from one another (e.g., Gurney et al., 2002; Peters et al., 2007), as well as in other studies of continental114C gradients (Hsueh et al., 2007; Turnbull et al., 2009). Our results therefore have specific relevance for applications uti-lizing steady-state, continental-scale114C gradients, while they do not address the small-scale gradients that exist in the local vicinity of individual nuclear sites and may also influ-ence114C at some observation sites.
2 Methods
2.1 14CO2emissions from individual nuclear power
plant sites
Radiocarbon is produced mainly through reactions of nitro-gen impurities and oxynitro-gen in uranium oxide fuel or coolant water of nuclear reactors, but also in structural material, in the graphite of graphite-moderated reactors and the cooling gas of gas-cooled reactors (Yim and Caron, 2006). Nearly all14C is released in the form of14CO2, except in Pressur-ized Water Reactors (PWRs) where14C is mainly released as14CH4(Kunz, 1985; Uchrin et al., 1998; Van der Stricht and Janssens, 2001, 2005). We assume the lifetime of14CH4 (approx. 10 yr; Prather, 1994) to be too long to contribute to continental-scale gradients in114C of CO2, permitting us to neglect14CH4emissions.
0 0.5 1 1.5 2 Theoretical 2
Forsmark 1, SE
3
J.A. Fitzpatrick, US
4
Brunsbuettel, DE
8.9,10
Gundremmingen, DE
8.9,10
Isar 1, DE
8.9,10
Kruemmel, DE
8.9,10
Philippsburg 1, DE
8.9,10 Wuergassen, DE 8,9 Olkiluoto, FI 11,12 BWR TBq/GWa 0 2 4 6 8 10 12
Dungeness A, UK
7
Oldbury, UK
7
Sizewell A, UK
7
Wylfa, UK
7
Theoretical
2
Dungeness B, UK
7
Hartlepool, UK
7
Hinkley Point B, UK
7
Torness, UK
7
Hunterston B, UK
7 Heysham, UK 7 TBq/GWa Advanced GCR Magnox GCR Theoretical 2 0 5 10 15 20 25 30 Theoretical 2 Wolsong, KR 13 Atucha, AR 8,9 Embalse, AR 8,9
Pickering A, CA
8,9
Pt. Lepreau, CA
8,9 HWR TBq/GWa 0 0.1 0.2 0.3 0.4 0.5 0.6 0.7 0.8 Theoretical 1,2 Ringhals, SE 1,3
R.E. Ginna, US
4
Indian Point, US
4 Paks, HU 5 Bohunice, SK 6 Krsko, SK 6
Sizewell B, UK
1,7 Biblis, DE 8.9,10 Neckar, DE 8.9,10 Brokdorf, DE 8.9,10 Emsland, DE 8.9,10 Grafenrheinfeld, DE 8.9,10 Grohnde, DE 8.9,10
Isar 2, DE
8.9,10
Obrigheim, DE
8.9,10
Philippsburg 2, DE
8.9,10 Stade, DE 8.9,10 Unterweser, DE 8.9,10 Mülheim−Kärlich, DE 8,9 Loviisa, FI 1,9,11,12 Novovoronnezh, RU 1,8 PWR TBq/GWa
1. Reduced 75%, total C reported 2. Yim and Caron, 2006
3. 1992; Stenström et al., 1995
4. mean 1976-82; Kunz, 1985
5. 1988-96; Uchrin et al., 1998
6. 1991-96; Uchrin et al., 1998
7. 1995-2007; UKEA, 1996-2008
8. 1980-84; UNSCEAR, 1988
9. 1985-89; UNSCEAR, 1993
10. 2001-07; BMU, 2002-2008
11. 1995-99; Van der Stricht, 2001
12. 2000-03; Van der Stricht, 2005
13. 1999-2001; Sohn et al., 2004
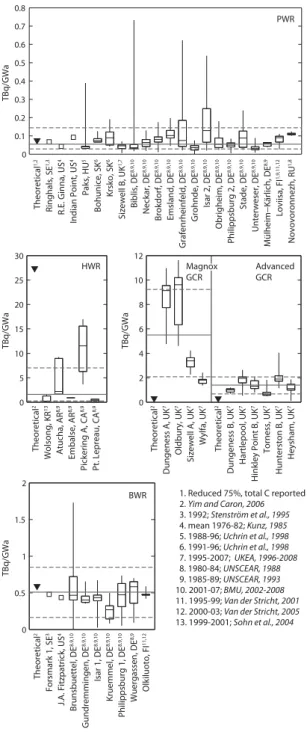
Fig. 1.Emission factors of14CO2release per electrical energy out-put at nuclear reactors of Pressurized Water Reactor (PWR), Heavy Water Reactor (HWR), Magnox and Advanced Gas-Cooled Reactor (GCR) and Boiling Water Reactor (BWR) types. Triangles indicate theoretical emission factors from Yim and Caron (2006). Observed emission factors at individual nuclear sites are shown as squares when one year or one multi-year average observation of14CO2 release was reported, or as boxplots when several years of annual mean observations were reported. Dashed lines show 70 % confi-dence intervals. Emission factors at PWRs footnoted with a “1” reported total14C release and were reduced by 75 % to account for 14CH
4emissions. Other footnotes indicate the periods of obser-vation and references. Solid lines show emission factors used, as listed in Sect. 2.1.
on observed emission rates (Fig. 1, UKEA 1996–2008). Es-timated emissions of14C from each nuclear site are tabulated in the auxiliary material.
Total electrical energy output by all nuclear reactors nearly doubled between 1985 and 2005, while total14C emissions (including14CH4) increased by only 40–60 %, from 89 [43, 172] to 130 [69, 280] TBq yr−1 (bracketed values indicate 70 % confidence intervals). This is because most of the growth in electrical output was generated by PWR- and BWR-type reactors that release comparatively less14C. Total 14C release represented about 10 % of the average production rate from cosmogenic radiation (Masarik and Beer, 2009).
The14C emission factors are associated with substantial uncertainties as they vary, for example, due to episodic vent-ing, replacement of resin columns and other maintenance (Kunz, 1985; Stenstr¨om et al., 1995; Sohn et al., 2004). To examine temporal and site-to-site variability, we compiled available observations of gaseous 14C emissions and com-pared them to electrical energy output at several individual PWRs, BWRs, HWRs and GCRs (Fig. 1). Observations at LWGRs (Konstantinov et al., 1989) were consistent with UNSCEAR (2000). No observations from FBRs were found. Substantial variability spanning 300–1000 % was found in the observations for different reactors and for individual re-actors over several years, particularly in PWRs, HWRs and Magnox GCRs. No consistent differences between reactors in different countries were apparent. We calculated the 15 and 85 % limits of the lognormal cumulative distribution of the observations for each reactor type in Fig. 1 to define a 70 % confidence interval for the emission factors, similar to a 1-sigma uncertainty in a normal distribution. We apply the observed confidence intervals to estimate uncertainty in14C emissions and uncertainty in the resulting enrichment in at-mospheric14CO2(Sects. 3 and 4).
Theoretical estimates of14C emission factors (Fig. 1; Yim and Caron, 2006) were similar to observations for PWR and BWRs, but quite different for HWRs and GCRs. This is likely a result of theoretical estimates not accounting for14C capture at some HWRs and GCRs or the poorly-known re-lease of14C produced in the moderators of GCRs.
2.2 14C emissions from other sources
NWR CMA SBL
JFJ LUT
SCH GSN
RYO WLG
δ
Cff
(ppm)
16 12 8 4 2 0
18 -45 -34 -22 -11 -6 0
-48
δΔ
ff
(permil)
a.
b.
c.
βnuc
(ppm)
0 -0.5 -1 -2
-0.25 0 1.4 2.8 5.6
0.7 22 -8
Sellafield
La Hague
Tokai
δΔ
nuc
(permil)
d.
e.
f.
NWR CMA SBL
JFJ LUT
SCH GSN
RYO WLG
0 10 20 50 90
5 262
|
βnuc
:
δ
Cff
|
(%)
g.
h.
i.
Fossil fuel-derived CO2 and Δ
14C gradients
Nuclear Δ14C gradients and potential bias in fossil fuel-derived CO 2
Absolute ratio of nuclear bias to fossil fuel-derived CO2
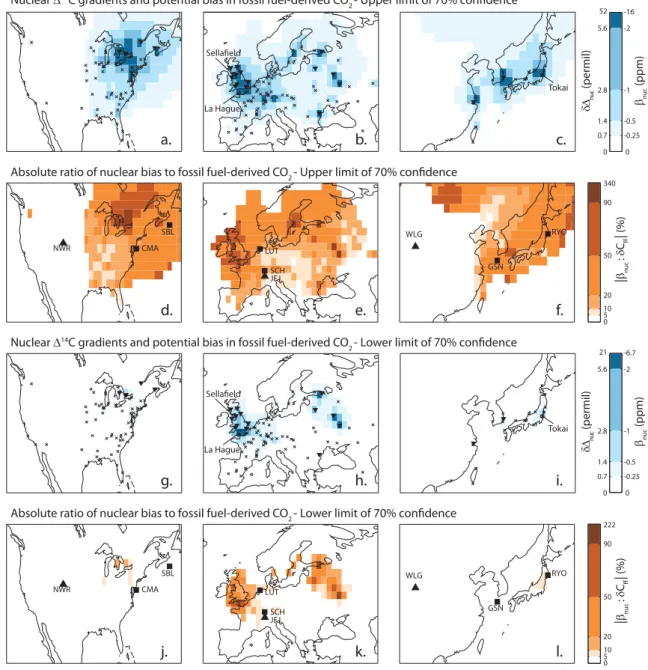
Fig. 2. (a–c)Maps of fossil fuel-derived CO2(δCff) and114C dilution (δ1ff) in continental regions of the Northern Hemisphere. Regional reference sites are indicated by triangles and observation sites by squares.(d–f)Nuclear114C enhancement (δ1nuc) and potential nuclear bias to fossil fuel-derived CO2(βnuc). Locations of low-14C release reactors are indicated by crosses, high-14C release reactors by triangles, and spent fuel reprocessing sites are labeled. (g–i)The ratio|βnuc:δCff|, in percent, shown only in grid cells whereβnucwas less than −0.25 ppm.
Our estimates of total14C emissions do not include some additional anthropogenic14C sources, despite the fact that they could also contribute to14C enrichment at continental scales. These sources include emissions from experimen-tal research reactors, reactors that were recently shutdown, radiochemical production facilities, military operations, and disposal or incineration sites for medical or research waste. We omitted these sources due to lack of data on emission rates and chemical forms of 14C. However, observations from research reactors in Germany (BMU, 2002–2008) and a radiochemical production facility in the UK (UKEA, 1996– 2008) showed14C emissions that were similar to medium-to large-sized BWRs. Emissions from newly shutdown reac-tors can be as large as 300 % of the average release during active periods (BMU, 2002–2008; UKEA, 1996–2008), but are neglected here by our use of emission factors that are tied to electrical production. As a result, our estimated14C emis-sion from the nuclear power industry does not comprise the total anthropogenic emission of14C.
2.3 Transport modeling
Surface fluxes of14C from nuclear sites and CO2from fossil fuel combustion were used as boundary conditions in simu-lations of the global TM3 atmospheric transport model with 1.8◦×1.8◦ resolution and 28 vertical levels (Heimann and Korner, 2003). Annual mean emissions of CO2from fossil fuel combustion were given by the Emissions Database for Global Atmospheric Research version 4.0 (EDGAR, avail-able at http://edgar.jrc.ec.europa.eu/index.php) for individual years 1985–2005, aggregated from 0.1◦to 1.8◦resolution.
reference site: Niwot Ridge, USA (NWR, 3.75 km a.s.l.) for North America, Jungfraujoch, Switzerland (JFJ, 3.45 km a.s.l.) for Europe and Mt. Waliguan, China (WLG, 3.81 km a.s.l.) for Asia (Fig. 2a–c). Spatial maps of gra-dients in114C in the lowest model level are presented for 2005 in Sect. 3, while temporal changes at selected sites are presented in Sect. 4.
Gradients were calculated using the simulated enhance-ment in CO2(δCff) or14CO2(δAnuc) relative to the regional reference sites, i.e.δCff=Cff−CffRandδAnuc=Anuc−ARnuc, whereR indicates the reference site. The dilution in114C caused by fossil fuel emissions,δ1ff, and the enhancement in114C caused by nuclear emissions,δ1nuc, were calculated by:
δ1ff= −δCff
1000 ‰+1R CR+δCff
(1)
δ1nuc=
δAnuc1000 ‰ Rs(CR+δCff)
(2) These equations were derived by approximate mass balance of carbon and14C.Rsis 1.176×10⁻¹², the14C/C ratio in the Modern Standard. The change in114C also depends on the background air CO2 mixing ratio and114C (CR and1R), which was assigned to be the global average for each year (Table S1). We use global average values at each regional reference site since observations are not available for all sites in all years. Though annual mean114C and CO2in Northern Hemisphere background air can vary by±5 ‰ and±1.6 ppm from the estimated global average (Levin et al., 2010; Graven et al., 2011; Keeling and Whorf, 2005), the potential error in δ1ff caused by using global average values at the regional reference sites is less than 0.8 %.
Since the spatial gradients in fossil fuel CO2are small rel-ative to the absolute concentration of CO2in the atmosphere, i.e., δCff≪CR, the dilution of 114C by fossil fuel emis-sions (δ1ff) relates toδCff by a roughly constant factor of −2.8 ‰ : 1 ppm in 2005. The bias in δCff that would oc-cur if nuclear14C enrichment was not accounted for (βnuc) similarly relates toδ1nucby approximately−2.8 ‰ : 1 ppm, since nuclear enrichment reduces apparentδ1ff.
We performed sensitivity tests to evaluate the effect of un-certainty in14C emission factors and the choice of regional reference site. To test the effect of uncertainty in the emission factors, we performed additional simulations for emissions calculated with emission factors at the lower and upper lim-its of the 70 % confidence intervals shown in Fig. 1. To test the sensitivity to the choice of reference site, we additionally calculated114C gradients relative to free tropospheric air at 2.9 km a.s.l. (the 10th model level).
3 Regional gradients in114C of CO2
The largest simulatedδCffof 11–18 ppm was associated with the most densely populated areas (Fig. 2a–c), while over large regions of North America, Europe, and AsiaδCff ex-ceeded 0.5 ppm (δ1ff<−1.4 ‰). In contrast, nuclear 14C emissions enhanced114C by more than 0.7 ‰ over large re-gions of North America, Europe and Asia in 2005 (Fig. 2d– f), offsetting the dilution of114C from fossil fuel emissions substantially.
The largestδ1nuc andβnuc was simulated over northern France and the UK due to releases from La Hague and Sel-lafield reprocessing sites and several Gas-Cooled Reactors. Though enhancement of114C was largest in grid cells con-taining large nuclear sources, negative values ofβnucextend far into downwind regions without nuclear sources. Out-flow from northern France and the UK contributed to high δ1nuc and βnuc over much of Northern Europe (Fig. 2e). The Great Lakes region of North America, central Japan and South Korea also showed substantialδ1nucandβnuc extend-ing>400 km away from nuclear sites.
The simulations clearly show a continental-scale influence of nuclear emissions: significantδ1nuc gradients extended more than 700 km (3 grid cells) away from nuclear sites in northeastern North America, Europe and Asia. This spa-tial scale is sufficiently resolved by the model resolution of TM3, 100–200 km in mid-latitude regions. However, since Eulerian models like TM3 homogenize point sources over the local grid cell, simulatedβnucnear nuclear point sources are sensitive to the model resolution and the location of the model grid. For example, the largest simulatedβnuc is in the grid cell containing the spent fuel reprocessing site at La Hague, France. βnuc simulated for the area within this grid cell (−8 ppm) is likely to change if a different model resolu-tion or model grid is used, particularly for areas within the grid cell that are particularly near to or distant from the La Hague site.
The relative magnitude of the potential biases in inferred fossil fuel-derived CO2, i.e. the absolute of the ratio ofβnuc toδCff, can amount to more than 100 % (Fig. 2g–i). Over the English Channel,βnucwas as large as 260 % ofδCff. In large regions, such as Eastern Canada, Northwestern France, the UK, Ireland, the Baltic Sea, Russia and Japan, the potential bias remained above 20 %. There were also areas with very little potential bias, owing to intense fossil fuel emissions but little to no nuclear activity, such as over the west coast of North America and most of China.
NWR CMA SBL
JFJ LUT
SCH GSN
RYO WLG
NWR CMA
SBL
JFJ LUT
SCH GSN
RYO WLG
Nuclear Δ14C gradients and potential bias in fossil fuel-derived CO
2 - Upper limit of 70% conidence
Absolute ratio of nuclear bias to fossil fuel-derived CO2 - Upper limit of 70% conidence
Absolute ratio of nuclear bias to fossil fuel-derived CO2 - Lower limit of 70% conidence Nuclear Δ14C gradients and potential bias in fossil fuel-derived CO
2 - Lower limit of 70% conidence
βnuc
(ppm)
0 -0.5 -1 -2
-0.25
0 1.4 2.8 5.6
0.7
52 -16
Sellaield
La Hague
Tokai
δΔ
nuc
(permil)
a. b. c.
βnuc
(ppm)
0 -0.5 -1 -2
-0.25
0 1.4 2.8 5.6
0.7
21 -6.7
Sellaield
La Hague
Tokai
δΔ
nuc
(permil)
g. h. i.
0 10 20 50 90
5 340
|
βnuc
:
δ
Cff
|
(%)
d. e. f.
0 10 20 50 90
5 222
|
βnuc
:
δ
Cff
|
(%)
j. k. l.
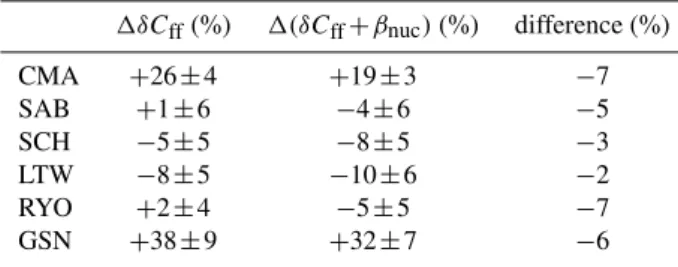
Fig. 3.Results from transport model simulations of14C emissions for 2005 estimated using emission factors at the upper and lower limits of the 70 % confidence intervals as shown in Fig. 1. Nuclear114C enhancement (δ1nuc) and potential nuclear bias to fossil fuel-derived CO2 (βnuc) for emissions at the upper(a–c)and lower(g–i)limits of 70 % confidence. The ratio|βnuc:δCff|, in percent, shown only in grid cells whereβnucwas less than−0.25 ppm for emissions at the upper(d–f)and lower(j–l)limits of 70 % confidence.
at the lower limit, δ1nuc andβnuc became 60 % smaller in North America and Asia and 40 % smaller in Europe, on av-erage. Potential biases were much less important in North America and Asia, but in large regions of Northern Europe βnuc was still comparable in magnitude to δCff (>20 %). Patterns were largely the same when we used free tropo-spheric air as the background instead of the continental refer-ence sites, andδCffchanged by less than±0.1 ppm andβnuc changed by less than±0.01 ppm in more than 85 % of grid cells shown in Fig. 2.
4 Temporal changes inδC
ff andβnuc
86 88 90 92 94 96 98 00 02 04 0
1 2 3 4 5 6 7 8
CMA SAB
86 88 90 92 94 96 98 00 02 04 0
1 2 3 4 5 6 7 8
LUT SCH
86 88 90 92 94 96 98 00 02 04 0
1 2 3 4 5 6 7 8
RYO GSN
86 88 90 92 94 96 98 00 02 04 -1.75
-1.5 -1.25 -1 -0.75 -0.5 -0.25 0
CMA SAB
86 88 90 92 94 96 98 00 02 04 -1.75
-1.5 -1.25 -1 -0.75 -0.5 -0.25 0
LUT SCH
86 88 90 92 94 96 98 00 02 04 -1.75
-1.5 -1.25 -1 -0.75 -0.5 -0.25 0
RYO GSN
86 88 90 92 94 96 98 00 02 04 0
10 20 30 40
50 CMA SAB
86 88 90 92 94 96 98 00 02 04 0
10 20 30 40 50 LUT
SCH
86 88 90 92 94 96 98 00 02 04 0
10 20 30 40
50 RYO GSN
a.
b.
c.
d.
e.
f.
g.
h.
i.
δCf
δCf+βnuc
|
βnuc
:
δ
Cff
|
(%)
βnuc
(ppm)
δ
Cff
(ppm)
Fig. 4. (a–c)Annual mean fossil fuel-derived CO2(δCff, solid lines) and fossil fuel-derived CO2including the nuclear bias (δCff+βnuc, dashed lines) simulated at each observation site for 1985–2005.(d–f)Annual meanβnucsimulated at each observation site for 1985–2005. Panels(g–i)Annual mean ratio|βnuc:δCff|simulated at each observation site for 1985–2005, in percent. Filled areas show 70 % confidence intervals.
Lutjewad, Netherlands (LUT) and Schauinsland, Germany (SCH) in Europe; and Gosan, South Korea (GSN) and Ryori, Japan (RYO) in Asia.
ModeledδCffwas between 1 and 7 ppm at the 6 sites over 1985–2005 (Fig. 4a–c). At each site,δCffspanned±0.2 to ±1.0 ppm from the mean value due to an overall trend and/or to variations in emission and atmospheric transport.βnucwas −0.1 to−0.8 ppm, with the largest negative potential biases at Cape May, Lutjewad and Ryori (Fig. 4d–f).
At all sites, βnuc grew in proportion to δCff (Fig. 4g–i) as the number and activity of nuclear reactors expanded be-tween 1985–2005 and, at the European sites, as δCff de-creased. A strong increase in βnuc is apparent at Gosan, caused by the implementation of 3 Heavy Water Reactors at Wolsong, South Korea in the 1990s. To assess the impact of growth in βnuc on the apparent trend in δCff, we com-pare 5-yr means ofδCff andδCff+βnuc for 1985–1989 and 2001–2005 (Table 1). SimulatedδCffincreased at the North American and Asian sites and decreased at the European sites between 1985–1989 and 2001–2005. Including the simulta-neous change inβnuccausedδCffto appear to have increased 6–7 % less at Cape May and Gosan, to have decreased 2–3 %
more at Schauinsland and Lutjewad, and to have decreased by 4–5 % instead of increased by 1–2 % at Sable Island and Ryori. The largest effects were at Cape May and Ryori, sig-nificantly larger in magnitude than uncertainties in the frac-tional change in localδCff or δCff+βnuc due to variations in emission and atmospheric transport. Our results indicate that concurrent trends inβnuccan bias and change the sign of 114C-based observations ofδCfftrends.
δCffcalculated in comparison to free tropospheric air was 3–40 % smaller than δCff calculated using the continental reference sites, except at Schauinsland where it was slightly larger. However, in comparison to free tropospheric air,βnuc was simultaneously reduced by a comparable amount (1– 44 %) so that the ratio ofβnuctoδCffchanged very little.
Table 1. Change in simulatedδCff andδCff+βnucbetween 5-yr means for 1985–1989 and 2001–2005 at the sites shown in Fig. 4. Uncertainties were calculated using the standard error in simulated
δCff andδCff+βnuc over the 5-yr periods, which comprise only variations in emissions and atmospheric transport over the 5-yr pe-riods. Uncertainties in14C emission factors are not included.
1δCff(%) 1(δCff+βnuc)(%) difference (%) CMA +26±4 +19±3 −7
SAB +1±6 −4±6 −5
SCH −5±5 −8±5 −3
LTW −8±5 −10±6 −2
RYO +2±4 −5±5 −7
GSN +38±9 +32±7 −6
the observations show that emission factors at each site vary from year to year (Fig. 1), which may cause different patterns and larger variability than our simulations.
5 Comparison with previous estimates ofβnuc
Turnbull et al. (2009) simulatedβnuc using a slightly lower resolution atmospheric transport model with surface fluxes of 14C from the nuclear industry that were spread homo-geneously across the Northern continents. They report simulated βnuc at Cape May of only 0 to −0.2 ppm over 2002–2008, much smaller than our value of −0.8 [−0.3, −1.8] ppm for 2005 (Fig. 4). A similarly large underestima-tion occurs in the study of Turnbull et al. (2009) for Orleans, France (48.8◦N, 2.5◦E). There, they reported a simulated
βnuc of 0 to−0.2 ppm over 2002–2008 while we simulated a value of−0.9 [−0.6,−1.4] ppm for 2005 (Figs. 2 and 3). This is a consequence of us emitting the nuclear14C from point sources rather than spreading the emissions homoge-nously over the northern continents. Our result for Cape May could also be overestimated by the presence of two nuclear reactors in the local model grid cell, both located near the western edge of the grid cell while Cape May is located near the eastern edge. But the potential biases in the 5th model level (900 m) above Cape May and in the adjacent grid cell to the east are−0.4 ppm, also substantially larger than Turn-bull et al. (2009). Similarly, there are two nuclear sites within the local grid cell of Orleans but the potential bias in the 5th model level above Orleans is also substantially larger than Turnbull et al. (2009),−0.5 ppm. No nuclear sites are present in the grid cells containing Sable Island, Lutjewad, Schauins-land, Ryori and Gosan.
Simulated continental-scale effects can be compared with local-scale effects at Heidelberg, Germany (49.4◦N, 8.7◦E), estimated by Levin et al. (2003). Our simulated continental-scale influence of nuclear emissions at Heidelberg is half as large as the estimated local-scale influence from the nearby Philippsburg nuclear site. Levin et al. (2003) used observed
14C emissions at Philippsburg with a dispersion model to es-timate local114C enrichment of 0.2–10 ‰ over 1986-2002, averaging 4.8±2.0 ‰. Our simulated nuclear enrichment in the grid cell containing Heidelberg is 2.1 [1.1, 3.7] ‰ in 2005 (Figs. 2 and 3), which equates to a potential bias of −0.7 [−0.4,−1.3] ppm. Our estimate is lower than Levin et al. (2003) mainly because, as described above, the coarse resolution model underestimates114C near to nuclear point sources. However, another fundamental difference from Levin et al. (2003) is that we consider the influence from all nuclear sites, not only from Phillipsburg. Our results indi-cate that long-range transport from more distant nuclear sites is likely to be significant in Heidelberg, in addition to local transport from the Phillipsburg site.
6 Discussion and conclusions
Accounting for the spatial distribution of nuclear sites reveals several regions with a high density of14C sources that are important to consider in determining continental-scale influ-ences on114C. Simulation of spatially-resolved14C emis-sions from individual nuclear sites in the Northern Hemi-sphere shows that these14C emissions contribute to a114C enrichment at continental scales that is substantial enough to partially counteract the fossil fuel dilution effect. Simulated potential nuclear biases of more than−0.25 ppm toδCff ex-tend over spatial scales on the order of 1000 km in populated regions of the Northern Hemisphere. This spatial scale is sufficiently resolved by the coarse Eulerian model we used, 100–200 km in mid-latitude regions, so this result is not lim-ited by our model or model resolution.
Potential nuclear biases of −0.25 ppm or more make a substantial contribution to the total uncertainty in fossil fuel-derived CO2 determined by114C measurements, which is comprised of a component from measurement uncertainty and a component from uncertainty in non-fossil influences on 114C. The measurement uncertainty is presently>0.5 ppm for an individual sample but can be as low as 0.3 ppm for an annual mean, calculated by averaging many samples (Levin and R¨odenbeck, 2008). In continental studies, respiration of14C-enriched carbon from terrestrial ecosystems has been regarded to be the only substantial non-fossil influence on 114C (Hsueh et al., 2007; Turnbull et al., 2009). However, by accounting for the location of nuclear point sources, rather than spreading the emissions homogenously over the north-ern continents as in Turnbull et al. (2009), our results suggest that nuclear influences on114C are likely to be larger than those previously estimated (Sect. 5; Turnbull et al., 2009).
consistent with model results of114C enrichment of 0–2 ‰ above North America by Hsueh et al. (2007). Our simulated potential biases are more than−0.25 ppm over large regions, and up to several ppm near to nuclear sites. Additionally, βnuc tends to show stronger gradients than those resulting from relatively homogeneous biospheric sources (Turnbull et al., 2009). Together, nuclear and respiratory influences on114C likely cause potential negative biases inδCfflarger than 0.5 ppm over large regions of the Northern Hemisphere, similar to uncertainty contributed by measurement precision. The broad, continental-scale patterns we simulated using an Eulerian transport modeling approach are caused by the aggregate influence on114C from all nuclear sites in the re-gion, which cannot be accounted for by dispersion modeling of nearby reactors only. Our results show that the compari-son of observed114C to a reference site>100–200 km away may therefore include a substantial continental-scale effect, in addition to any local-scale effects from nearby reactors. Observational studies at finer (urban) scales may be effective in reducing the continental-scaleβnuc, however, by using lo-cal observation sites to define background air composition, particularly in areas that are far from nuclear sources.
While our objective was not to resolve local-scale disper-sion and transport, simulated continental-scale βnuc is still highly dependent on model resolution such that stronger gra-dients exist within the 100–200 km grid used in the rather coarse TM3 simulations. Higher resolution regional models are likely to provide better estimates of continental-scaleβnuc at particular sites. Higher resolution models may also rep-resent transport to high altitude sites more accurately. Our results are also sensitive to errors in model transport, par-ticularly in the vertical transport out of the boundary layer, though TM3 shows realistic vertical profiles of CO2 on an annual mean basis (Stephens et al., 2007).
The simulated114C gradients include substantial uncer-tainties due to the large uncertainty associated with estimated 14C emissions. The observed variability in emission factors (Fig. 1) suggests thatβnuccould be much stronger (+300 %) or weaker (−60 %) in magnitude (Fig. 3). Moreover, 14C emissions can vary strongly between different reactors or years (Fig. 1; Sect. 2.1) and can occur in discrete periods when the reactor effluent is vented to the atmosphere.
In the coming decades, nuclear 14C release is likely to grow in Asia and decline in Europe. 58 nuclear power reac-tors are currently under construction in Asia, with the largest share (23) in China. Nearly all the reactors will be of the Pressurized Water Reactor type that has the lowest emission factor. However, a high density of low-14C release reac-tors caused simulated biases of up to−1.5 ppm in Germany (Fig. 2e). At the same time, several reactors are being shut down due to age, including high-14C release Magnox-type gas-cooled reactors in the UK, or due to the nuclear accident at Fukushima Daiichi Nuclear Power Plant in Japan in March 2011. More than half of Japan’s nuclear reactors were imme-diately shut down for at least several months after the
acci-dent, while Germany immediately shut down several older reactors and pledged to phase out all nuclear reactors within a decade. Several other countries delayed or canceled plans to build new reactors and the fuel reprocessing site at Sell-afield, UK was shut down.
Whether14C releases grow or decline, trends inβnuc can bias the apparent change in δCff over time and complicate the use of atmospheric114C to identify growth or reduction in CO2emissions. Trends inβnuc caused potential biases of 2–7 % inδCff trends in our simulations, comparable to the emissions reductions agreed upon in the Kyoto Protocol.
Our results suggest that the influence of nuclear activi-ties on atmospheric114C must be correctly accounted for in large regions of North America, Europe and Asia to estimate δCff accurately using observations of114C in CO2. High resolution 14C release data from each nuclear reactor site would improve estimates of114C enrichment by transport modeling. Alternatively, measures to reduce or eliminate14C release would improve accuracy in observation-based esti-mates ofδCff, though such measures would cause temporal changes toβnucthat would influence apparent trends inδCff.
Supplement related to this article is available online at: http://www.atmos-chem-phys.net/11/12339/2011/ acp-11-12339-2011-supplement.zip.
Acknowledgements. We thank C. R¨odenbeck for assistance with
the TM3 model and M.-S. Yim and F. Caron for helpful discus-sions. F. Vogel and J. Turnbull provided valuable comments on the manuscript. This work was financially supported by ETH Zurich.
Edited by: M. Heimann
References
BMU: Umweltradioaktivit¨at und Strahlenbelastung, Tech. rep., Bundesumweltministerium, Bonn, Germany, 2002–2008. Dias, C., Santos, R., Stenstr¨om, K., N´ıcoli, I., Skog, G., and da
Silveira Corrˆea, R.: 14C content in vegetation in the vicinities of Brazilian nuclear power reactors, J. Environ. Rad., 99, 1095– 1101, 2008.
Draxler, R. R. and Hess, G. D.: An overview of the HYSPLIT 4 modelling system for trajectories, dispersion, and deposition, Austral. Meteorol. Mag., 47, 295–308, 1998.
Graven, H. D., Stephens, B. B., Guilderson, T. P., Campos, T. L., Schimel, D. S., Campbell, J. E., and Keeling, R. F.: Vertical profiles of biospheric and fossil fuel-derived CO2and fossil fuel CO2: CO ratios from airborne measurements of114C, CO2and CO above Colorado, USA, Tellus B, 61, 536–546, 2009. Graven, H. D., Guilderson, T. P. and Keeling, R. F.:
Obser-vations of radiocarbon in CO2 at La Jolla, California, USA 1992–2007: Analysis of the long-term trend, J. Geophys. Res., doi:10.1029/2011JD016533, in press, 2011.
Gurney, K. R., Law, R. M., Denning, A. S., Rayner, P. J., Baker, D., Bousquet, P., Bruhwiler, L., Chen, Y.-H., Ciais, P., Fan, S., Fung, I. Y., Gloor, M., Heimann, M., Higuchi, K., John, J., Maki, T., Maksyutov, S., Masarie, K., Peylin, P., Prather, M., Pak, B. C., Randerson, J., Sarmiento, J., Taguchi, S., Takahashi, T., and Yuen, C.-W.: Towards robust regional estimates of CO2sources and sinks using atmospheric transport models, Nature, 415, 626– 630, 2002.
Heimann, M., and Korner, S.: The Global Atmospheric Tracer Model TM3, Model Description and Users Manual Release 3.8a, Technical Report 5, Max Planck Institute for Biogeochemistry (MPIBGC), Jena, Germany.
Hsueh, D. Y., Krakauer, N. Y., Randerson, J. T., Xu, X., Trum-bore, S. E., and Southon, J. R.: Regional patterns of radiocarbon and fossil fuel-derived CO2in surface air across North America, Geophys. Res. Lett., 34, L02816, doi:10.1029/2006GL027032, 2007.
Kalnay, E., Kanamitsu, M., Kistler, R., Collins, W., Deaven, D., Gandin, L., Iredell, M., Saha, S., White, G., Woollen, J., Zhu, Y., Leetmaa, A., Reynolds, R., Chelliah, M., Ebisuzaki, W., Higgins, W., Janowiak, J., Mo, K. C., Ropelewski, C., Wang, J., Jenne, R., and Joseph, D.: The NCEP/NCAR 40-Year Reanalysis Project, B. Am. Meteorol. Soc., 77, 437–472, 1996.
Keeling, C. D. and Whorf, T. P.: Atmospheric CO2records from sites in the SIO air sampling network, in: Trends: a Compendium of Data on Global Change, Carbon Dioxide Information Analy-sis Center, Oak Ridge National Laboratory, US Department of Energy, Oak Ridge, TN, USA, 2005.
Klug, W., Graziani, G., Grippa, G., Pierce, D., and Tassone, C.: Evaluation of long range atmospheric transport models using environmental activity data from the Chernobyl accident (The ATMES Report), Elsevier Applied Science, London and New York, 1992.
Koarashi, J., Akiyama, K., Asano, T., and Kobayashi, H.: Chemical composition of14C in airborne release from the Tokai reprocess-ing plant, Japan, Rad. Prot. Dosimetr., 114, 551–555, 2005. Konstantinov, E. A., Korablev, N. A., Solov’ev, E. N., Shamov, V. P.,
Fedorov, V. L., and Litvinov, A. M.:14C emission from RBMK-1500 reactors and features determining it, Atom. Energ., 66, 77– 79, 1989.
Kunz, C.: Carbon-14 discharge at three light-water reactors, Health Phys., 49, 25–35, 1985.
Levin, I., Kromer, B., Barabas, M., and Muennich, K. O.: Environ-mental distribution and long-term dispersion of reactor14CO2 around two German nuclear power plants, Health Phys., 54, 149– 156, 1988.
Levin, I., Kromer, B., Schmidt, M., and Sartorius, H.: A novel ap-proach for independent budgeting of fossil fuel CO2over Eu-rope by 14CO2 observations, Geophys. Res. Lett., 30, 2194, doi:10.1029/2003GL018477, 2003.
Levin, I., and R¨odenbeck, C.: Can the envisaged reductions of fossil fuel CO2emissions be detected by atmospheric observa-tions?, Naturwissenschaften, 95, 203–208, doi:10.1007/s00114-007-0313-4, 2008.
Levin, I., Naegler, T., Kromer, B., Diehl, M., Francey, R. J., Gomez-Pelaez, A. J., Steele, L. P., Wagenbach, D., Weller, R., and Wor-thy, D. E.: Observations and modelling of the global distribution and long-term trend of atmospheric14CO2, Tellus B, 62, 26–46, 2010.
Masarik, J., and Beer, J.: An updated simulation of particle fluxes and cosmogenic nuclide production in the Earths atmosphere, J. Geophys. Res., 114, D11103, doi:10.1029/2008JD010557, 2009. Nakada, A., Miyauchi, T., Akiyama, K., Momose, T., Kozawa, T., Yokota, T., and Ohtomo, H.: Radioactive Airborne Effluent Dis-charged from Tokai Reprocessing Plant (1998–2007), Tech. rep., Japan Atomic Energy Agency, Tokai-mura, Japan, 2008. Pacala, S. W., Breidenich, C., Brewer, P. G., Fung, I., Gunson, M.,
Heddle, G., Law, B., Marland, G., Paustian, K., Prather, M., Randerson, J. T., Tans, P., and Wofsy, S. C.: Verifying Green-house Gas Emissions: Methods to Support International Climate Agreements, Committee on Methods for Estimating Greenhouse Gas Emissions, National Research Council, National Academy of Sciences, USA, 2010.
Peters, W., Jacobson, A. R., Sweeney, C., Andrews, A. E., Con-way, T. J., Masarie, K., Miller, J. B., Bruhwiler, L. M. P., P´etron, G., Hirsch, A. I., Worthy, D. E., van der Werf, G. R., Randerson, J. T., Wennberg, P. O., Krol, M. C., and Tans, P. P.: An atmospheric perspective on North American carbon dioxide exchange: CarbonTracker, Proc. Nat. Acad. Sci., 104, 18925– 18930, 2007.
Prather, M. J.: Lifetimes and eigenstates in atmospheric chemistry, Geophys. Res. Lett., 21, 801–804, 1994.
Randerson, J. T., Enting, I., Schuur, E. A. G., Caldiera, K. and Fung, I. Y.: Seasonal and latitudinal variability of troposphere
114CO2: Post bomb contributions from fossil fuels, oceans, the stratosphere, and the terrestrial biosphere, Global Biogeochem. Cycles, 16, 1112, doi: 10.1029/2002GB001876, 2002.
Schneider, M. and Marignac, Y.: Spent Nuclear Fuel Reprocessing in France, Research Report 4, International Panel on Fissile Ma-terials, Princeton, New Jersey, USA, 2008.
Sohn, W., Kang, D. W., and Chi, J.: Approaches for reduc-ing carbon-14 stack emissions from Korean CANDU® nuclear power plant, J. Nucl. Sci. Technol., 41, 235–246, 2004.
Stenstr¨om, K., Erlandsson, B., Hellborg, R., Wiebert, A., Skog, S., Vesanen, R., Alpsten, M., and Bjurman, B.: A one-year study of the total air-borne14C effluents from two Swedish light-water reactors, one boiling water and one pressurized water reactor, J. Radioanal. Nucl. Chem., 198, 203–213, 1995.
Stephens, B. B., Gurney, K. R., Tans, P. P., Sweeney, C., Pe-ters, W., Bruhwiler, L., Ciais, P., Ramonet, M., Bousquet, P., Nakazawa, T., Aoki, S., Machida, T., Inoue, G., Vinnichenko, N., Lloyd, J., Jordan, A., Heimann, M., Shibistova, O., Lan-genfelds, R. L., Steele, L. P., Francey, R. J., and Denning, A. S.: Weak northern and strong tropical land carbon uptake from vertical profiles of atmospheric CO2, Science, 316, 1732–1735, doi:10.1126/science.1137004, 2007.
Turnbull, J., Rayner, P., Miller, J. B., Naegler, T., Ciais, P., and Co-zic, A.: On the use of14CO2as a tracer for fossil fuel CO2: quantifying uncertainties using an atmospheric transport model, J. Geophys. Res., 114, D22302, doi:10.1029/2009JD012308, 2009.
Uchrin, G., Hertelendi, E., Volent, G., Sl´avik, O., Mor´avek, J., Kobal, I., and Vokal, B.:14C measurements at PWR-type nuclear power plants in three middle European countries, Radiocarbon, 40, 439–446, 1998.
UKEA: Radioactivity in Food and the Environment, UK Environ-ment Agency, 1996–2008.
United Nations Scientific Committee on the Effects of Atomic Radation, Vienna, 1988, 1993 and 2000.
Van der Stricht, S. and Janssens, A.: Radioactive effluents from nu-clear power stations and nunu-clear fuel reprocessing sites in the European Union, Radiation Protection, European Commission, 2001 and 2005.