BGD
10, 10721–10758, 2013
Soil14CO
2dynamics C. L. Phillips et al.
Title Page
Abstract Introduction
Conclusions References
Tables Figures
◭ ◮
◭ ◮
Back Close
Full Screen / Esc
Printer-friendly Version
Interactive Discussion
Discussion
P
a
per
|
D
iscussion
P
a
per
|
Discussion
P
a
per
|
Discuss
ion
P
a
per
|
Biogeosciences Discuss., 10, 10721–10758, 2013 www.biogeosciences-discuss.net/10/10721/2013/ doi:10.5194/bgd-10-10721-2013
© Author(s) 2013. CC Attribution 3.0 License.
Open Access
Biogeosciences
Discussions
Geoscientific Geoscientific
Geoscientific Geoscientific
This discussion paper is/has been under review for the journal Biogeosciences (BG). Please refer to the corresponding final paper in BG if available.
Biological and physical influences on soil
14
CO
2
seasonal dynamics in a temperate
hardwood forest
C. L. Phillips1,*, K. J. McFarlane1, D. Risk2, and A. R. Desai3
1
Center for Accelerator Mass Spectrometry, Lawrence Livermore National Laboratory, Livermore, CA, USA
2
Department of Earth Sciences, St. Francis Xavier University, Antigonish, Nova Scotia, Canada
3
Department of Atmospheric and Oceanic Sciences, University of Wisconsin, Madison, WI, USA
*
now at: Department of Crops and Soil Science, Oregon State University, Corvallis, OR, USA Received: 4 June 2013 – Accepted: 11 June 2013 – Published: 1 July 2013
Correspondence to: C. L. Phillips ([email protected])
BGD
10, 10721–10758, 2013
Soil14CO
2dynamics C. L. Phillips et al.
Title Page
Abstract Introduction
Conclusions References
Tables Figures
◭ ◮
◭ ◮
Back Close
Full Screen / Esc
Printer-friendly Version
Interactive Discussion
Discussion
P
a
per
|
D
iscussion
P
a
per
|
Discussion
P
a
per
|
Discuss
ion
P
a
per
|
Abstract
While radiocarbon (14C) abundance in standing stocks of soil carbon has been used to evaluate rates of soil carbon turnover on timescales of several years to centuries, soil-respired14CO2 measurements are an important tool for identifying more immedi-ate responses to disturbance and climimmedi-ate change. Soil14CO2data are often temporally
5
sparse, however, and could be interpreted better with more context for typical seasonal ranges and trends. We report on a semi-high-frequency sampling campaign to distin-guish physical and biological drivers of soil14CO2 at a temperate forest site in North-ern Wisconsin, USA. We sampled14CO2profiles every three weeks during snow-free months through 2012, in three intact plots and one trenched plot that excluded roots. 10
Respired14CO2 declined through the summer in intact plots, shifting from an older C composition that contained more bomb 14C, to a younger composition more closely resembling present14C levels in the atmosphere. In the trenched plot respired14C was variable but remained comparatively higher than in intact plots, reflecting older bomb-enriched 14C sources. Although respired 14CO2 from intact plots correlated with soil
15
moisture, related analyses did not support a clear cause-and-effect relationship with
moisture. The initial decrease in14CO2from spring to midsummer could be explained by increases in 14C-deplete root respiration; however, 14CO2 continued to decline in late summer after root activity decreased. We also investigated whether soil mois-ture impacted vertical partitioning of CO2production, but found this had little effect on
20
respired14CO2because CO2contained modern bomb-C at depth, even in the trenched plot. This surprising result contrasted with decades to centuries-old pre-bomb CO2 pro-duced in lab incubations of the same soils. Our results suggest that root-derived C and other recent C sources had dominant impacts on 14CO2 in situ, even at depth. We propose that14CO2 may have declined through late summer in intact plots because 25
of continued microbial turnover of root-derived C, following declines in root respiration. Our results agree with other studies showing large seasonal fluctuations in respired
∆14CO
BGD
10, 10721–10758, 2013
Soil14CO
2dynamics C. L. Phillips et al.
Title Page
Abstract Introduction
Conclusions References
Tables Figures
◭ ◮
◭ ◮
Back Close
Full Screen / Esc
Printer-friendly Version
Interactive Discussion
Discussion
P
a
per
|
D
iscussion
P
a
per
|
Discussion
P
a
per
|
Discuss
ion
P
a
per
|
1 Introduction
The presence of large14C gradients in soil makes radiocarbon a potentially sensitive tool for detecting changes in respiration sources. The dynamic range of 14C in puta-tive respiratory substrates is often many times larger than for13C: deep soils generally contain an abundance of organic matter that is deplete in14C due to radioactive decay 5
and decomposition, while near-surface soils reflect litter additions containing “bomb-C,” a legacy of aboveground thermonuclear weapons testing in the early 1960s (Gaudinski et al., 2000; Trumbore, 2000) Root and microbial respiration also often have different
14
C abundance, with root-derived CO2more closely resembling the recent atmosphere. This distinction has been employed to partition total soil respiration into heterotrophic 10
(Rh) and autotrophic (Ra) components (Czimczik et al., 2006; Hahn et al., 2006; Hicks Pries et al., 2013; Schuur and Trumbore, 2006). While the distinctions between deep and shallow, and betweenRhandRaend-members are useful for partitioning, the large 14
C range in potential CO2sources may also accentuate seasonal and synoptic vari-ability in soil14CO2. Although
14
CO2measurements have proven useful for identifying
15
changes in respiratory sources following disturbance and climatic change (Czimczik et al., 2006; Hicks Pries et al., 2013; Hirsch et al., 2003; Schuur and Trumbore, 2006), our understanding of these effects could be improved with more information on14CO2
seasonal trends.
Several temporal studies have suggested that seasonal variation in soil-respired 20
14
CO2 may be large, and may therefore encode information about seasonal dynam-ics of respiratory sources. Gaudinski et al. (2000) found soil-respired14CO2decreased by approximately 40 % between May and December at Harvard Forest, a temperate
deciduous system. Similarly, ecosystem-respired14CO2 at a tundra site in Alaska de-creased over the summer by as much as 20 %(Hicks Pries et al., 2013). Schuur and
25
Trumbore (2006), however, found a large increase of 84 %between June and August
re-BGD
10, 10721–10758, 2013
Soil14CO
2dynamics C. L. Phillips et al.
Title Page
Abstract Introduction
Conclusions References
Tables Figures
◭ ◮
◭ ◮
Back Close
Full Screen / Esc
Printer-friendly Version
Interactive Discussion
Discussion
P
a
per
|
D
iscussion
P
a
per
|
Discussion
P
a
per
|
Discuss
ion
P
a
per
|
peated sampling is generally very sparse, providing little information from which to fully describe seasonal variability or identify environmental drivers.
To help address this gap, in 2011–2012 we conducted a study of respired 14CO2 dynamics at Willow Creek eddy covariance site, a temperate semi-deciduous forest in Northern Wisconsin, USA. Our goal was to examine soil14CO2 dynamics through
5
the growing season, and evaluate whether soil emissions also influenced atmospheric 14
CO2 dynamics. In this paper, we present our soil 14CO2 observations and evaluate potential physical and biological processes underlying seasonal variation. Specifically, we evaluated impacts on soil14CO2from the following processes:
1. Seasonal shifts in relative contributions ofRhandRa.
10
2. Seasonal changes in relative contributions of deep and shallow CO2production.
3. Seasonal changes in∆14C ofRh, reflecting shifts in microbial substrates.
Although not an exhaustive list, by focusing on these processes we hoped to tease apart the relative influences of plant activity, microbial activity, and soil physical proper-ties on respired14CO2variability.
15
Investigating influences from these sources may help illuminate the utility and limi-tations of14CO2for understanding soil metabolism. To our knowledge there has been no previous investigation of whether ∆14C of R
h varies seasonally, and Rh has been assumed to be isotopically static at seasonal to interannual timescales for partitioning heterotrophic and autotrophic respiration (Hicks Pries et al., 2013; Schuur and Trum-20
bore, 2006) and for modeling rates of soil organic matter turnover (Torn et al., 2002). If heterotrophic∆14C varies seasonally, this would indicate that the quality of soil C
desta-bilized through time has greater environmental sensitivity than is presently represented by most soil biogeochemistry models. The effects of soil moisture and gas diffusion on
respired14CO2 are also largely unexplored. Although soil moisture and gas diffusion
25
BGD
10, 10721–10758, 2013
Soil14CO
2dynamics C. L. Phillips et al.
Title Page
Abstract Introduction
Conclusions References
Tables Figures
◭ ◮
◭ ◮
Back Close
Full Screen / Esc
Printer-friendly Version
Interactive Discussion
Discussion
P
a
per
|
D
iscussion
P
a
per
|
Discussion
P
a
per
|
Discuss
ion
P
a
per
|
for why sources of soil respiration vary through time. A simultaneous assessment of the relative influences on14CO2 by soil physical factors in addition to plant and microbial activity provides a check on existing assumptions and tendencies.
2 Methods
To evaluate influences of plant and microbial activity and soil physical factors, we mea-5
sured surface CO2 flux rates and subsurface profiles of CO2, 14
CO2, and 13
CO2 in three intact soil plots and one plot that was trenched to exclude roots to 1 m depth. The trenched plot did not have spatial replication; therefore, a limitation of this study is that the treatments could not be statistically compared. Observations from the trenched plot, however, allowed us to examine in situ dynamics of microbially-respired 14CO2 10
through time, in the absence of live roots, which we compared with more common in vitro microbial respiration measurements from laboratory soil incubations. We used comparisons of the intact and trenched plots to estimate the relative contributions ofRh andRato total soil respiration. Subsurface profile measurements were used to estimate CO2and
14
C contributions from each soil horizon. 15
In addition, we employed a one-dimensional (1-D) soil CO2diffusive transport model
to simulate how variations in the rate and isotopic composition of CO2production would be expected to impact14CO2of soil air and surface flux. We used simulations as a sec-ond, independent approach for estimating∆14C of microbial production from
observa-tions of soil air. 20
2.1 Site and soil description
BGD
10, 10721–10758, 2013
Soil14CO
2dynamics C. L. Phillips et al.
Title Page
Abstract Introduction
Conclusions References
Tables Figures
◭ ◮
◭ ◮
Back Close
Full Screen / Esc
Printer-friendly Version
Interactive Discussion
Discussion
P
a
per
|
D
iscussion
P
a
per
|
Discussion
P
a
per
|
Discuss
ion
P
a
per
|
covariance measurements have been made at the site since 1998, and plant and soil characteristics have been described in detail by others (Bolstad et al., 2004; Cook et al., 2004; Martin and Bolstad 2005).
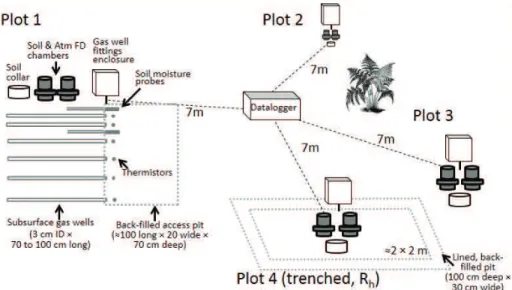
In June 2011 we established a group of four soil plots centered about 30 m from the base of the eddy covariance tower (Fig. 1). In each plot we excavated a trench 5
to 75 cm depth to characterize the profile and install instrumentation, removing soil in 10 cm increments to back-fill in the same order. Soils were deep and moderately permeable, formed from unsorted, coarse glacial till, and have evidence of mixing from wind-throw, freeze-thaw, and earthworm activity. Texture in the four plots was classified as either sandy loams or loamy sands (mean texture in top 20 cm: 63 % sand, 31 % silt, 10
6 % clay, 5–12 % rock fragments). Soils lacked an O horizon, had an A horizon 8–12 cm in depth with a clear wavy boundary, followed by at least one B horizon, with variation among plots in iron depletions and accumulations, and finally a BC horizon starting at 50–60 cm with increased amounts of gravelly sand and gravel. We later found gas wells at and below 50 cm to be poorly drained until mid-summer.
15
We installed gas wells at 6 depths, at the interfaces between genetic horizons and several intermediate depths (nominal depths were 8, 15, 22, 30, 50, and 70 cm, with
≤3 cm variation across plots). We used a 2.5 cm diameter drill auger to create
hori-zontal holes in the profile wall extending in 70–100 cm as permitted by stone content, and pounded gas wells into the holes. The wells were constructed of PVC pipe (70 20
to 100 cm long×3 cm ID, inner volume 0.5 to 0.7 L), which were perforated along the
bottom with a row of 1 cm diameter holes to exchange air with the surrounding soil, and wrapped in Tyvek®polyethylene membrane to exclude water and soil macrofauna. Wells were staggered horizontally within a 15 cm range to reduce impacts on vertical CO2diffusion. Gas wells were capped at both ends, connected to the soil surface with
25
BGD
10, 10721–10758, 2013
Soil14CO
2dynamics C. L. Phillips et al.
Title Page
Abstract Introduction
Conclusions References
Tables Figures
◭ ◮
◭ ◮
Back Close
Full Screen / Esc
Printer-friendly Version
Interactive Discussion
Discussion
P
a
per
|
D
iscussion
P
a
per
|
Discussion
P
a
per
|
Discuss
ion
P
a
per
|
and 18 cm (CS-616, Campbell Scientific). Two sets of soil cores (5 cm diameter×5 cm
long) centered at 2.5, 7.5, 12.5, 18, 30, 40, and 60 cm were also removed from each ex-posed profile for isotopic analysis (see below), and for analysis of texture, porosity, and moisture release at the Oregon State University Soil Science Physical Characterization Lab.
5
To create the trenched plot, we dug a trench 30 cm wide×100 cm deep around all sides of a 2 m×2 m plot, and lined the trench with 5 mil polyethylene vapor barrier
to prevent in-growth of new roots before refilling the trench with soil. Trenching was completed in early September 2011. The plot did not contain any woody plants, and emerging herbaceous plants (mostly grass) were clipped to their root crowns through-10
out 2012.
2.2 Soil CO2flux and profile air
Soil surface CO2flux was measured using Forced Diffusion (FD) chambers and Vaisala GMP343 CO2 sensors (Vaisala Corp, Helsinki, Finland), as described by Risk et al. (2011). Each soil plot contained a FD soil chamber and atmospheric reference, and 15
a co-located PVC soil collar for comparisons with the Licor-8100 soil flux system (Licor Environmental, Lincoln, NE, USA). FD CO2flux, temperature, and moisture were recorded hourly, and Licor CO2 flux comparisons were made approximately every 3 weeks during the growing season.
Soil profile CO2 was measured with the Licor-8100 IRGA, by first circulating air
20
through a soda-lime trap to remove CO2 from the Licor internal volume and tubing, and then switching valves to shut-off the CO2 trap and circulate soil air between the
gas well and Licor. Soil air was circulated in a closed-loop for several minutes until con-centrations stabilized. A 1 µm air filter and a 50 mL canister of drierite plumbed to the Licor inlet trapped particles and moisture from incoming soil air. The gas well tubing 25
BGD
10, 10721–10758, 2013
Soil14CO
2dynamics C. L. Phillips et al.
Title Page
Abstract Introduction
Conclusions References
Tables Figures
◭ ◮
◭ ◮
Back Close
Full Screen / Esc
Printer-friendly Version
Interactive Discussion
Discussion
P
a
per
|
D
iscussion
P
a
per
|
Discussion
P
a
per
|
Discuss
ion
P
a
per
|
After measuring CO2, we sampled soil air for isotopic analysis using pre-evacuated 400 mL stainless steel canisters (Restek Corp #24188, PA, USA) or activated molecu-lar sieve traps (Gaudinski et al., 2000). To prepare canisters, we pre-cleaned them with N2 and heat following the manufacturer’s instructions, evacuated them to ≤1 mTorr,
and capped the valves with rubber septa prior to overnight shipping to the fieldsite. In 5
the field, we connected a syringe needle to the gas well tubing and filled the canis-ters by piercing the septa. To sample with molecular sieve traps, we used the Licor to pull soil air through the trap in a flow-through configuration. During trapping, we main-tained a flow rate of 60 mL min−1, and timed trapping to collect 2 mg C (total trapping time ranged 30 s to 15 min, depending on concentration). The molecular sieve (13X 10
8/12 beads, Grace) was washed, and then pre-conditioned by baking at 750◦C under vacuum for 12 h. Molecular sieve traps were activated using the same procedure for extraction, below.
Atmospheric samples from the eddy covariance tower were also sampled from just above the forest canopy at 21 m a.g.l. into glass flasks, using a programmable flask 15
package and compressor (Andrews et al., 2013) These whole-air samples were col-lected approximately every 6 days at 12:30 a.m. local time, so that they refcol-lected respi-ration not influenced by photosynthesis.
2.3 Root and soil incubations
We collected roots from 0–5 cm in three locations in August 2011 to determine the 20
∆14C of Ra. In the field, roots were rinsed in distilled water and placed in sterilized
Mason jars. Atmospheric CO2was removed from the jar headspace by recirculating air through a soda lime trap and IRGA. The jars were shipped overnight to the Center for Accelerator Mass Spectrometry (CAMS) at Lawrence Livermore National Laboratory, and CO2was extracted within 48 h, as described below.
25
BGD
10, 10721–10758, 2013
Soil14CO
2dynamics C. L. Phillips et al.
Title Page
Abstract Introduction
Conclusions References
Tables Figures
◭ ◮
◭ ◮
Back Close
Full Screen / Esc
Printer-friendly Version
Interactive Discussion
Discussion
P
a
per
|
D
iscussion
P
a
per
|
Discussion
P
a
per
|
Discuss
ion
P
a
per
|
allowed the remainder to senesce by resting the soils for two weeks before sealing the incubation jars. The closed jars were purged with CO2-free air, and incubated at 25
◦
C until at least 0.5 mg C-CO2 could be extracted from the headspace. Incubation time ranged from 4 to 126 days, depending on the activity of each sample.
2.4 14C sample processing
5
CO2 from canisters, flasks, and incubation jars was purified cryogenically at CAMS using a vacuum line, and CO2 trapped on molecular sieves was released by baking at 650◦C under vacuum for 30 min while condensing CO2 cryogenically. Purified CO2 was reduced to graphite on iron powder in the presence of H2 (Vogel et al., 1984). Subsamples of CO2were analyzed forδ
13
C at the UC Davis Stable Isotope Laboratory 10
(GVI Optima Stable Isotope Ratio Mass Spectrometer), and were used to correct14C values for mass-dependent fractionation.
Radiocarbon abundance in graphitized samples was measured on the Van de Graff
FN Accelerator Mass Spectrometer (AMS) at CAMS, is reported in∆14C notation with
a correction for14C decay since 1950 (Stuiver and Polach, 1977). In∆14C notation,
val-15
ues>0 %indicate the presence of “bomb” C that was fixed after 1950, whereas values ≤0 %indicate C that was fixed prior to 1950. AMS samples had an average precision
of 2.5 %. Total uncertainty associated with AMS plus sampling and CO
2extraction was estimated to be 8.7 %for molecular sieve traps, and 3.2 %for air canisters, based on
the standard deviation of contemporary atmosphere process standards (N=5 for each
20
sample type).
2.5 Data analysis
The analysis of field data had three components: (1) Calculating14CO2of surface flux from profile measurements, (2) estimating CO2 and
14
C production by soil horizon, and (3) partitioning total soil respiration intoRhandRa. Each component is discussed
25
BGD
10, 10721–10758, 2013
Soil14CO
2dynamics C. L. Phillips et al.
Title Page Abstract Introduction Conclusions References Tables Figures ◭ ◮ ◭ ◮ Back Close
Full Screen / Esc
Printer-friendly Version Interactive Discussion Discussion P a per | D iscussion P a per | Discussion P a per | Discuss ion P a per |
2.5.1 Surface flux14CO2
Due to recent reports of isotopic disequilibria caused by surface chambers (Albanito et al., 2012; Midwood and Millard, 2011; Nickerson and Risk, 2009a), for this study we focused on profile measurements, which may be less prone to sampling artifacts. We estimated∆14C of surface flux from profile measurements using a gradient approach.
5
The gradient approach is often used to calculate surface CO2 flux from subsurface concentrations by applying Fick’s first law of diffusion:
F =D(z)dC
dz (1)
whereF is the CO2flux density (µmol m
−2
s−1),D(z) is the soil CO2diffusivity (m 2
s−1) at depthz(m), andCis the CO2concentration (µmol m
−3
). As described by Nickerson 10
et al. (2013), if we assume the isotopologues of CO2(12CO2,13CO2, and14CO2) diffuse
independently of one another, we can use Eq. (1) to model fluxes of each. The isotopic ratio of14C to12C in surface flux can thus be modeled as the quotient of Eq. (1) applied to14CO2and12CO2:
"14 C 12C # F =F 14
F12 =
D14(z)
D12(z) d14C
dz
dz
d12C (2)
15
whereF14 and F12 are the fluxes of 14CO2 and 12
CO2, respectively, and D 14
(z) and
D12(z) are the depth-specific diffusivities for each isotopologue. The quotient of diff
u-sion coefficients for a rare and common isotope is also the inverse of the fractionation
factor,α, which is 1.0044 for13CO2diffusion through soil (Cerling et al., 1991), and is estimated to be approximately 1.0088 for14CO2(Southon, 2011). Using this
relation-20
ship, we can simplify and discretize Eq. (2) to yield:
"14 C 12C # F = 1 α14
C14z 2 −C
14 z1
C12z 2 −C
12 z1
BGD
10, 10721–10758, 2013
Soil14CO
2dynamics C. L. Phillips et al.
Title Page
Abstract Introduction
Conclusions References
Tables Figures
◭ ◮
◭ ◮
Back Close
Full Screen / Esc
Printer-friendly Version
Interactive Discussion
Discussion
P
a
per
|
D
iscussion
P
a
per
|
Discussion
P
a
per
|
Discuss
ion
P
a
per
|
whereα14 is the fractionation factor for 14C, andz1 and z2 are arbitrary depths with increasing CO2concentration. Similarly, the
13
C/12C ratio in surface flux can be calcu-lated by replacing14C with13C values. Note that Eq. (3) indicates the isotopic ratio of surface flux can be calculated without knowing the diffusivity of CO2 in soil, which is
difficult to measure well and uncertain to model (Pingintha et al., 2010).
5
To convert between ∆ values (for reporting purposes) and absolute 14C/12C ratios
(for flux calculations) we used the following equations:
∆ =(FM·e19508267−Yr−1)×1000 (4)
where ∆ notation (%) is calculated by standardizing fraction modern (FM) to the
year 1950 to allow inter-comparison of samples from different analysis years (Yr), and
10
8267 yr is the14C mean decay rate. FM was related to the sample14C/12C ratio follow-ing the derivation in Southon et al. (2011), where it is shown that14C activity≈14C/12C.
FM=
14 C 12C
S
0.95·
h14C 12C i
OX1
1−100025 2
1+δ13C
1000
2 (5)
In the equation above [14C/12C]Sis the sample 14
C ratio,δ13C is the sample13C abun-dance in %notation, which is used to normalize the14C ratio for mass-based
fraction-15
ation toδ13C=−25 %, and 0.95·[14C/12C]OX1is the normalized 14
C ratio of the oxalic acid I standard.
We calculated the13C and 14C composition of surface fluxes at Willow Creek using Eq. (3) with data from the soil surface (z1=0 cm) and the shallowest gas wells (z2=7 or 8 cm). On two sampling dates, however, there were missing observations in plot 4 20
BGD
10, 10721–10758, 2013
Soil14CO
2dynamics C. L. Phillips et al.
Title Page
Abstract Introduction
Conclusions References
Tables Figures
◭ ◮
◭ ◮
Back Close
Full Screen / Esc
Printer-friendly Version
Interactive Discussion
Discussion
P
a
per
|
D
iscussion
P
a
per
|
Discussion
P
a
per
|
Discuss
ion
P
a
per
|
we assumedδ13C=−9.5±1 %and∆14C=30±5 %, based on available data. To
es-timate uncertainty for surface flux isotopic ratios, we applied Monte Carlo simulations (1000 iterations) to propagate the uncertainty associated with each measurement in Eq. (3).
2.5.2 CO2and14CO2production by soil horizon
5
To vertically partition the production of CO2, we again applied Fick’s Law (Eq. 1) to determine fluxes from subsurface soil layers. After experimenting and finding no func-tional types that satisfactorily fit the CO2 profiles through time, we chose to calculate dC/dzacross soil layers by discrete difference. We used the following discretized form
of Fick’s Law: 10
F(z1)=D¯(z1,z2)
&
Cz 2−Cz1
z2−z1
'
(6)
whereF(z1) is the flux at the top of a soil layer, ¯D(z1,z2) is the average diffusivity within the layer (following Turcu et al., 2005), and Cz1 and Cz2 are CO2 concentrations in gas wells at the top and bottom of the soil layer. We modeled soil diffusivity following
Moldrup et al. (2004) based on soil water content, porosity, and moisture release char-15
acteristics. Because the four soil plots had similar vertical profiles for physical variables, we compiled porosity and moisture release data from all plots and applied a loess fit to interpolate between measured depths. Diffusivity was modeled with soil moisture data
specific to each plot, and moisture between measured depths was estimated by lin-ear interpolation. Diffusivity was corrected using soil temperature measurements from
20
each plot, as in Pingintha et al. (2010). Good agreement between surface flux rates calculated with Eq. (7) and direct measurements with the Licor 8100 supported the accuracy of this approach (Slope=0.95,R2=0.89,N=46).
BGD
10, 10721–10758, 2013
Soil14CO
2dynamics C. L. Phillips et al.
Title Page
Abstract Introduction
Conclusions References
Tables Figures
◭ ◮
◭ ◮
Back Close
Full Screen / Esc
Printer-friendly Version
Interactive Discussion
Discussion
P
a
per
|
D
iscussion
P
a
per
|
Discussion
P
a
per
|
Discuss
ion
P
a
per
|
Gaudinski et al., 2000), as follows:
P(z1,z2)=F(z1)−F(z2) (7)
whereP(z1,z2) is the production in the soil layer between depthsz1andz2. The∆ 14
C of production in each layer was calculated as in Gaudinski et al. (2000)
∆P(z1,z2)=(F(z2)
+P(z1,z2))·∆F(z1)−F(z2)·∆F(z2)
P(z1,z2)
(8) 5
where∆ indicates∆14C of production and flux in %units. Uncertainty of production
rates and isotopic composition were estimated with Monte Carlo simulations, randomly sampling errors to add to each component measurement within its range of analytical uncertainty, for 1000 iterations.
2.5.3 Contributions ofRhandRa
10
Although trenched plots have several known limitations for estimating heterotrophic soil activity (e.g. increased soil moisture, root senescence, and potential changes in micro-bial composition), we used comparisons of the trenched and intact plots to partition total soil respiration by two methods: bulk surface fluxes, and isotopic mixing. We com-pared both these approaches, first computingRh/Rtot as the quotient of surface CO2
15
flux from the trenched plot and the average of the intact plots, and second by applying a two-end-member isotopic mixing equation:
Rh
Rtot
= ∆
Rtot−∆Ra
∆R
h−∆Ra
(9)
where∆
Rh and ∆Rtot are the ∆ 14
C of surface flux from trenched plot and intact plots, respectively, and∆
Rawas estimated from root incubations. Uncertainty associated with
20
BGD
10, 10721–10758, 2013
Soil14CO
2dynamics C. L. Phillips et al.
Title Page
Abstract Introduction
Conclusions References
Tables Figures
◭ ◮
◭ ◮
Back Close
Full Screen / Esc
Printer-friendly Version
Interactive Discussion
Discussion
P
a
per
|
D
iscussion
P
a
per
|
Discussion
P
a
per
|
Discuss
ion
P
a
per
|
2.6 Diffusional model simulations
We adopted the model described in Nickerson and Risk (2009b) to simulate diffusion
of 14CO2 and other isotopologues. Our modeled soil profile was 1 m deep with 100 layers, and at each time step gas transport between neighboring layers was calcu-lated with a 1-D discrete version of Fick’s law, using isotopologue-specific diffusivities.
5
Diffusivity of 12CO2 was calculated from soil physical variables following Moldrup et
al. (2004), and the diffusivity of13CO
2 and 14
CO2 were calculated by multiplying the Moldrup diffusivity by fractionation factors of 1.0044 and 1.0088, respectively. For all
simulations we initialized the CO2concentration profile with an analytical steady-state solution (Nickerson and Risk 2009b). We iterated the model with a 1 s time step until 10
the concentration and isotopic composition of soil profiles were stable for at least 3 model days. The default soil physical and biological variables reflect values observed at Willow Creek, and are shown in Table 1.
3 Results
3.1 General patterns
15
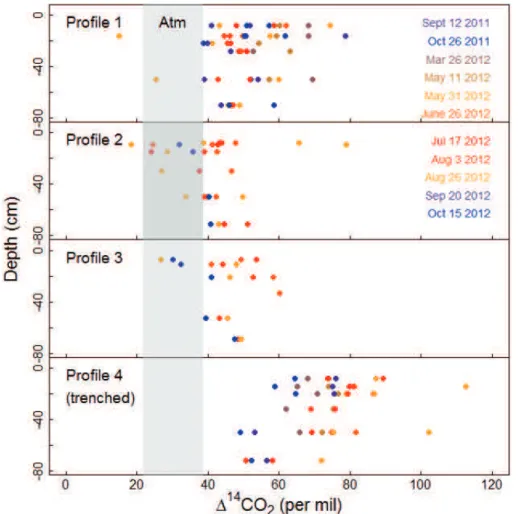
The∆14CO2of soil air in intact profiles was intermediate between the atmosphere and
the trenched plot profile (Fig. 2), with∆14CO2in intact profiles averaging 48 %(S.D.=
9 %,N=85), trenched plot observations averaging 73 %(S.D.=13 %,N=41), and
atmospheric samples from the tower averaging 29 % (S.D.=4 %, N=41, see also
Fig. 3). The total range in soil14CO2 over the sampling period was about two to three
20
times greater than in air samples from the tower, indicating atmospheric variation was not the primary factor driving soil14CO2variability.
The computed ∆14CO2 of surface fluxes (Fig. 3) indicated microbial soil respiration
was more enriched in14C than total respiration by a seasonal average of 34 %(95 %
CI=23−44 %). This is approximately equivalent to a mean age six to eight years
BGD
10, 10721–10758, 2013
Soil14CO
2dynamics C. L. Phillips et al.
Title Page
Abstract Introduction
Conclusions References
Tables Figures
◭ ◮
◭ ◮
Back Close
Full Screen / Esc
Printer-friendly Version
Interactive Discussion
Discussion
P
a
per
|
D
iscussion
P
a
per
|
Discussion
P
a
per
|
Discuss
ion
P
a
per
|
older, based on the recent rate of decline of atmospheric bomb-14C of 4 to 5.5 %yr−1
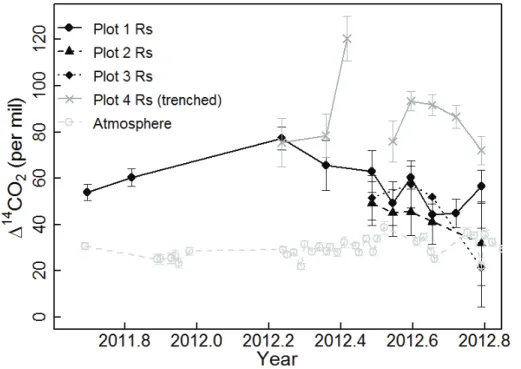
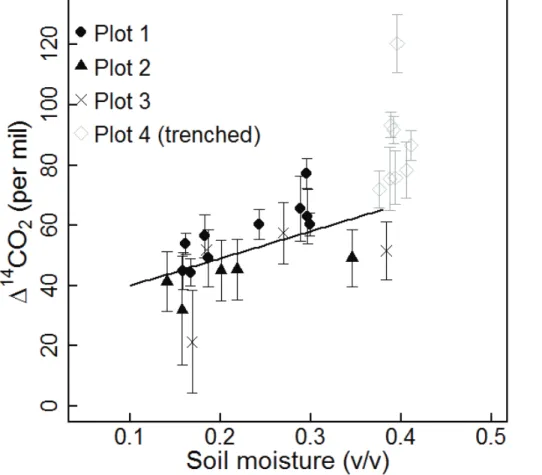
(Graven et al., 2012). In intact plots, respired∆14C decreased over the course of the
2012 growing season, from a high value in March of 77 % (only Plot 1 sampled) to
a low in October of 37 % (Plots 1–3, averaged). This 40 % seasonal decrease was
also significantly correlated with soil moisture (Fig. 4). In the following sections, we will 5
investigate possible explanations for the seasonal decline in respired14C from intact plots and the correlation with soil moisture.
In contrast to the intact plots, microbially-respired ∆14C from the trenched plot
re-mained comparatively elevated through the growing season. Other impacts of trench-ing included a substantial decrease in surface CO2 flux, by an average of 39 % over
10
the course of the 2012 growing season (Fig. 5a), and elevated summer soil moisture compared to the intact plots (Fig. 5c). The decrease in CO2flux rate and the lack of soil drying, which was likely due to cessation of plant transpiration, both provided strong in-dications that trenching was successful at excising live roots. We observed no impacts of trenching on soil temperature (Fig. 5b).
15
While microbially-respired fluxes from the trenched plot did not have identifiable sea-sonal trends, they had similar total variation as fluxes from the intact plots. For most days surface fluxes from the trenched plot fell within a 20 % range, but one
obser-vation exceeded the minimum by almost 50 %. There was no obvious environmental
explanation for this high 14C value, but it also does not appear to be an analytical or 20
sampling error because14CO2exceeding 100 %was found in both shallow and deep
gas wells from this profile (Fig. 2, bottom panel).
3.2 Explanation 1: changingRh andRacontributions
To account for seasonal declines in respired14CO2from the intact plots, we first exam-ined changes in relative contributions from heterotrophic and autotrophic CO2sources. 25
We expected that increasing contributions from14C-deplete root respiration could lead to decreases in total soil respired14CO2. Root-respired
14
incuba-BGD
10, 10721–10758, 2013
Soil14CO
2dynamics C. L. Phillips et al.
Title Page
Abstract Introduction
Conclusions References
Tables Figures
◭ ◮
◭ ◮
Back Close
Full Screen / Esc
Printer-friendly Version
Interactive Discussion
Discussion
P
a
per
|
D
iscussion
P
a
per
|
Discussion
P
a
per
|
Discuss
ion
P
a
per
|
tions of roots from 0–5 cm depth was 39 %(S.D.=4 %,N=4). Consistent with
expec-tation, root-respired CO2had less 14
C than microbially-respired CO2, with a seasonally-averaged difference of 46 % (95 % CI=33–60 %). In terms of C age, CO2 respired
from the trenched plot was 8 to 12 yr older than root respiration.
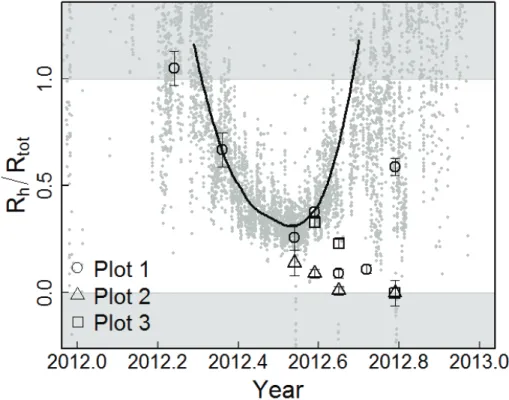
We estimated contributions from heterotrophic and autotrophic sources by two meth-5
ods. Our first approach was to compare the quotient of surface CO2 fluxes from the intact and trenched plots. This approach produced a U-shaped seasonal pattern for
Rh/Rtot (Fig. 6). Heterotrophic contributions descended from 100 % in March to a min-imum of about 30 % in mid-summer, and returned to 100 % by mid-October. Note that the quotient of surface fluxes often exceeded 1 outside the growing season because 10
rates in the trenched and intact plots were similar to each other and near zero.
Estimates ofRh/Rtot using the second approach, an isotopic mixing equation, pro-vided similar estimates as surface fluxes from March through July, but then diverged and remained close to zero through the remainder of the growing season. Two∆14C
measurements from the intact plots were actually more deplete in 14C than the au-15
totrophic end-member, providing negative estimates ofRhcontributions, and these are shown on the zero line in Fig. 6. Essentially, the two partitioning approaches diverged because flux rates in the intact plots returned to levels similar to the trenched plot by the end of the growing season, but ∆14C did not. Both partitioning approaches
pointed towards decreasing heterotrophic contributions in the first half of the summer 20
as a possible explanation for the decrease in respired14CO2from intact plots, but other mechanisms are needed to explain the continued∆14C decrease in late summer.
3.3 Explanation 2: changing vertical CO2contributions
We next investigated whether the seasonal decline in respired14CO2from intact plots was related to changes in the vertical distribution of CO2 production in the soil
pro-25
be-BGD
10, 10721–10758, 2013
Soil14CO
2dynamics C. L. Phillips et al.
Title Page
Abstract Introduction
Conclusions References
Tables Figures
◭ ◮
◭ ◮
Back Close
Full Screen / Esc
Printer-friendly Version
Interactive Discussion
Discussion
P
a
per
|
D
iscussion
P
a
per
|
Discussion
P
a
per
|
Discuss
ion
P
a
per
|
come destabilized and respired. We found, however, only weak evidence that variation in the vertical distribution of CO2 production influenced the
14
C-signature of surface respiration.
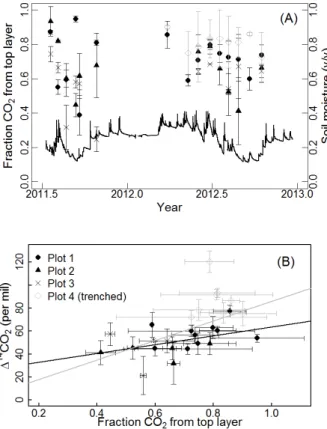
Vertical partitioning calculations indicated approximately 40 to 80 % of total produc-tion originated from the uppermost 8 cm (Fig. 7). The∆14C of surface flux tended to
5
increase with the fraction of CO2produced in the uppermost soil layer (slopep=0.002,
R2=0.3), but the relationship was only significant when all four plots were analyzed.
When the trenched plot was excluded, the slope of this relationship had ap-value of 0.07.
Vertical partitioning exhibited some seasonality (Fig. 7a), and we found a weak corre-10
lation between the fraction of CO2produced by the top layer and soil moisture, but only when all four plots were analyzed (slopep=0.01,R2=0.12). Furthermore, in contrast
to our expectation of deep CO2 containing less 14
C, we found the∆14C of soil air did
not show consistent patterns with depth (Fig. 2). Gradients were especially variable in the intact soil plots, sometimes increasing with depth and sometimes decreasing. To 15
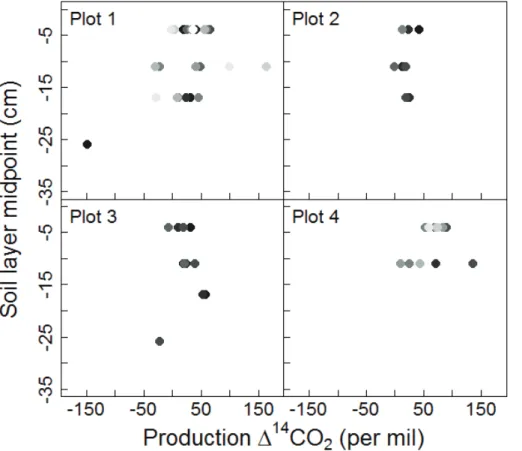
investigate vertical CO2 gradients in more detail, we also calculated the∆ 14
C of CO2 produced in each subsurface horizon (Fig. 8), in contrast to examining only the14CO2 gradients in soil air, which are attenuated by diffusion. Unfortunately, we found that ∆14C production estimates were prone to error in deep soil where bulk CO2production
rates were low, because the bulk production term occurs in the denominator of∆14C
20
calculations and tends to inflate isotopic errors in the numerator (Eq. 9). We therefore present only a subset of the calculated production ∆14C results, filtering out values
where production rate was≤0.2 µmol m−2s−1 for the soil layer. The remaining obser-vations, where were focused between 0–20 cm, indicated no vertical trends in∆14C of
production. 25
From the vertical partitioning analysis we did not find a compelling explanation for the correlation between respired14CO2and moisture. Although the vertical distribution of CO2production varied substantially through time, correlations with soil moisture and 14
BGD
10, 10721–10758, 2013
Soil14CO
2dynamics C. L. Phillips et al.
Title Page
Abstract Introduction
Conclusions References
Tables Figures
◭ ◮
◭ ◮
Back Close
Full Screen / Esc
Printer-friendly Version
Interactive Discussion
Discussion
P
a
per
|
D
iscussion
P
a
per
|
Discussion
P
a
per
|
Discuss
ion
P
a
per
|
3.4 Explanation 3: changes in∆14C of heterotrophic respiration
As stated in the general trends, surface fluxes from the trenched plot varied in∆14C
by as much as 50 % through the 2012 growing season, but remained comparatively
high and did not seem to explain the decrease in respired 14CO2 from intact plots. Observations from the trenched plot provided a unique opportunity to examineRh in
5
a more dynamic environment than traditional laboratory incubations. To place these trenched plot results in context, here we compare the trenched plot observations, which are essentially an in situ incubation, to more commonplace in vitro incubations in static laboratory conditions.
We found that for both laboratory incubations and trenched plot measurements, the 10
vertical distribution of soil CO2 production was similar (Fig. 9b). Both approaches had the highest production rates between 0–20 cm, and very little production in deeper soil. This similarity conferred some confidence that manipulating the soil either by trenching or by more disruptive coring did not alter the relative microbial activity of deep versus shallow soil. We found striking differences, however, between14CO2produced in
labo-15
ratory incubations and14CO2in the trenched plot (Fig. 9a). In laboratory incubations, respired 14CO2 had a similar vertical gradient as bulk solid soil. Below 15 cm, CO2 from incubations did not contain bomb-C (i.e. ∆14C<0 %) and reflected the old C
substrates present in deep soil. In contrast, CO2in the trenched plot was greater than 0 %at all depths, containing bomb-C throughout the profile. Although in situ soil air is
20
somewhat impacted by atmospheric CO2invasion, atmospheric effects were unlikely to have substantial impact, because soil CO2concentrations were five to 20 times greater than atmospheric CO2. Following the same incubation procedure used by many others (Cisneros-Dozal et al., 2006; Gaudinski et al., 2000; Schuur and Trumbore, 2006) we picked out the majority of roots from soil cores before incubating them, and this root 25
par-BGD
10, 10721–10758, 2013
Soil14CO
2dynamics C. L. Phillips et al.
Title Page
Abstract Introduction
Conclusions References
Tables Figures
◭ ◮
◭ ◮
Back Close
Full Screen / Esc
Printer-friendly Version
Interactive Discussion
Discussion
P
a
per
|
D
iscussion
P
a
per
|
Discussion
P
a
per
|
Discuss
ion
P
a
per
|
ticularly below 15 cm. The ∆14C of microbial respiration from the trenched plot was
influenced not only by the quantity and quality of soil organic matter pools, but perhaps more importantly by the availability of root C.
3.5 Dynamic simulations
Because incubation 14CO2 measurements are used in many studies to assess the
5
age of C that is actively utilized by microbes, and to characterize heterotrophic end-members for respiration source partitioning, we wanted to confirm the apparent dis-crepancy between field and laboratory microbial 14CO2 production. We used a dy-namic CO2 diffusion model as an alternate tool to constrain the ∆
14
C of production in the trenched plot. We prescribed a range of production∆14C profiles to assess if
10
microbial production of old14C-deplete CO2at depth could give rise to modern soil air CO2gradients (i.e.∆
14
C>0 %), like we observed in the trenched plot. For these
sim-ulations we assumed that the vertical distribution of bulk CO2production was the same as observed in the incubations, and we parameterized all other soil variables to match actual soil conditions as much as possible (Table 1). For the first simulation (Fig. 10a) 15
we started with 14CO2 production profiles that were observed in the laboratory incu-bations. With each subsequent simulation we included more14C at depth, progressing towards a vertically-constant isotopic profile with∆14C production=86 % (the ∆14C
produced by the−5 cm depth incubation). In other words, if microbial production in the trenched plot had the same 14C abundance as in lab incubations, we would expect 20
steady-state soil CO2 in the trenched plot to look similar to the black line in Fig. 10a. This set of simulations demonstrated two important points. First, it highlighted that the
∆14C soil air CO2profiles differ from∆14C CO2production profiles, due to diffusive
mix-ing and infiltration of atmospheric CO2. Second, it showed that the ∆14C produced in
lab incubations was much too old in deep soil to give rise to the CO2profiles observed
25
BGD
10, 10721–10758, 2013
Soil14CO
2dynamics C. L. Phillips et al.
Title Page
Abstract Introduction
Conclusions References
Tables Figures
◭ ◮
◭ ◮
Back Close
Full Screen / Esc
Printer-friendly Version
Interactive Discussion
Discussion
P
a
per
|
D
iscussion
P
a
per
|
Discussion
P
a
per
|
Discuss
ion
P
a
per
|
in the trenched plot (50–120 %), the∆14C of production would have to exceed 0 %
through the length of a 1 m profile (as in Fig. 10e or f).
4 Discussion
4.1 Influences on14CO2seasonal variation
We found a monotonic decrease in ∆14C of surface flux from intact plots through
5
the 2012 growing season, which was consistent with the seasonal decline found by Gaudinski et al. at Harvard Forest (2000), and the decline in ecosystem-respired14CO2 at an Alaska tundra site by Hicks Pries et al. (2013). We examined three possible explanations for this seasonal decline: shifts in autotrophic versus heterotrophic con-tributions, deep versus shallow concon-tributions, and variability in∆14C of heterotrophic
10
respiration. We found substantial seasonal variation in all of these potential explana-tory variables, but each had a weak or no relationship with respired14CO2. Although our trenched plot treatment was not spatially replicated, the ∆14C of respiration from
the trenched plot was consistently greater than intact plots following the first spring sampling event. Based on this shift in respired CO2towards older,
14
C-enriched bomb 15
C when roots were cut-off, as well as the shift in microbial respiration towards even
older pre-bomb C when roots were picked-out from incubated soils, we believe one of the more compelling explanations for the growing-season decline in respired14CO2 was an increasing dependence through the summer on newly-photosynthesized plant C by both roots and microbes.
20
The typical pattern for gross photosynthesis at Willow Creek based on several years of eddy covariance measurements has been a parabolic curve peaking in June– July (Cook et al., 2004; Desai et al., 2005). This pattern mirrored our estimates of
Rh/Rtotbased on surface flux rates, suggesting that heterotrophic relative contributions reached a minimum when plant growth peaked. When we used an isotopic-mixing ap-25
BGD
10, 10721–10758, 2013
Soil14CO
2dynamics C. L. Phillips et al.
Title Page
Abstract Introduction
Conclusions References
Tables Figures
◭ ◮
◭ ◮
Back Close
Full Screen / Esc
Printer-friendly Version
Interactive Discussion
Discussion
P
a
per
|
D
iscussion
P
a
per
|
Discussion
P
a
per
|
Discuss
ion
P
a
per
|
low until fall. A possible explanation of this discrepancy is that microorganisms in the in-tact plots switched during the growing season to substrates such as root exudates and new root litter that were more deplete in14C than the substrates initially available fol-lowing spring thaw. The CO2respired from intact plots in late summer may have been produced by microbes but carried the∆14C signature of new roots. If microbes in
in-5
tact plots switched to newly available substrates, then the trenched plot would have no longer provided a good measure of heterotrophic∆14C for mixing-model partitioning.
We initially found that∆14C of surface flux from intact plots correlated with soil
mois-ture; however, supporting analyses did not indicate a clear cause-and-effect
relation-ship. We had expected that moisture might alter14C by changing vertical partitioning 10
of soil respiration sources. We expected seasonal soil drying might cause shallow soils to become less active, due to water stress, and deep, seasonally-saturated soils to become more active, due to improved oxygenation. This expectation was not substan-tiated, however, by the vertical partitioning analysis. Although we calculated that the percentage of CO2produced in the top 8 cm varied seasonally between 40–80 %, we
15
did not find a significant correlation with moisture, unless we included observations from the trenched plot. Observations from the trenched plot tended to have high lever-age on regression analyses, because they grouped at the wet end of the soil moisture spectrum and at the high abundance end of the ∆14C spectrum. This points to the
general challenge of parsing-out environmental drivers in soil respiration analyses. Be-20
cause moisture in the trenched plot remained high through the summer, we could not assess the impacts of soil moisture in the absence of root inputs. Conversely, because root inputs co-varied with moisture in the intact plots, it was not entirely possible to assess which factor was responsible for the seasonal decline in respired∆14C.
4.2 In situ versus in vitro heterotrophic14CO2
25
BGD
10, 10721–10758, 2013
Soil14CO
2dynamics C. L. Phillips et al.
Title Page
Abstract Introduction
Conclusions References
Tables Figures
◭ ◮
◭ ◮
Back Close
Full Screen / Esc
Printer-friendly Version
Interactive Discussion
Discussion
P
a
per
|
D
iscussion
P
a
per
|
Discussion
P
a
per
|
Discuss
ion
P
a
per
|
(we did not find significant correlations between∆14C from the trenched plot and
tem-perature or moisture, for instance), we had indirect evidence that microbes responded readily to changes in substrate availability.
We showed that∆14CO2 from soil incubations decreased with depth, reflecting the ∆14C of bulk soil, whereas in situ CO2was modern through the soil profile. This
discrep-5
ancy suggests that microbes at depth in the field were not consuming soil carbon from depth, but rather modern substrates that may have come from decaying roots (which were mostly picked-out of the incubated soil cores), or from dissolved carbon trans-ported from the shallow subsurface. Other field studies have previously noted modern 14
CO2 in soil air at depth (Gaudinski et al., 2000; Hirsch et al., 2003); however,
previ-10
ous studies were unable to rule-out root respiration as a source of this CO2. Because our trenching treatment cut offlive roots, we were able to show that microbial activity
can also produce modern CO2 at depth in intact soil columns. Advective transport of substrates from the soil surface has been shown to create infillings of modern OM that serve as an important component of the “active” microbial C pool at depth in other 15
ecosystems (Marin-Spiotta et al., 2011). Future work at Willow Creek that examines
∆14C of dissolved organic carbon could help determine whether the source of modern
carbon at depth is root inputs or surface carbon that is translocated.
4.3 Utility and limitations of14CO2for understanding soil metabolism
The large seasonal range in soil-respired14CO2found in this study points to exciting
20
possibilities for using 14C as a sensitive indicator of changing soil metabolism. Even with this large range, however, we still found it challenging to interpret the underly-ing causes of respired14CO2 variation, and have several recommendations for others studying soil14CO2.
(1)Use caution in extrapolating laboratory incubations to field conditions. Using lab-25
under-BGD
10, 10721–10758, 2013
Soil14CO
2dynamics C. L. Phillips et al.
Title Page
Abstract Introduction
Conclusions References
Tables Figures
◭ ◮
◭ ◮
Back Close
Full Screen / Esc
Printer-friendly Version
Interactive Discussion
Discussion
P
a
per
|
D
iscussion
P
a
per
|
Discussion
P
a
per
|
Discuss
ion
P
a
per
|
standing soil organic matter dynamics, laboratory incubations are useful for identifying the turnover time of the “active” C pool, or the pool that is most readily destabilized by microbial activity. Within the context of understanding in situ microbial activity, however incubations have limited utility because it is important to consider to consider the more complete spectrum of microbial associations, including not only soil organic matter 5
associations but also close associations with intact roots (Kuzyakov, 2006). For deep soils in particular, in situ microbial respiration may be more impacted by root-derived C, and younger in terms of14C age, than is represented by soil incubations. Results from this study suggest an alternative way to partition soil respiration that does not rely on soil incubations. Since new C inputs over the course of the growing season de-10
creased respired14CO2, one could partition respiration into present-year and previous C sources by using early-spring respired14CO2as the end-member for already present C, the atmosphere or new roots as the end-member for new C inputs, and subsequent measurements of respired14CO2as a mixture of these sources.
(2) Dynamic models are a useful complement to static, steady-state models for
in-15
terpreting soil gas data. Analyses that go beyond directly-measured values of surface flux14CO2or soil air 14CO2 to calculating flux and production profiles can reveal use-ful insights about underlying sources of CO2that contribute to surface emissions. The steady-state Fickian models that are often used to calculate production profiles (e.g. Eqs. 7–9) are useful for this purpose but can have very large uncertainties, particularly 20
if steady-state assumptions are violated. Dynamic models, like the Nickerson and Risk model demonstrated here, provide a useful alternative to constrain production profiles, and are also useful for investigating14CO2responses to dynamic changes in soil envi-ronment.
(3) Measure soil respiration 14CO2 at the beginning, middle, and end of the
grow-25
ing season. For researchers primarily interested in an average annual ∆14C
BGD
10, 10721–10758, 2013
Soil14CO
2dynamics C. L. Phillips et al.
Title Page
Abstract Introduction
Conclusions References
Tables Figures
◭ ◮
◭ ◮
Back Close
Full Screen / Esc
Printer-friendly Version
Interactive Discussion
Discussion
P
a
per
|
D
iscussion
P
a
per
|
Discussion
P
a
per
|
Discuss
ion
P
a
per
|
and end of the growing season are ideal to capture the seasonal progression of new C additions.
5 Conclusions
By examining soil 14CO2 with high vertical and temporal resolution we showed that respired 14CO2 is influenced by recently-assimilated carbon; however, we could not
5
fully resolve the mechanisms underlying low levels of∆14C late in the growing
sea-son and the correlation between ∆14C and soil moisture. Our results indicated that
heterotrophic ∆14C is dynamic and sensitive to immediate substrate availability, and
that experimental manipulations to isolate heterotrophic and autotrophic activity can substantially impact estimates of heterotrophic∆14C. Studies that make use of14CO2
10
measurements for examining disturbance or climatic change impacts should be inter-preted with an understanding that respired14CO2 can fluctuate seasonally by 40 %, and that this variability may reflect not only changes in root contributions, but possibly root impacts on∆14C of heterotrophic respiration as well.
Acknowledgement. Field assistance was provided by J. Thom (UW) and D. Baumann (USGS),
15
and laboratory assistance was provided by P. Zermeño and L. Larson (LLNL). This work was performed under the auspices of the US Department of Energy by Lawrence Livermore Na-tional Laboratory under Contract DE-AC52-07NA27344, with support from LLNL (LDRD 11-ERD-053) and the Wisconsin Focus on Energy Environmental and Economic Research and Development (EERD) Grant# 10–06. LLNL-JRNL-637140.
20
References
BGD
10, 10721–10758, 2013
Soil14CO
2dynamics C. L. Phillips et al.
Title Page
Abstract Introduction
Conclusions References
Tables Figures
◭ ◮
◭ ◮
Back Close
Full Screen / Esc
Printer-friendly Version
Interactive Discussion
Discussion
P
a
per
|
D
iscussion
P
a
per
|
Discussion
P
a
per
|
Discuss
ion
P
a
per
|
Andrews, A. E., Kofler, J. D., Trudeau, M. E., Williams, J. C., Neff, D. H., Masarie, K. A.,
Chao, D. Y., Kitzis, D. R., Novelli, P. C., Zhao, C. L., Dlugokencky, E. J., Lang, P. M., Crotwell, M. J., Fischer, M. L., Parker, M. J., Lee, J. T., Baumann, D. D., Desai, A. R., Stanier, C. O., de Wekker, S. F. J., Wolfe, D. E., Munger, J. W., and Tans, P. P.: CO2, CO and CH4measurements from the NOAA Earth System Research Laboratory’s Tall Tower
Green-5
house Gas Observing Network: instrumentation, uncertainty analysis and recommendations for future high-accuracy greenhouse gas monitoring efforts, Atmos. Meas. Tech. Discuss., 6,
1461–1553, doi:10.5194/amtd-6-1461-2013, 2013.
Cerling, T. E., Solomon, D. K., Quade, J., and Bowman, J. R.: On the isotopic composition of carbon in soil carbon dioxide, Geochim. Cosmochim. Ac., 55, 3403–3405,
doi:10.1016/0016-10
7037(91)90498-T, 1991.
Cisneros-Dozal, L. M., Trumbore, S. E., and Hanson, P. J.: Partitioning sources of soil-respired CO2and their seasonal variation using a unique radiocarbon tracer, Glob. Change Biol., 12, 194–204, doi:10.1111/j.1365-2486.2005.001061.x, 2006.
Czimczik, C. I., Trumbore, S. E., Carbone, M. S., and Winston, G. C.: Changing sources of
15
soil respiration with time since fire in a boreal forest, Glob. Change Biol., 12, 957–971, doi:10.1111/j.1365-2486.2006.01107.x, 2006.
Davidson, E. A., Savage, K. E., Trumbore, S. E., and Borken, W.: Vertical partitioning of CO2 production within a temperate forest soil, Glob. Change Biol., 12, 944–956, doi:10.1111/j.1365-2486.2005.01142.x, 2006.
20
Gaudinski, J. B., Trumbore, S. E., Davidson, E. A., and Zheng, S.: Soil carbon cycling in a tem-perate forest: radiocarbon-based estimates of residence times, sequestration rates and par-titioning of fluxes, Biogeochemistry, 51, 33–69, 2000.
Graven, H. D., Guilderson, T. P., and Keeling, R. F.: Observations of radiocarbon in CO2 at La Jolla, California, USA 1992–2007: analysis of the long-term trend, J. Geophys. Res.-Atmos.,
25
117, D02302, doi:10.1029/2011jd016533, 2012.
Hahn, V., Högberg, P., and Buchmann, N.: 14C – a tool for separation of autotrophic and heterotrophic soil respiration, Glob. Change Biol., 12, 972–982, doi:10.1111/j.1365-2486.2006.001143.x, 2006.
Hicks Pries, C. E., Schuur, E. A. G., and Crummer, K. G.: Thawing permafrost increases old
30
soil and autotrophic respiration in Tundra: partitioning ecosystem respiration usingδ13C and
BGD
10, 10721–10758, 2013
Soil14CO
2dynamics C. L. Phillips et al.
Title Page
Abstract Introduction
Conclusions References
Tables Figures
◭ ◮
◭ ◮
Back Close
Full Screen / Esc
Printer-friendly Version
Interactive Discussion
Discussion
P
a
per
|
D
iscussion
P
a
per
|
Discussion
P
a
per
|
Discuss
ion
P
a
per
|
Hirsch, A. I., Trumbore, S. E., and Goulden, M. L.: Direct measurement of the deep soil respi-ration accompanying seasonal thawing of a boreal forest soil, J. Geophys. Res., 108, 8221, doi:10.1029/2001JD000921, 2003.
Kuzyakov, Y.: Sources of CO2 efflux from soil and review of partitioning methods, Soil Biol.
Biochem., 38, 425–448, doi:10.1016/j.soilbio.2005.08.020, 2006.
5
Midwood, A. J. and Millard, P.: Challenges in measuring theδ13C of the soil surface CO2efflux, Rapid Commun. Mass Sp., 25, 232–242, doi:10.1002/rcm.4857, 2011.
Moldrup, P., Olesen, T., Yoshikawa, S., Komatsu, T., and Rolston, D. E.: Three-porosity model for predicting the gas diffusion coefficient in undisturbed soil, Soil Sci. Soc. Am. J., 68, 750–
759, 2004.
10
Nickerson, N. and Risk, D.: A numerical evaluation of chamber methodologies used in measur-ing theδ13C of soil respiration, Rapid Commun. Mass Sp., 23, 2802–2810, 2009a.
Nickerson, N. and Risk, D.: Physical controls on the isotopic composition of soil-respired CO2, J. Geophys. Res., 114, G01013, doi:10.1029/2008JG000766, 2009b.
Nickerson, N., Egan, J., and Risk, D.: Iso-FD: a novel method for measuring the isotopic
signa-15
ture of surface flux, Soil Biol. Biochem., 62, 99–106, 2013.
Phillips, C. L., Kluber, L. A., Martin, J. P., Caldwell, B. A., and Bond, B. J.: Contributions of ectomycorrhizal fungal mats to forest soil respiration, Biogeosciences, 9, 2099–2110, doi:10.5194/bg-9-2099-2012, 2012.
Phillips, D. L. and Gregg, J. W.: Uncertainty of source partitioning using stable isotopes,
Oe-20
cologia, 127, 171–179, 2001.
Pingintha, N., Leclerc, M. Y., Beasley, J. P. J., Zhang, G., and Senthong, C.: Assement of the soil CO2gradient method for soil CO2efflux measurements: comparison of six models in the
calculation of the relative gas diffusion coefficient, Tellus B, 62, 47–58, 2010.
Risk, D., Nickerson, N., Creelman, C., McArthur, G., and Owens, J.: Forced Diffusion soil flux:
25
a new technique for continuous monitoring of soil gas efflux, Agric. For. Meteorol., 151, 1622–
1631, doi:10.1016/j.agrformet.2011.06.020, 2011.
Schuur, E. A. G. and Trumbore, S. E.: Partitioning sources of soil respiration in boreal spruce forest using radiocarbon, Glob. Change Biol., 12, 165–176, doi:10.1111/j.1365-2486.2005.01066.x, 2006.
30
BGD
10, 10721–10758, 2013
Soil14CO
2dynamics C. L. Phillips et al.
Title Page
Abstract Introduction
Conclusions References
Tables Figures
◭ ◮
◭ ◮
Back Close
Full Screen / Esc
Printer-friendly Version
Interactive Discussion
Discussion
P
a
per
|
D
iscussion
P
a
per
|
Discussion
P
a
per
|
Discuss
ion
P
a
per
|
Stuiver, M. and Polach, H. A.: Discussion: reporting of14C data, Radiocarbon, 19, 355–363, 1977.
Torn, M. S., Lapenis, A. G., Timofeev, A., Fischer, M. L., Babikov, B. V., and Harden, J. W.: Organic carbon and carbon isotopes in modern and 100 yr-old-soil archives of the Russian steppe, Glob. Change Biol., 8, 941–953, doi:10.1046/j.1365-2486.2002.00477.x, 2002.
5
Trumbore, S. E.: Age of soil organic matter and soil respiration: radiocarbon constraints on belowground C dynamics, Ecol. Appl., 10, 399–411, 2000.
Turcu, V. E., Jones, S. B., and Or, D.: Continuous soil carbon dioxide and oxygen measurements and estimation of gradient-based gaseous flux, Vadose Zone J., 4, 1161–1169, 2005. Vogel, J. S., Southon, J. R., Nelson, D. E., and Brown, T. A.: Performance of catalytically
con-10