Disparity Changes in 370 Ma Devonian Fossils: The
Signature of Ecological Dynamics?
Catherine Girard1*, Sabrina Renaud2
1Institut des Sciences de l’Evolution, Universite´ Montpellier 2, CNRS, Montpellier, France,2Laboratoire de Biome´trie et Biologie Evolutive, Universite´ Lyon 1, CNRS, Villeurbanne, France
Abstract
Early periods in Earth’s history have seen a progressive increase in complexity of the ecosystems, but also dramatic crises decimating the biosphere. Such patterns are usually considered as large-scale changes among supra-specific groups, including morphological novelties, radiation, and extinctions. Nevertheless, in the same time, each species evolved by the way of micro-evolutionary processes, extended over millions of years into the evolution of lineages. How these two evolutionary scales interacted is a challenging issue because this requires bridging a gap between scales of observation and processes. The present study aims at transferring a typical macro-evolutionary approach, namely disparity analysis, to the study of fine-scale evolutionary variations in order to decipher what processes actually drove the dynamics of diversity at a micro-evolutionary level. The Late Frasnian to Late Famennian period was selected because it is punctuated by two major macro-evolutionary crises, as well as a progressive diversification of marine ecosystem. Disparity was estimated through this period on conodonts, tooth-like fossil remains of small eel-like predators that were part of the nektonic fauna. The study was focused on the emblematic genus of the period,Palmatolepis. Strikingly, both crises affected an already impoverished Palmatolepisdisparity, increasing risks of random extinction. The major disparity signal rather emerged as a cycle of increase and decrease in disparity during the inter-crises period. The diversification shortly followed the first crisis and might correspond to an opportunistic occupation of empty ecological niche. The subsequent oriented shrinking in the morphospace occupation suggests that the ecological space available toPalmatolepisdecreased through time, due to a combination of factors: deteriorating climate, expansion of competitors and predators. Disparity changes ofPalmatolepis thus reflect changes in the structure of the ecological space itself, which was prone to evolve during this ancient period where modern ecosystems were progressively shaped.
Citation:Girard C, Renaud S (2012) Disparity Changes in 370 Ma Devonian Fossils: The Signature of Ecological Dynamics? PLoS ONE 7(4): e36230. doi:10.1371/ journal.pone.0036230
Editor:Brock Fenton, University of Western Ontario, Canada
ReceivedFebruary 7, 2012;AcceptedMarch 28, 2012;PublishedApril 27, 2012
Copyright:ß2012 Girard, Renaud. This is an open-access article distributed under the terms of the Creative Commons Attribution License, which permits unrestricted use, distribution, and reproduction in any medium, provided the original author and source are credited.
Funding:This study has been supported by the GDR 2474 CNRS ‘‘Morphologie et Evolution des Formes’’. The funders had no role in study design, data collection and analysis, decision to publish, or preparation of the manuscript.
Competing Interests:The authors have declared that no competing interests exist.
* E-mail: [email protected]
Introduction
The Paleozoic (-550 to -250 Myrs) is a challenging period for paleobiological studies because ecosystems were increasing in complexity through the appearance and radiation of different groups of organisms, progressively colonizing and even creating ecological niches (nekton in the marine realm, terrestrial habitat for plants and animals), up to building ecosystems close to those still existing today. These trends can be seen as emergent properties of supra-specific taxonomic units radiating, competing and going extinct [1,2,3,4,5]. These processes are commonly referred as ‘‘macro-evolution’’. Yet, each species also evolved by the way of micro-evolutionary processes, extended over long period of time. Assessing the relationship between the patterns and processes acting at different evolutionary scales remains however difficult, because their study relies on different scales of analysis. Macro-evolutionary studies require large scale analyses of many taxa often pooled into high taxonomic units. In contrast, the analysis of fine-scale evolution within species, that could be referred as extended micro-evolution, requires focusing on a given taxon at a more restricted geographical and temporal scale. The present study aims at questioning this relation between different
scales of processes by developing a fine-scale evolutionary approach in a context known for outstanding macro-evolutionary events. The Late Devonian is marked by two major biotic crises. The first one punctuated the Frasnian/Famennian (F/F) bound-ary. It had a particular dramatic impact on the biosphere, being considered as one of the ‘‘Big Five’’ mass extinctions in Earth’s history [6]. The second one coincided with the Devonian/ Carboniferous (D/C) boundary. It strongly impacted the bio-sphere as well, although less than the F/F crisis [7]. Because of these two outstanding events, most studies devoted to the Late Devonian focused on either the F/F or D/C boundary, questioning the processes triggering the mass extinctions and the patterns of post-crisis recovery [7,8]. Independently of the crises, however, the Late Paleozoic was also characterized by long-term environmental trends [9,10] and by an increase in complexity of ecosystems in the terrestrial [11] but also in the marine realm where the water column was progressively occupied by nektonic organisms [12].
In such macro-evolutionary studies, the dynamics of a species is often summarized by the range of its temporal occurrence, or even summed up with other relatives into large taxonomic groups. This hinders to address how micro-evolutionary processes interplayed
with macro-evolutionary trends. The present study aims at filling this gap by performing a fine-scale evolutionary analysis along the Late Devonian, a period ofca.15 myrs between the two successive F/F and D/C crises. We focused on conodont animals, small eel-like predators [13] that were part of the nektonic fauna increasing in richness through the Paleozoic period. Their fossil remains are tooth-like elements. In many modern organisms, shape variations in such traits involved in the feeding performance have been shown to trace variations in resource exploitation [14,15,16]. This ecomorphological approach was applied to the shape variation observed within the conodont genus Palmatolepis, the most abundant conodont of the Late Devonian, disappearing during the D/C crisis. Using geometric morphometrics to quantify the shape of the tooth-like elements, the pattern of diversification of
Palmatolepis was assessed through time. Questions addressed
included (1) did the F/F crisis impoverish the morphological diversity within Palmatolepis, as expected based on macro-evolutionary patterns marking this mass extinction? (2) Was the screening of the crises random or not regarding ecomorphs within Palmatolepis? (3) DidPalmatolepisdiversified subsequently to the F/F crisis in a random or selective way? (4) What is the timing of this diversification subsequent to a crisis? Was it mostly conditioned by the catastrophic mass extinction events, with a pattern of post-crisis diversification followed by a stable disparity, until facing the next mass extinction event? Alternatively, was the diversification dynamics mostly driven by long term climatic and/or ecological trends developing between the two crises?
Materials and Methods
Material
Stratigraphic background. A composite record has been established based on samples from four sections, two located in the Montagne Noire in Southern France (Coumiac and Puech de la Suque) and two located in the Rhenish Massif in Germany (Schaumburg and Effenberg) (Fig. 1A–B). All the levels which delivered conodont elements were of limestone composition [17]. The local differences in geological setting have been shown to have little influence on the morphometric characteristics of the conodont assemblage [18].
According to paleogeographic reconstructions [19], all studied locations were situated in tropical to subtropical paleolatitudes between 10 and 30u southern latitude (Fig. 1B). The Montagne Noire and the Rhenish Massif were separated by the Protothetys but the distance between these two areas was approximately the same as today.
The Frasnian has only been recognized in Coumiac (France) where the last two zones (rhenanaandlinguiformis) of this period are represented [20].
The index species for thelinguiformiszone is extremely rare in Coumiac where it has been only documented by a single conodont element [21]. This species is, however, the sole representent of the subgenusPalmatolepis (Palmatolepis)at that time. In order to provide a reliable estimate of its contribution to the morphological variance within Palmatolepis, its sampling has been increased by includingPalmatolepis (Palmatolepis) linguiformiselements from other localities around the Protothetys [20].
Concerning the beginning of the Famennian, the first zone (triangularis) has been documented in Coumiac [20,22] and in Schaumburg. In order to trace fine scale temporal variations around the key period of the Late Frasnian crisis, both therhenana and thetriangulariszones have been subdivided into subzones. Only the latest of thetriangularissubzone is documented in Schaumburg.
The three following zones of the Famennian (crepida,rhomboidea andmarginifera) have been documented in Schaumburg.
Samples from the Effenberg section document thetrachyterazone [17]. Thepraesulcata zone has been sampled in the Puech de la Suque section [23].
Unfortunately, two Famennian conodont zones (postera and expansa) are missing in this study betweentrachyteraandpraesulcata. Overall, the samples range in age from the end Frasnian (376.163.6 Ma) to the end-Famennian (360.762.7 Ma) [24].
Conodont elements for morphometric analyses. Each rock sample along the composite section was dissolved in formic acid (10%) and rinsed through two sieves. The fraction between 100mm and 1 mm was then picked for all conodont elements.
The conodont animal had a complex feeding apparatus composed of several elements. In the case of Palmatolepis, the apparatus was composed of seven distinct elements (with right and left elements for six of them). The morphometric study focused on the so-called P1 platform element [25] (Fig. 1C) for several reasons. First, this element was the most robust within the former apparatus and therefore with the highest preservation potential. Second, P1 elements display very characteristic morphological traits that make them crucial for the description of the morphological and taxonomical diversity withinPalmatolepis[26]. Many of these characteristics are expressed by variations of the platform shape that can be adequately described by a morpho-metric analysis [27,28,29]. For morphomorpho-metric analyses, all unbroken platform (P1) elements of the genus Palmatolepis (Pa.) were picked over the composite section and measured, e.g. 5171 elements in total.
The morphological diversity within Palmatolepis elements through time led to the description of numerous species and even subspecies. These (sub)species delivered valuable stratigraphic data [30] but their meaning as corresponding to former biological species is debated [26]. They especially present the problem to let a large proportion (up to 90% [31]) of the specimens unidentified and thus not included in the estimation of the morphological variance. The subgenus has been proposed to be closer to what former conodont species might have been, by including a component of geographic and temporal variance that is otherwise split into separate, static units [18,32,33]. To tackle this problem regarding the basic unit for estimating shape variations, three complementary levels have been considered. (1) All Palmatolepis elements have been considered independently of any further taxonomic identification. (2) As a conservative approach, to be as close as possible to the current conodont taxonomy, Palmatolepis elements were attributed to the species (and subspecies whenever existing) level, a part of the samples being then let aside as non-identified specimens. (3)Palmatolepis elements were attributed to larger ‘‘groups’’ of specimens sharing a range of general characters (Fig. 2).
Five of these groups corresponded to taxonomically described subgenera: Manticolepis, Palmatolepis, Deflectolepis, Panderolepis and Conditolepis[34,35,36,37]. The four other groups were tentatively proposed based on the literature [38,39].
– TheManticolepisgroup was typical of the Frasnian period. It is characterized by elements with an asymmetrical and large platform. Elements are as broad as long. The outer lobe is always present and prominent. The carina is straight. The central node has the same size than other nodes of the carina. In our study, this group is documented by the speciesrhenana, rotunda, subrecta, andhassi.
lobe. During the Famennian, the representatives of this group are the largest of all Palmatolepis. They present a distinct secondary carina on the outer lobe. In this study, the representatives are the Frasnianlinguiformisand the Famennian perlobata schindewolfiandrugosa rugosa.
– The Panderolepis group is characterized by elements with slender, triangular and smooth platforms. The platform does not present an outer lobe but has a parapet on the inner side, anterior to the central node. The carina is sigmoidal. This group is represented by the speciestenuipunctataandglabrawith three subspecies:glabra lepta,glabra pectinataandglabra distorta. – The Conditolepis group is characterized by elements without
outer lobe, and with round platforms with a sharp parapet and with a carina developed posterior of the large central node. The anterior part of the carina is more curved than for any other groups. It is represented here by the species marginifera
with two subspecies marginifera marginifera and marginifera inflexoidea.
– The Deflectolepis group is characterized by small, narrow elements with a smooth platform well-developed posterior to the central node. The outline of the platform is elongate. Deflectolepisis always slender than other groups. The carina is straight. The representatives included in this study are the two species with a single subspeciesgracilis gracilisandminuta minuta. – The Subperlobata group includes elements with a sigmoidal carina and a central node more developed than the other nodes of the carina. At the posterior edge of the element, the platform is triangular but asymmetrical with regards to the posterior carina. The outer lobe is present and forms an acute angle with the blade. The platform is not smooth but punctuated of nodes and/or ornamentation. It is documented in our samples by the four speciesquadrantinodosalobata,praeterita,spathulaandlobicornis. Figure 1. Temporal and geographical sampling, and terminology on conodont elements.(A) Timescale, composite section along the end Frasnian and the Famennian and stratigraphic log of the studied sections. Absolute ages after [24] and conodont zones after [77]. Note that the
posteraandexpansazones are not sampled. Along the stratigraphic log of each section, dots represent the sampled levels. Abbreviations: E = Early, M = Middle, L = Late. (B) Paleogeographic map [19] of the Famennian. Circles = location of the French (blue circle) and German (red circle) sections contributing to the composite section. Black dots = location of the sections that delivered additional sampling of Palmatolepis (Palmatolepis) linguiformis. (C) Illustration ofPalmatolepisplatform elements, with the terminology of the morphological features used in taxonomy. To the left a specimen ofPa. (Palmatolepis) rugosa(trachyterazone). To the right a specimen ofPa. (Manticolepis) rotunda(rhenanazone).
doi:10.1371/journal.pone.0036230.g001
Disparity Dynamics in Late Devonian Conodonts
– ThePerlobatagroup corresponds to elements with a triangular and smooth platform, and a free blade with a straight carina. The elements are arched, the posterior edge being tilted upwards. The node is at the center of the blade and is more developed than the other nodes along the carina. An outer lobe is present. In the study, this group is documented by the species praetriangularis, triangularis, crepidaandtermini.
– The Rhomboidea group is characterized by elements with a diamond-shape and smooth platform outline. They are always smaller than elements of the other groups. The carina is sigmoidal, and not developed posterior to the central node. It is sampled here by the speciesdelicatula,clarki,protorhomboideaand rhomboidea.
– TheRegularisgroup includes sigmoidal elements with both sides of the platform parallel to the carina. The upper platform is smooth. It is represented here by the speciesregularis.
The numbers of conodont elements included in the morpho-metric analysis are detailed by group, by (sub)species and by (sub)zones in the Table 1.
Methods
Morphometric Analysis. The two-dimensional analysis of the platform outline has been shown to efficiently describe geographic, temporal, and taxonomic variations of Palmatolepis throughout its record (e.g. [27,28,29]). Because conodont animals had a bilateral symmetry, both right and left elements were found in an assemblage. Left elements were subjected to a mirror transformation and measured as right elements. The two-dimensional outline of each conodont was automatically digitised using an image analyser (Optimas). For each conodont element,x -and y-coordinates of 64 points were sampled at equally spaced
intervals along the outline. The starting point was defined at the tip of the carina (Fig. 1C).
The variation of the distance of each point to the center of the outline as a function of the cumulative distance along the outline was decomposed into a sum of trigonometric functions of decreasing wavelengths (harmonics), each being weighted by two Fourier coefficients (FCs). The zero harmonic, proportional to the outline size, was used to standardize all other FCs so they represent shape variables only. Considering the first eleven harmonics has been shown to provide a satisfying compromise between the number of variables and the amount of shape information (e.g. [29]). One of the advantages of the Fourier functions is that an outline can be reconstructed by successive additions of the different harmonics from any set of Fourier coefficients, allowing a visualization of the shape changes [40,41]. Synthetic shape axes were extracted using a principal component analysis on the correlation matrix of the FCs. This method has been chosen because it is independent of anya priori taxonomic attribution. The first two principal components define a morphospace on which the range of shape variation can be represented. The temporal variation in the occupation of this morphospace has been visualised by plotting each zone separately (Fig. 3). Different levels of variation were considered: the variation among all elements present at a given time (Fig. 4A), or at a higher taxonomic level, among (sub)species and among groups present (Fig. 4B).
Morphological disparity. The morphological disparity quantifies the diversity of shape among a set of units that can be species, higher taxonomic entities, or more rarely single specimens. Several estimates can be considered. The most frequently used are (1) the range encompassed by units along axes of a morphospace, or (2) the inter-unit variance [3,42]. Because it is Figure 2. Temporal distribution and illustration of thePalmatolepisgroups (end Frasnian to end Famennian).Each group is illustrated by a characteristic specimen and the average reconstructed outline. Vertical black bars represent the temporal extension of the groups, grey bars the temporal distribution of the (sub)species of the illustrated specimen. The horizontal dotted lines represent the F/F and the D/C crises.
Table 1.Sampling of the different groups and (sub)species through end-Frasnian and Famennian.
Zones
Early
rhenana
Late
rhenana linguiformis
Early
triang.
Middle
triangularis
Late
triang. crepida rhomboidea marginifera trachytera praesulcata
Groups (sub)species
Manticolepis rotunda 20 10
subrecta 11 16
rhenana 6
gigas 3
indet 545 1698 220
Palmatolepis linguiformis 59
perlobata schindewolfi 55 49 49 33
rugosa rugosa 7
Perlobata triangularis 10 84 51 16
praetriangularis 25 34 62
crepida 18
termini 22
Rhomboidea clarki 12 21
delicatula 22 12
protorhomboidea 3 12
rhomboidea 43
Regularis regularis 4 23 21
Subperlobata spathula 46
lobicormis 2 5
praeterita 11
quadrantinodosalobata 66
Panderolepis tenuipunctata 21 43
glabra lepta 8 81 196 21
glabra pectinata 35 32
glabra distorta 30
Conditolepis marginifera marginifera 218
marginifera inflexoidea 5
Deflectolepis minuta 39 40 34 18
gracilis 11 88 520
indet 16 28 147 60 20 54
Total/zone 576 1733 279 51 183 433 311 268 650 167 520
Number ofPalmatolepiselements measured for the morphometric analysis, detailed by stratigraphic zones (columns) and taxonomic units (rows). Groups and (sub) species are presented in order of their first occurrence in the successive stratigraphic zones.
doi:10.1371/journal.pone.0036230.t001
Disparity
Dynamics
in
Late
Devonian
Conodon
ts
PLoS
ONE
|
www.plos
one.org
5
April
2012
|
Volume
7
|
Issue
4
|
Figure 3. Occupation of thePalmatolepismorphospace through the end Frasnian and the Famennian.The morphospace is defined by the first two axes of a principal component analysis on the Fourier coefficients of the platform outline. The representation has been split by temporal zones. (A) Total variation (each dot corresponds to a single specimen). Symbols correspond to the morphological groups illustrated on the Fig. 2. (B) Variation among (sub)species (each dot corresponds to the average value of the corresponding taxonomic unit). Colours correspond to morphological groups.
independent of the computation of synthetic axes, we have selected the second disparity estimate, namely the morphological variance (i.e. the sum of the variance of the eleven FCs) among units. Using this estimate, disparity has been evaluated at three taxonomic levels: considering as unit each single element (total disparity), considering as unit each (sub)species (‘‘species’’ disparity) or each group (group disparity).
Estimation of the morphological variance can be affected by the number of specimens available [43]. In the present study, differences in the number of conodont elements available in each zone are dramatic: from 51 in the Earlytriangulariszone to 1733 in the Late rhenana zone (see Table 1). This might affect the estimation of the morphological variance (hence the total disparity). We thus used a rarefaction procedure to test this influence. We artificially decreased the sampling of all other zones to the smallest sample size (51 elements), using a random choice within the sample available. To estimate the error related to this random sampling, we repeated the procedure ten times. This provided an estimate of the variance in the estimation of the total disparity in all zones except for the Earlytriangulariszone.
Relationships between morphometrics, disparity, and paleoenvironmental proxies. We obtained for each zone
three estimates of disparity (total, by (sub)species and by group). Scores on the first principal axis were considered as a synthetic shape variable and provided estimates of shape variations along the record, either for all elements (total shape) or for (sub)species and for each group separately.
Disparity and shape variations were further compared with a paleotemperature proxy, represented by a composite record of h18O values of conodont phosphate [10]. Note that as for the conodont samples, all geochemical data were obtained from tropical to subtropical palaeolatitude paleolocations.
Relationships among morphological estimates, and between morphological and paleoenvironmental proxies were investigated. Several complementary tests were used. (1) Linear regressions were used to confront paleoenvironmental data (considered as inde-pendent variables) to morphological variables (deinde-pendent vari-ables). Such an approach compares the raw data and the amount of variation between two successive samples impacts the regression. (2) Spearman-rank order correlations were used to further test the relationship between the variables. Values of each variable are ranked and these ranks are then compared among variables. This limits the impacts of extreme shifts that can be for instance due to a long time elapsed between two successive Figure 4. End Frasnian to end Famennian variations inPalmatolepisdisparity and morphology, and paleoenvironment.(A) Temporal variations inPalmatolepisdisparity. Blue diamonds = total disparity (for thelinguiformiszone, two values are provided: including additionalPa. (Pa.) linguiformis [full line] or relying on Coumiac sampling only [dotted line]). Red squares = (sub)species disparity. Green circles = group disparity. Disparity was estimated as the variance among units (elements, (sub)species or groups), i.e. the sum of the variance of the Fourier coefficients. Robustness of the total disparity estimate to variations in sampling has been evaluated by a random rarefaction procedure, each sample being randomly subsampled 10 times to the lowest sample size (51 elements). Error bars (95% confidence interval [CI]) are represented but are masked by the symbol of the mean value of the rarefied samples (grey squares). (B) Morphometric variation of the differentPalmatolepisgroups through time. The first axis (PC1) of the morphospace has been considered as synthetic shape axis. Average value+/295% CI has been represented for each group. (C) Morphometric variation of the total assemblage through time, represented by the average value+/295% CI per zone of all elements on the synthetic shape axis (PC1). Reconstructed outlines visualize the shape change along PC1, corresponding to the presence (negative values) or absence (positive values) of a lobe. (D) Variation in sea-surface temperature per zone based on conodont apatiteh18O (data from [10]),+/295% CI. The solid line corresponds to the Frasnian/Famennian boundary. The dashed line represents the separation between two periods characterized by different environmental conditions: at the base an overall warm period with non-oriented fluctuations, followed by an oriented cooling trend.
doi:10.1371/journal.pone.0036230.g004
Disparity Dynamics in Late Devonian Conodonts
samples. (3) A correlation of paleoenvironmental and morpholog-ical variables could be due to the fact they both vary concomitantly through time. The data were thus detrended by considering the first difference (difference between two successive values along a time-series) and thereafter compared using the above mentioned procedures (linear regression and Spearman rank-order correlation).
Results
Temporal variations in the morphospace
The first two principal axes (PC1 = 26.7% and PC2 = 13.7% of the total variance) defined a morphospace on which the distribution of all Palmatolepis platform elements has been represented through time (Fig. 3A).
Towards the end of the Frasnian (rhenana zone), Palmatolepis elements were tightly clustered in the part of the morphospace corresponding to negative PC1 and positive PC2 scores. This cluster corresponded to conodonts attributed to the Manticolepis group. A limited diversification occurred during the latest zone of the Frasnian (linguiformis zone). A cluster occupied a formerly empty zone of the morphospace, towards slightly positive PC1 values. This cluster corresponded to the occurrence of the Palmatolepisgroup.
The earliest Famennian, just after the Frasnian/Famennian crisis (Early triangularis zone), was marked by a retraction of the morphological range towards the zone occupied during therhenana zone. This corresponded to the occurrence of conodonts from the PerlobataandSubperlobatagroups.
During the latest part of thetriangulariszone, a reoccupation of the range formerly occupied by Palmatolepis was initiated. The
crepida zone was characterized by a wide occupation of the
morphospace, with an extension towards positive PC1 values. This was concomitant with the occurrence of the Regularis and Deflectolepisgroups. Starting during therhomboideazone, but more extreme during the marginifera zone, a shift occurred towards a dominance of elements with positive PC1 values. A median range was still occupied by theConditolepisgroup, whereas elements of the Panderolepisgroup clustered towards positive PC1 and median PC2 values, andDeflectolepiselements clustered towards extreme positive PC1 and PC2 values.
During thetrachyterazone, the range occupied shrinked towards positive PC1 only, a trend that culminated during the latest zone of the Famennian (praesulcata).Deflectolepiselements occupied then a limited zone of the morphospace, towards positive PC1 and PC2 values. This mirrored the situation that occurred during the end of the Frasnian, but with a cluster of elements in a completely different zone of the morphospace.
From variations among elements to species and groups Beyond these trends that corresponded to variations in the distribution of all Palmatolepis elements, (sub)species have been identified within groups. We investigated visually whether these units had a morphological coherence (Fig. 3A and B). Indeed, each group corresponded to a given zone of the morphospace (Fig. 3A), despite some overlap, especially during the highly diversified periods (crepida, rhomboidea and marginifera zones). Accordingly, (sub)species of a given group tended to cluster together in the morphospace (Fig. 3B). Using the inverse Fourier transform method, average shape of each group was visualised (Fig. 2). They illustrated how the morphological characteristics that served to define each group were mirrored on the morphometric description of the outline.
Patterns of disparity
Patterns of disparity observed among the total assemblages of elements, among (sub)species and among groups were remarkably similar (Fig. 4A). Starting from a low disparity during therhenana zone, a momentary increase occurred during thelinguiformiszone due to the co-occurrence of two groups (Manticolepis and Palmatolepis). Noted that the increase in total disparity was slightly emphasized by the supplementaryPa. (Pa.) linguiformisspecimens that had been added to the original sample. Disparity was back to a very low level just after the F/F crisis (lowertriangularis zone), started increasing from the middle triangularis onward, up to culminate during thecrepidazone. From this maximum it gradually decreased down to levels during the end Famennian (praesulcata zone) as low as during the end Frasnian.
Disparity estimates based on (sub)species and based on groups provided highly similar results (linear correlation, R2= 0.93, P,0.001). This result suggested that splitting groups in different species did not explain much of the morphological variance and it reinforced the use of the groups as relevant biological units. Considering the disparity among the total assemblage of specimens is a seldom used approach, because this estimate may vary depending on the relative abundance of the different taxonomic units. Our results showed that this approach provided the same trends as the disparity among species or groups (totalvs.species disparity: R2= 0.73, P = 0.001; total vs. group disparity: R2= 0.64, P = 0.003). Disparity estimate based on the total assemblage of specimens appeared as quite robust to sampling issues as shown by the estimates based on rarefied samples that were similar to those based on the total sample. Furthermore variance among replicates of the rarefaction procedure was so reduced that error bars corresponding to a 95% standard error were not visible on curves (Fig. 4A). This approach may thus constitute a valuable alternative to estimate disparity levels in groups where taxonomic units are debated and difficult to identify with a reliable biological meaning [26].
Patterns of shape variation
Since the distribution in the morphospace showed a progressive shift in the zones that were occupied, we investigated how this corresponded to shape changes through time. Once again, two levels of variation were considered: trends per groups (Fig. 4B), and the total trend corresponding to the average shape of all Palmatolepiselements at a given time (Fig. 4C).
Each group was characterized by a given range along PC1 (e.g Manticolepisaround -1,Panderolepisaround 1.2,Deflectolepisaround 1.6), supporting its definition as separate unit. Beyond this morphological coherence of the groups, the range they occupied often varied through time.Perlobata as well as Regularisdisplayed temporal variations, starting from negative PC1 close to those of the FrasnianManticolepisto evolve towards positive scores similar to typical Famennian groups such as Panderolepis. Similarly, Deflectolepisdisplayed a trend towards more extreme shapes along the Famennian.
Variation in the total average shape were further considered along PC1 (Fig. 4C). Overall, this axis opposed platform elements with a developed lobe (negative PC1) and elements without a lobe (positive PC1). The average shape per level included and summarized different sources of variation: succession of groups with different characteristic shapes, temporal variations within these groups, and changes in the relative abundance between the groups (Fig. 4C). Despite this composite information, coherent temporal trends emerged. Total average shape was quite stable during the end Frasnian. A slight shift occurred during the
platform, but the average shape was still quite stable. A trend of regression of the lobe (increase along PC1) started increpidazone and continued up to the latest zone of the Famennian (praesulcata).
Comparison with paleoenvironmental trends
Oxygen isotope data [10] provided a proxy for temperature variations throughout the period. Two main periods emerged regarding these paleoenvironmental variations (Fig. 4D): an overall warm period with short-term fluctuations (from the end Frasnian to the end of thetriangulariszone) followed by a trend of decreasing temperature until the end of the Famennian.
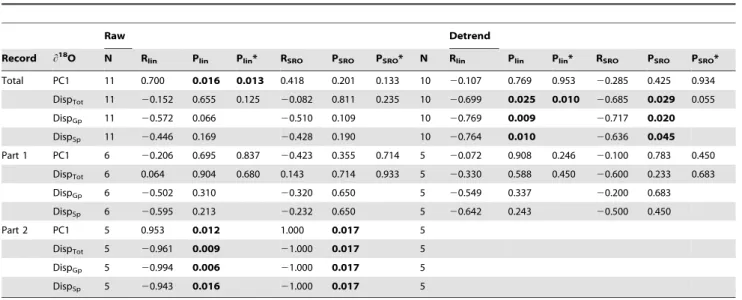
In order to investigate a possible impact of these variations on the disparity pattern and morphological evolution ofPalmatolepis, we compared the morphological parameters (average shape and disparity estimates) with this paleotemperature proxy. Combining all tests (linear and rank-order correlations on raw and detrended data; Table 2), the major patterns emerging can be summarized as follow. (1) Over the whole period, shape and disparity tended to co-vary with the paleoenvironmental proxy. (2) Such correlations failed to be evidenced during the first part of the record, corresponding to non-oriented environmental fluctuations. (3) In contrast, variations in shape and disparity are related to environmental changes during the second part of the record, corresponding to the cooling trend.
Discussion
Disparity describes how organisms are distributed in a morphological space. A first component in structuring this distribution is the phylogenetic history of the groups. Closely related species, sharing numerous genes and developmental pathways, usually display close morphologies whereas an increased phylogenetic divergence leads to an increased morphological differentiation (e.g. [44,45,46]). Yet, such a passive diffusion in a morphospace appears to be slow when compared to shifts due to morphological innovations related to adaptation to new ecological
niches [46,47]. As a consequence, taxa sharing similar ecology will tend to display similar morphologies, making the occupation of the morphospace a signature of the resource partitioning in the ecological space.
Assessing patterns of disparity through time can thus bring precious insights into the processes driving diversification – or extinction. The Late Devonian was punctuated by two outstand-ing biotic crises, and the first step was thus to consider how these crises impacted the small-scale diversity within our model organism, the conodont Palmatolepis. The interpretation of the disparity patterns for this fossil group was confronted to the problem of identifying the relevant level of variation to estimate morphological variance. The congruence of all disparity patterns, estimated on the set of all specimens, on the stratigraphic species, or on larger groups supposed to be closer to what the biological species might have been [26], makes us confident that beyond such debates, robust trends emerged as a basis for fine-scale evolutionary and ecological interpretations.
Impact of major biotic crises at a fine evolutionary scale Both the F/F and the D/C crises were characterized by environmental perturbations similar in their nature [7] including rapid sea-level fluctuations [48] and abrupt changes in sea-surface temperatures [10,49,50]. Their differential impact on the biosphere was apparently related to differences in the timing and magnitude of the environmental perturbations [7,51,52]. Reverse to what occurred to many other groups,Palmatolepissurvived the F/F but went extinct during the D/C crisis.
A candidate explanation of this differential survival is that the set of related species constitutingPalmatolepisdid not confront each crisis with the same potential of survival. Indeed, F/F and
pre-D/C Palmatolepis occupied opposed areas of the morphological
space, suggesting adaptations to very different ecological condi-tions. Shortly before their extinction during the D/C crisis, Palmatolepisconodonts did only display elements with extremely reduced platform. During the F/F crisis, the group going extinct
Table 2.Relationship betweenPalmatolepisshape and disparity, and paleoenvironmental variations.
Raw Detrend
Record h18O N R
lin Plin Plin* RSRO PSRO PSRO* N Rlin Plin Plin* RSRO PSRO PSRO*
Total PC1 11 0.700 0.016 0.013 0.418 0.201 0.133 10 20.107 0.769 0.953 20.285 0.425 0.934
DispTot 11 20.152 0.655 0.125 20.082 0.811 0.235 10 20.699 0.025 0.010 20.685 0.029 0.055
DispGp 11 20.572 0.066 20.510 0.109 10 20.769 0.009 20.717 0.020
DispSp 11 20.446 0.169 20.428 0.190 10 20.764 0.010 20.636 0.045
Part 1 PC1 6 20.206 0.695 0.837 20.423 0.355 0.714 5 20.072 0.908 0.246 20.100 0.783 0.450
DispTot 6 0.064 0.904 0.680 0.143 0.714 0.933 5 20.330 0.588 0.450 20.600 0.233 0.683
DispGp 6 20.502 0.310 20.320 0.650 5 20.549 0.337 20.200 0.683
DispSp 6 20.595 0.213 20.232 0.650 5 20.642 0.243 20.500 0.450
Part 2 PC1 5 0.953 0.012 1.000 0.017 5
DispTot 5 20.961 0.009 21.000 0.017 5
DispGp 5 20.994 0.006 21.000 0.017 5
DispSp 5 20.943 0.016 21.000 0.017 5
Correlations between the paleoenvironmental proxy (h18O) andPalmatolepismean shape (PC1), total disparity (DispTot), group disparity (DispGp) and (sub)species disparity (DispSp) were calculated using linear regressions (lin) and Spearman rank-order correlation (SRO). For both, the number of items (N), the coefficient of correlation (R) and the probability of the correlation (P) are provided. A star (*) indicates values calculated without the specimens ofPa. (Pa.) linguiformisadded to the one of Coumiac. To the left, values based on raw data; to the right, values based on detrended data (first order difference, i.e. differences between successive samples). The correlations have been estimated for the whole record (Total), its first part corresponding to non-oriented climatic fluctuations (Part 1, fromrhenanatotriangularis), and on its second part marked by a cooling trend (Part 2, fromcrepidatopraesulcata).
doi:10.1371/journal.pone.0036230.t002
Disparity Dynamics in Late Devonian Conodonts
(represented by Pa. (Pa.) linguiformis) also tended to present a reduced platform. This trait might thus have constituted a factor of increased risk of extinction. Although the conodont diet is still largely unresolved, a developed platform argues for the ability to handle robust food, whereas a reduced platform would better match the consumption of soft food. The ability to exploit a variety of resources, including robust prey, might have been a selective advantage at a time when resources were anyway decimated by the global crisis.
Another, not mutually exclusive factor increasing risk of extinction, is to face the crisis with an already impoverished diversity. Then, extinction is more probable even when occurring at random [3,53,54]. Remarkably,Palmatolepispresented two cases matching this scenario, since its disparity was at its lowest just before both the F/F and the D/C crisis. Hence, the typical macro-evolutionary pattern of depletion in diversity marking major crises cannot be recognised in the fine-scale evolutionary pattern of
Palmatolepis. Far from being highly diversified before, and
impoverished by the crises, it faced them with an – unfavourable – low diversity.
Thus, at this scale of disparity, the driving force of disparity does not seem to be the major, punctual events of the crises. More progressive processes seem to have shaped conodont disparity during the period between the crises. Such processes went largely unnoticed because that period deserved little interest among researchers due to the overall stability of fauna in terms of diversity.
An inter-crisis cycle of increase and decrease in disparity The expected pattern of impoverished disparity consecutive to the major event of a biotic crisis was not documented along the record of Palmatolepis morphological evolution. In contrast, a progressive diversification occurred shortly after the crisis. This pattern matches the expectation of a ‘‘recovery period’’ during which the impoverished ecosystem is increasing again in complexity. The crisis, by decimating many groups, is supposed to have let vacant many ecological niches that the post-crisis organisms progressively re-occupied [55,56,57,58,59,60]. The pattern of diversification withinPalmatolepismatched, at this fine evolutionary scale, the expected macro-evolutionary pattern of recovery. The diversification occurred in few million years, along the first zone consecutive to the crisis. It also occurred in a selective manner, with an oriented trend corresponding to the progressive occupation of morphospace areas corresponding to slender elements with a more and more reduced platform. Based on an ecomorphological interpretation of these variations, this suggests a diversification of the food resources exploited by Palmatolepis, a process favoured by the decimation of the ecosystem that occurred shortly before, towards the consumption of other, presumably softer preys.
A more surprising feature is that this diversification did not continue until the next major biotic crisis punctuating the D/C boundary. It did not even reach a plateau of stable disparity, associated with a subsequent increase in diversity: such a pattern is the sign of rapid morphological innovations allowing the conquest of new ecological niches, followed as a subsequent step by a finer resource partitioning between related species [16]. Rather, disparity started a gradual decrease soon after reaching its maximum. This pattern cannot be related to any catastrophic mass extinction events and rather point to the importance of other, more discrete factors in driving disparity trends in the inter-crisis period. The decrease in disparity was further selective, with a progressive switch towards a dominance of platform-reduced
morphologies to the detriment of shapes with a well-developed platform that were characteristics of the beginning of the record. This decrease in disparity appears to be related to the cooling trend characterizing the time period. This may be due to coincident trends without causal relationship. Yet, Palmatolepis was characterized by warm-water preferences, being restricted to tropical and sub-tropical areas [39,61,62]. It is thus likely that the cooling trend was unfavourable to this taxon. The selectivity of the disparity decrease further suggests that resources available to Palmatolepiswere shrinking towards the end of the Devonian. This may be due to a decrease in primary productivity itself, but the composition and dynamics of the primary producers, and even more the feedbacks between the carbon cycle and the climate change, are far from being understood in this deep past [63,64,65]. More simply,Palmatolepismight have been deprived of access to resources it formerly consumed by changes in the ecosystem itself. First, each group had its own timing of post-crisis recovery, and possibly Palmatolepis acted as an opportunistic taxon rapidly colonizing empty niches but thereafter outcompeted by more specialist groups [66]. In support of this interpretation,Palmatolepis has been suggested to be an opportunistic taxa investing much in early reproduction and achieving a rapid turnover [67], traits prone to rapidly colonize perturbed environments. Candidate competitors included Bispathodus, another conodont genus that increased in diversity along the Famennian to represent the dominant component of the conodont fauna towards the end of the period [23,30,68]. Its increase in absolute abundance, however, did not fully compensate the decrease in Palmatolepis [32], suggesting that it was not the sole competitor involved.
Beyond the dynamics of post-crisis recovery, the evolution of Palmatolepis may have interfered with processes occurring at a longer time pace. During the Late Paleozoic, the ecosystems were increasing in complexity because of the diversification of major groups. This is the case of ammonoids and chondrychthians [69,70] that were competing with conodonts for resources [70,71]. This large-scale process of diversification did not only involve competitors, but also predators such as sharks and fishes [72,73], thus increasing selective pressures on conodonts even beyond access to resources.
Interplay of evolutionary processes at different scales and paces
The selective impoverishment ofPalmatolepisdisparity could thus be the result of an unfavourable combination: deteriorating climate, diversification of predators, and increasing competition at different paces, from the F/F recovery to long-term increase in complexity of the ecosystems. All could have contributed to its decrease in diversity and disparity predating the D/C crisis. Without being the direct cause of Palmatolepis extinction, all of these factors could have thus increased the risk of extinction; similar dynamics seems probable just before the F/F crisis, although this part of the record is not documented here. In this context, the major events constituted by the crises do not emerge as the key factors driving disparity dynamics withinPalmatolepis. Rather, the progressive change in the structure of the ecological space seems to have conditioned the diversification and subse-quent impoverishment ofPalmatolepis.
processes. Palmatolepis disparity illustrates this intermingling of scales. It appears as the combined product of long-term trends in ecosystem complexity, middle-term trends in climate and dynamics of related groups, and even short-term evolutionary trends within each group composing Palmatolepis. Indeed, several Palmatolepisgroups displayed oriented trends that mirrored, within each lineage, the trend followed by the genus as a whole. Fine-scale evolutionary analyses also demonstrated the ability of Palmatolepisspecies to track and adapt rapid temperature changes during the F/F crisis [20,76]. Further integrative studies attempting to combine paleoenvironmental, paleoecological and evolutionary studies over intermediate time-scales will be neces-sary to decipher how evolutionary and ecological responses over short-time scale interplay and condition the mid- to long-term variation of the ecosystem, and contribute to an emergent macro-evolutionary signal.
Acknowledgments
We thank Requadt H. (Mainz) for providing us the conodonts from the Schaumburg section (Germany), C. Corradini (Cagliari) for useful discussion on taxonomic issues, and B. Lefe`bvre (Lyon) for a constructive reading of the manuscript. We acknowledge Nicholas D. Pyenson and two anonymous referees for their constructive comments which improve the manuscript. ISEM contribution 2012-033.
Author Contributions
Conceived and designed the experiments: CG SR. Performed the experiments: CG SR. Analyzed the data: CG SR. Contributed reagents/ materials/analysis tools: CG SR. Wrote the paper: CG SR.
References
1. Raup DM, Sepkoski JJ, Jr. (1982) Mass extinctions in the marine fossil record. Science 215: 1501–1503.
2. Raup DM, Sepkoski JJ, Jr. (1986) Periodic extinction of families and genera. Science 231: 833–836.
3. Foote M (1997) The evolution of morphological diversity. Annual Review of Ecology, Evolution, and Systematics 28: 129–152.
4. Sepkoski JJ, Jr. (1982) Mass extinctions in the Phanerozoic oceans: A review. Geological Society of America Special Paper 190: 283–289.
5. Sepkoski JJ, Jr. (1986) Phanerozoic overview of mass extinction. In: Raup MR, Jablonski D, eds. Patterns and processes in the Earth History of Life. Berlin: Springer-Verlag. pp 277–295.
6. Sepkoski JJ, Jr. (1978) A kinetic model of Phanerozoic taxonomic diversity. I. Analysis of marine orders. Paleobiology 4: 223–251.
7. Walliser OH (1996) Global events and event stratigraphy; Springer Verlag, editor, ed. Berlin, Heidelberg, New York: Springer Verlag. 333 p.
8. McGhee GRJ (1996) The Late Devonian Mass Extinction - The Frasnian/ Famennian crisis; Bottjer DJ, Bambach RK, eds. New York: Columbia University Press. 303 p.
9. Buggisch W, Joachimski MM, Sevastopulo G, Morrow JR (2008) Mississippian h13
Ccarband conodont apatiteh18O records — Their relation to the Late Palaeozoic glaciation. Palaeogeography, Palaeoclimatology, Palaeoecology 268: 273–292.
10. Joachimski MM, Breisig S, Buggisch W, Talent JA, Mawson R, et al. (2009) Devonian climate and reef evolution: Insights from oxygen isotopes in apatite. Earth and Planetary Science Letters 284: 599–609.
11. Scheckler SE (1986) Geology, floristics and paleoecology of Late Devonian coal swamps from Appalachian Laurentia. Annales de la Socie´te´ Ge´ologique de Belgique 109: 209–222.
12. Klug C, Kro¨ger B, Kiessling W, Mullins GL, Servais T, et al. (2010) The Devonian nekton revolution. Lethaia 43: 465–477.
13. Purnell MA (1995) Microwear on conodont elements and macrophagy in the first vertebrates. Nature 374: 798–800.
14. Johansson F, Ra˚dman P, Andersson J (2006) The relationship between ontogeny, morphology, and diet in the Chinese hook snout carp (Opsariichthys bidens). Ichthyological Research 53: 63–69.
15. Linde M, Palmer M, Gomez-Zurita J (2004) Differential correlates of diet and phylogeny on the shape of the premaxilla and anterior tooth in sparid fishes (Perciformes: Sparidae). Journal of Evolutionary Biology 17: 941–952. 16. Price SA, Holzman R, Near TJ, Wainwright PC (2011) Coral reefs promote the
evolution of morphological diversity and ecological novelty in labrid fishes. Ecology Letters 14: 462–469.
17. Girard C, Renaud S, Korn D (2004) Step-wise evolutionary trends in fluctuating environments: evidence in the Late Devonian conodont genusPalmatolepis. Geobios 37: 404–415.
18. Girard C, Renaud S, Feist R (2007) Morphometrics of Late Devonian conodont genusPalmatolepis: phylogenetic, geographical and ecological contributions of a generic approach. Journal of Micropalaeontology 26: 61–72.
19. Scotese CR, McKerrow WS (1990) Revised world maps and introduction. In: McKerrow WS, Scotese CR, eds. Palaeozoic palaeogeography and biogeogra-phy. London: Geological Society of London Memoirs. pp 1–24.
20. Girard C, Renaud S (2007) Quantitative conodont-based approaches for correlation of the Late Devonian Kellwasser anoxic events. Palaeogeography, Palaeoclimatology, Palaeoecology 250: 114–125.
21. Girard C, Klapper G, Feist R (2005) Subdivision of the terminal Frasnian linguiformisconodont Zone, revision of the correlative interval of Montagne Noire Zone 13, and discussion of stratigraphically significant associated trilobites. In: Over DJ, Morrow JR, Wignall PB, eds. Understanding Late Devonian and Permian-Triassic Biotic and Climatic Events: Towards an integrated approach: Developments in Palaeontology and Stratigraphy Series. pp 181–198.
22. Becker RT, Feist R, Flajs G, House MR, Klapper G (1989) Frasnian/ Famennian extinction events in the Devonian at Coumiac, southern France. Comptes Rendus de l’Acade´mie des Sciences, se´rie II 309: 259–266. 23. Girard C (1994) Conodont biofacies and event stratigraphy across the D/C
boundary in the stratotype area (Montagne Noire, France). In: Ko¨nigshof P, Werner R, eds. Willi Ziegler-Festschrift I. Frankfurt a. M.: Courier Forschungsinstitut Senckenberg. pp 299–309.
24. Kaufmann B (2006) Calibrating the Devonian Time Scale: a synthesis of U-Pb ID-TIMS ages and conodont stratigraphy. Earth Science Reviews 76: 175–190. 25. Purnell MA, Donoghue PCJ, Aldridge RJ (2000) Orientation and anatomical
notation in conodonts. Journal of Paleontology 74: 113–122.
26. Girard C, Renaud S (2011) The species concept in a long-extinct fossil group, the conodonts. Comptes rendus Palevol 10: 107–115.
27. Klapper G, Foster CT, Jr. (1993) Shape analysis of Frasnian species of the Late Devonian conodont genusPalmatolepis. The Paleontological Society Memoir 32, Journal of Paleontology 32: 1–35.
28. Klapper G, Foster CTJ (1986) Quantification of outlines in Frasnian (Upper Devonian) platform conodonts. Canadian Journal of Earth Sciences 23: 1214–1222.
29. Renaud S, Girard C (1999) Strategies of survival to extreme environmental perturbations: evolution of conodonts in response to the Kellwasser crisis (Upper Devonian). Palaeogeography, Palaeoclimatology, Palaeoecology 146: 19–32. 30. Ziegler W, Sandberg CA (1984)Palmatolepis-based revision of upper part of
standard Late Devonian conodont zonation. In: Clark DL, ed. Conodont biofacies and provincialism. Boulder/Colorado: Geological Society of American special Paper. pp 179–194.
31. Morrow J (2000) Shelf-to-basin lithofacies and conodont paleoecology across Frasnian-Famennian (F-F, mid-Late Devonian) boundary, Central Great Basin (Western U.S.A.). Courier Forschungsinstitut Senckenberg 219: 1–57. 32. Girard C, Phuong TH, Savage NM, Renaud S (2010) Temporal dynamics of the
geographic differentiation of Late DevonianPalmatolepis assemblages in the Prototethys. Acta Palaeontologica Polonica 55: 675–687.
33. Girard C, Renaud S, Se´rayet A (2004) Morphological variation ofPalmatolepis Devonian conodonts: speciesvs.genus. Comptes rendus Palevol 3: 1–8. 34. Boogard van den M, Kuhry B (1979) Statistical reconstruction of thePalmatolepis
apparatus (Late Devonian conodontophorids) at the generic, subgeneric, and specific level. Scripta Geologica 49: 1–57.
35. Helms JJ (1963) Zur ‘‘Phylogenese’’ und Taxonomie von Palmatolepis (Conodontida, Oberdevon). Geologie 4: 449–485.
36. Helms JJ, Ziegler W (1981) Evolution of the Pa element inPalmatolepis. In: Clark DL, Sweet WC, Bergstro¨m SM, Klapper G, Austin RL, et al., editor. Conodonta Treatise on invertebrate Paleontology, Part W (Miscellanea) Geo-logical Society of America and University of Kansas 202.
37. Mu¨ller KJ (1956) Die GattungPalmatolepis. Abhandlungen der senckenber-gischen naturforschenden Gesellschaft 494: 1–70.
38. Schu¨lke I (1995) Evolutive Prozesse beiPalmatolepisin der fru¨hen Famenne-Stufe (Conodonta, Ober-Devon). Go¨ttingen: Go¨ttinger Arbeiten zur Geologie und Pa¨laontologie. 108 p.
39. Ziegler W, Sandberg CA (2000) Utility of Palmatolepids and Icriodontids in recognizing Upper Devonian Series, Stage, and possible Substage boundaries. In: Bultynck P, ed. Subcommission on Devonian Stratigraphy Recognition of Devonian series and stage boundaries in geological areas. Frankfurt a. M.: Courier Forschungsinstitut Senckenberg. pp 335–347.
40. Renaud S, Michaux J, Jaeger J-J, Auffray J-C (1996) Fourier analysis applied to Stephanomys(Rodentia, Muridae) molars: non progressive evolutionary pattern in a gradual lineage. Paleobiology 22: 255–265.
41. Viguier B, Tort A (2000) Morphologie craˆnienne et mandibulaire des Indrinae. Apports des me´thodes Procrustes et des analyses de Fourier. Comptes rendus de l’Acade´mie des Sciences de Paris, Sciences de la Vie 323: 573–582.
Disparity Dynamics in Late Devonian Conodonts
42. Gerber S, Neige P, Eble GJ (2007) Combining ontogenetic and evolutionary scales of morphological disparity: a study of early Jurassic ammonites. Evolution & Development 9: 472–482.
43. Cardini A, Elton S (2007) Sample size and sampling error in geometric morphometric studies of size and shape. Zoomorphology 126: 121–134. 44. Borsa P (2002) Allozyme, mitochondrial-DNA, and morphometric variability
indicate cryptic species of anchovy (Engraulis encrasicolus). Biological Journal of the Linnean Society 75: 261–269.
45. Kassahn KS, Donnellan SC, Fowler AJ, Hall KC, Adams M, et al. (2003) Molecular and morphological analyses of the cuttlefishSepia apamaindicate a complex population structure. Marine Biology 143: 947–962.
46. Renaud S, Chevret P, Michaux J (2007) Morphological vs. molecular evolution: ecology and phylogeny both shape the mandible of rodents. Zoologica Scripta 36: 525–535.
47. Svanba¨ck R, Eklo¨v P (2004) Morphology in perch affects habitat specific feeding efficiency. Functional Ecology 18: 503–510.
48. Girard C (1996) Re´ponse des communaute´s de conodontes aux perturbations eustatiques: les e´ve´nements fini-de´voniens (Kellwasser supe´rieur et Hangenberg) dans la Montagne Noire (France). Revue de Micropale´ontologie 39: 261–270. 49. Joachimski M, Buggish W (2002) Conodont apatiteh18
O signatures indicate climatic cooling as a trigger of the Late Devonian mass extinction. Geology 30: 711–714.
50. Kaiser SI, Steuber T, Becker RT (2008) Environmental change during the Late Famennian and Early Tournaisian (Late Devonian–Early Carboniferous): implications from stable isotopes and conodont biofacies in southern Europe. Geological Journal 43: 241–260.
51. Hallam A, Wignall PB (1997) Mass extinctions and their aftermath. Oxford: Oxford University Press. 320 p.
52. Racki G (2005) Towards understanding Late Devonian global events: few answers, many questions. In: Over DJ, Morrow JR, Wignall PB, eds. Understanding Late Devonian and Permian-Triassic Biotic and Climatic Events: Towards an integrated approach: Developments in Palaeontology and Stratigraphy Series. pp 5–36.
53. Janevski GA, Baumiller TK (2009) Evidence for extinction selectivity throughout the marine invertebrate fossil record. Paleobiology 35: 553–564.
54. Villier L, Korn D (2004) Morphological disparity of ammonoids and the mark of Permian mass extinctions. Science 306: 264–266.
55. Chen Z-Q, Kaiho K, George AD (2005) Survival strategies of brachiopod faunas from the end-Permian mass extinction. Palaeogeography, Palaeoclimatology, Palaeoecology 224: 232–269.
56. Chen Z-Q, Kaiho K, George AD (2005) Early Triassic recovery of the brachiopod faunas from the end-Permian mass extinction: A global review. Palaeogeography, Palaeoclimatology, Palaeoecology 224: 270–290.
57. Friedman M (2010) Explosive morphological diversification of spiny-finned teleost fishes in the aftermath of the end-Cretaceous extinction. Proceedings of the Royal Society of London B 277: 1675–1683.
58. Sahney S, Benton MJ (2008) Recovery from the most profound mass extinction of all time. Proceedings of the royal Society B 275: 759–765.
59. Bottjer DJ, Clapham ME, Fraiser ML, Powers CM (2008) Understanding mechanisms for the end-Permian mass extinction and the protracted Early Triassic aftermath and recovery. Geological Society of America Today 18: 4–10.
60. Jacobsen N, Twitchett RJ, Krystyn L (2011) Palaeoecological methods for assessing marine ecosystem recovery following the Late Permian mass extinction event. Palaeogeography, Palaeoclimatology, Palaeoecology 308: 200–212. 61. Sandberg CA (1976) Conodont biofacies of late DevonianPolygnathus styriacus
Zone in western United States. In: Barnes CR, ed. Conodont Paleoecology. Montreal: Geological Association of Canada special Paper. pp 171–186. 62. Seddon G, Sweet WC (1971) An ecologic model for conodonts. Journal of
Paleontology 45: 869–880.
63. Algeo TJ, Berner RA, Maynard JB, Scheckler SE (1995) Late Devonian oceanic anoxic events and biotic crises: ‘‘rooted’’ in the evolution of vascular land plants? Geological Society of America Today 5: 45/65–66.
64. Godde´ris Y, Joachimski MM (2004) Global change in the Late Devonian: modelling the Frasnian-Famennian short-term carbon isotope excursions. Palaeogeography, Palaeoclimatology, Palaeoecology 202: 309–329.
65. Saltzman MR (2005) Phosphorus, nitrogen, and the redox evolution of the Paleozoic oceans. Geology 33: 573–576.
66. Sandberg CA, Morrow JR, Ziegler W (2002) Late Devonian sea-level changes, catastrophic events, and mass extinctions. Geological Society of America Special Paper 356: 473–487.
67. Girard C, Renaud S (2008) Disentangling allometry and response to Kellwasser anoxic events in the Late Devonian conodont genusAncyrodella. Lethaia 41: 383–394.
68. Corradini C (2003) Late Devonian (Famennian) conodonts from the Corona Mizziu Sections near Villasalto (Sardinia, Italy). Palaeontographia Italica 89: 65–116.
69. Bambach RK (2002) Supporting predators: changes in the global ecosystem inferred from changes in predator diversity. Paleontological Society Papers 8: 319–351.
70. Ginter M, Hairapetian V, Klug C (2002) Famennian chondrichthyans from the shelves of North Gondwana. Acta Geologica Polonica 52: 169–215. 71. Dzik J (2002) Emergence and collapse of the Frasnian conodont and ammonoid
communities in the Holy Cross Mountains, Poland. Acta Palaeontologica Polonica 47: 565–650.
72. Long JA, Trinajstic K (2010) The Late Devonian Gogo Formation La¨gerstatte of Western Australia: Exceptional Early Vertebrate Preservation and Diversity. Annual Review of Earth and Planetary Sciences 38: 255–279.
73. Nicoll RS (1977) Conodont apparatuses in an Upper Devonian palaeoniscoid fish from the Canning Basin, Western Australia. Bureau Mineral Research -Journal of Australian Geology and Geophysics 2: 217–228.
74. Lambrinos JG (2004) How interactions between ecology and evolution influence contemporary invasion dynamics. Ecology 85: 2061–2070.
75. Stigall AL (2012) Speciation collapse and invasive species dynamycs during the Late Devonian ‘‘Mass extinction’’. Geological Society of America Today 22: 4–9.
76. Balter V, Renaud S, Girard C, Joachimski MM (2008) Record of climate-driven morphological changes in 376 Ma Devonian fossils. Geology 36: 907–910. 77. Ziegler W, Sandberg CA (1990) The late Devonian standard conodont zonation.