Rev Odontol UNESP. 2015 July-August; 44(4): 189-194 © 2015 - ISSN 1807-2577
ORIGINAL ARTICLE
Doi: http://dx.doi.org/10.1590/1807-2577.0049
Removable partial or complete dentures exposed to beverages and
mouthwashes: evaluation of microhardness and roughness
Próteses parciais e totais removíveis expostas a bebidas e enxaguatórios bucais:
avaliação da microdureza e rugosidade
Fernanda Alves FEITOSA
a*, Mateus Guimarães Lage REGGIANI
a, Rodrigo Máximo de ARAÚJO
aaInstituto de Ciência e Tecnologia, UNESP – Univ Estadual Paulista, São José dos Campos, SP, Brazil
Resumo
Objetivo: Avaliar a rugosidade e microdureza de uma resina acrílica utilizada para base de prótese quando submetidas a diferentes bebidas e enxaguatórios bucais. Material e método: Oitenta amostras retangulares foram confeccionadas com polimetilmetacrilato, e separados em 8 grupos. As amostras foram avaliadas quanto àmicrodureza e rugosidade (Knoop) supericiais e imersas por 10 minutos em um dos seguintes produtos: café, suco artiicial de limão, gluconato de clorexidina, vinho tinto, refrigerante a base de cola, vinagre e antissépticos com e sem álcool. Após a imersão nas soluções, as amostras foram acondicionados em saliva artiicial por 23 horas e 50 minutos, completando o período de 24 horas. Esse procedimento ocorreu por 14 dias consecutivos e após esse período outras mensurações de microdureza e rugosidade foram realizadas. Os dados obtidos foram analisados estatisticamente pela ANOVA não paramétrico, Kruskal-Walis e teste de Dunn para a microdureza e ANOVA e t-student (α=5%) para rugosidade. Resultado: Para microdureza foram encontradas diferenças signiicativas entre os grupos onde houve imersão em clorexidina, antisséptico sem álcool e refrigerante de coca-cola. Para a rugosidade foi observado que a media entre os valores antes e após a imersão nos produtos diferiu estatisticamente em todos os grupos, porém sem diferença entre eles. Conclusão: A microdureza do polimetilmetacrilato foi afetada pela exposição ao gluconato de clorexidina, antisseptico sem álcool e refrigerante à base de coca-cola. A rugosidade da superfície do polimetilmetacrilato foi afetada por todos os produtos estudados. Descritores: Prótese dentária; base de prótese; resina acrílica; enxaguantes bucais.
Abstract
Purpose: To evaluate microhardness and roughness of denture base polymethylmethacrylate resinn exposed to acid
beverages and mouthwashes. Material and method: Rectangular samples (n=80) were prepared from poly (methyl methacrylate) (PMMA). They were divided into 8 groups and had the initial microhardness and Knoop roughness measured. Samples of each group were immersed for 10 min into a test solution (coffee, lemon juice, chlorhexidine gluconate, red wine, cola-based soft drink, vinegar or antiseptic with and without alcohol) and after stored in artificial saliva for 23 h and 50 min, completing a period of 24 h. This procedure was performed for 14 consecutive days and after this period the microhardness and surface roughness measurements were made again. Data were statistically analyzed using ANOVA non parametric, Kruskal-Walis and the Dunn´s test for microhardness and the t-Student and ANOVA for roughness. Result: For microhardness there were found statistically significant differences among the chlorhexidine gluconate solution, antiseptic without alcohol and cola-based soft drink. For roughness was observed that the mean values between the initial period and after immersion in the test products differed statistically in all groups, without difference among groups. Conclusion: The microhardness of poly(methyl methacrylate) was affected by continue exposition to chlorhexidine gluconate, antiseptic without alcohol and cola-based soft drink. The roughness of poly(methyl methacrylate) is negatively influenced by the exposure to all tested products. It may be concluded that both, microhardness and roughness, were affected by the treatments.
Descriptors: Dental prosthesis; denture bases; acrylic resin; mouthwashes.
INTRODUCTION
Aging of population has reached an increasing speed in developing countries. Older people are among the most afected by oral and systemic diseases, with clear impacts on their quality of life. he consequences of accumulation of oral diseases are relected in severe
teeth loss and use of prosthesis don´t always in proper conditions. As a result, esthetic, function, nutrition and self-esteem may be harmed1,2.
teeth. hese dentures are fabricated withacrylic resin, a low cost polymer material based on poly(methyl methacrylate) (PMMA), which is relatively easy to manipulate3. he acrylic resin may be classiied
according to its mode of activation , as chemically-polymerizated (cold-polymerized resins), heat-polymerizated (polymerized using water bath or microwave oven) and light-polymerizated types4.
Bettencourt et al.5 studied acrylic resins and observed that
multiple factors are responsible for their biodegradation, such as the characteristics of saliva, thermal and chemical variations, diet, use of cleansing products, toxic potential of material components and changes in physical and mechanical properties.
he efect in roughness, hardness and color stability of acrylic resin bases when cleaning with diferent mouthwashes has been studied6-9. Mouthwashes are commonly recommended to prevent
bioilm formation and microorganisms colonization3. Some studies
have reported the inluence of immersion in chemical and alcohol-based disinfectants in the physical and lexural strength of acrylic resin10-12. hese researches may propel the need to investigate these
correlations with the denture acrylic resin.
Machado et al.11 showed that when reline resins and denture
base resins are immersed in sodium perborate, an alkaline material, their roughness is signiicantly increased, however, their hardness is not harmed when they are exposed to diferent disinfection cycles in microwave ovens and in 3.8% sodium perborate. Whereas Neppelenbroek et al.13 studying chemical disinfection in water,
3.78% sodium perborate; 4% chlorhexidine gluconate and 1% sodium hypochlorite found that the products negatively afected the hardness of two diferent acrylic resins used for denture bases, however, this efect was reverted ater 15 days storage in water, suggesting to the clinician that dentures should be immersed in water ater the disinfection cycle, to minimize the harmful efects of the procedure. It may occurs because water molecules act as a plasticizer and the low of long-chain polymers can be facilitated. his process is a result of reduce of concentration of residual monomers. Efects of exposure of acrylic resins and relining materials to the oral medium and to foods and beverages consumed by the patient have not yet been extensively studied, in spite of great importance to clinical practice3,10,14. he alteration in dimensional stability of
denture base resins may indicate aging or damage to the material, which may occur due to the ingestion of acid beverages (pH< 5), which in contact with stock artiicial teeth or acrylic resin, denture bases may compromise their properties, in addition to favoring bacterial bioilm adhesion to their surfaces10.
he aim of this study was to evaluate the efect of acid beverages and mouthwashes on the microhardness and roughness of denture base acrylic resin. he tested hypothesis would be that the low pH and use of alcohol-based mouthwashes may adversely afect the roughness and hardness of denture acrylic resin.
MATERIAL AND METHOD
Pink acrylic resin (Jet, Clássico, Sao Paulo, SP, Brazil) were manipulated in proportion 3:1 (powder/liquid) and immediately included into silicone molds until polymerization (n=80), resulting in rectangular samples with dimensions of 2.5 × 5.0 × 1.0 cm. he
samples were embedded in transparent acrylic resin (Jet), using a cylinder-shaped silicone matrix, to facilitate the polishing procedures and microhardness and roughness measurements.
he samples were polished (Pantec Polipan 2, Panambra, Sao Paulo, SP, Bazil) with a sequence of water abrasive papers (#600, #800, #1.200 and a felt disc). Ater this, the samples were randomly divided into eight experimental groups:
GCof: Instant cofee (Nescafe, Nestle, Araras, SP, Brazil) – prepared according to manufacturer´s instruction.
GJui: Light artiicial juice powder, lemon lavored (Clight, Mondelez , SP, Brazil) – prepared according to manufacturer´s instruction;
GChl: 0.12% Chlorhexidine gluconate (PerioGard, Colgate-Palmolive, Sao Paulo, SP, Brazil);
GWine: Red table wine (San Tomé, Alberto Belesso, Itupeva, SP, Brazil);
GCola: Cola-based sot drink (Coca-Cola; FEMSA, Jacarei,
SP, Brazil);
GVin: White wine vinegar (Castelo, Castelo Foods, Jundiai, SP, Brazil);
GAnt: Oral antiseptic with luoride, mint lavored, without alcohol (Colgate Plax Sot Milk, Colgate-Palmolive, SP, Sao Paulo, Brazil);
GAntAlc: Oral antiseptic mint lavored, with alcohol (Listerine, Johnson & Johnson, Sao Paulo, SP, Brazil).
Before the test samples immersion in the solutions the initial Knoop microhardness and roughness measurements were made. Ater, the test samples of each group were immersed in the respective products for 10 min and stored in artiicial saliva for 23 h and 50 min, completing a period of 24 h. his procedure was performed for 14 consecutive days, and ater this period the inal microhardness and surface roughness measurements were made.
A microdurometer (FM 700, FutureTech corp., Tokyo, Japan) was used itted with an indenter using a 100gf and dwell time of 10 sec, coupled to a microcomputer and a speciic sotware program to analyze the images (Cams – Win – New Age Industries,USA). All the samples were demarcated, dividing them into quadrants, for determination and standardization of the readout locations.
During the test, the microdurometer activated a pyramid-shaped diamond penetrator tip under a vertical static load of 100 gf/10 sec and the readout was made with an objective at 10X magniication. When activated, the penetrator performed a compression on the sample surface, generating a diamond-shaped geometric form. he microdurometer made the calculations automatically.
surfaces with a distance of 2 mm between each measurement. For each sample, a mean value was obtained from three measurements, and aterwards the average was obtained for each group.
he results of microhardness were analyzed with Kruskal-Wallis non parametric ANOVA and Dun Test, and the results of roughness was submitted to one-way ANOVA and Student-t test for paired samples (p<0.05) .
RESULT
Microhardness
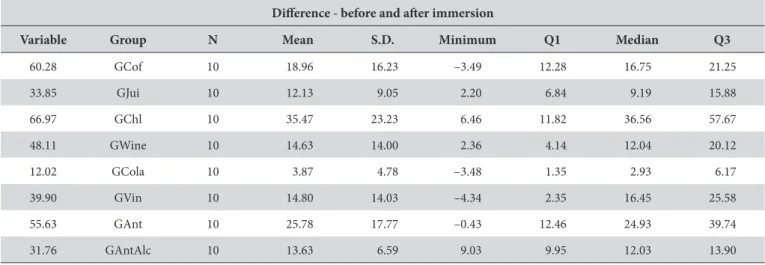
To evaluate the microhardness results the Kruskal-Wallis non parametric ANOVA test was used. he analysis showed statistically signiicant diferences on the microhardness values (P = 0.0017 < 0.05). he cola-based sot drink group (Group GCola) showed the lower alteration on the microhardness surface (Table 1).
Statistically significant different was found between the experimental groups, and ater this Dunn’s test was applied to locate where the diference occurred (Table 2).
In Dunn’s test diference was observed between the Groups chlorhexidine and antiseptic without alcohol, and the Group cola-based sot drink, with the other groups presenting intermediate values. Greater alteration in microhardness when chlorhexidine and the antiseptic without alcohol were used.
Roughness
Table 3 shows the comparison of the roughness condition in the immediate period and ater solution immersion and the interval of conidence (IC: 95%) in the comparison on the mean roughness values (Ra) of beverages for all experimental groups, resulting from the Student’s-t test for paired samples (df = 9), α = 5%. here were signiicative diferences between the periods (imediate and ater immersion) for all groups, but there was no signiicative diferences between the groups in both periods.
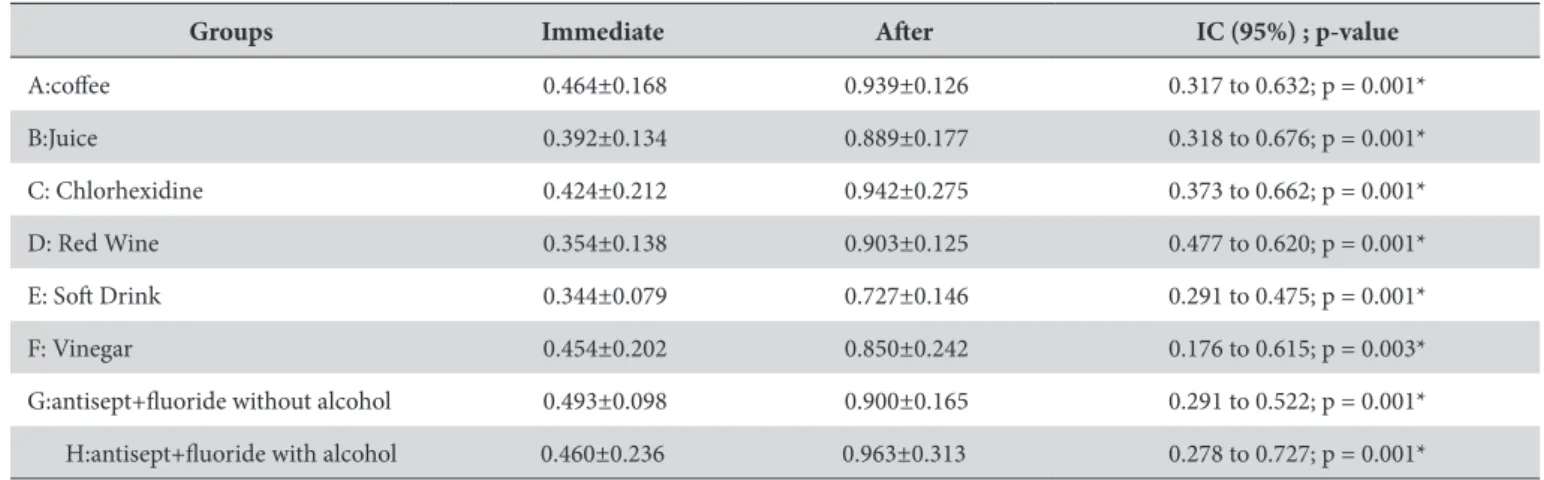
Table 4 shows the comparison of the roughness condition in the immediate period and ater immersion, according to the type of test product. Interval of Conidence (IC: 95%) in the comparison on the mean roughness values (Rz) of beverages for all experimental groups, resulting from the Student’s-t test for paired samples (df = 9), α = 5%.
In the period ater immersion there was an increase in roughness in comparison with the initial period (Tables 3 and 4). he mean values of the periods difered statistically both for Ra and Rz, in each of the groups.
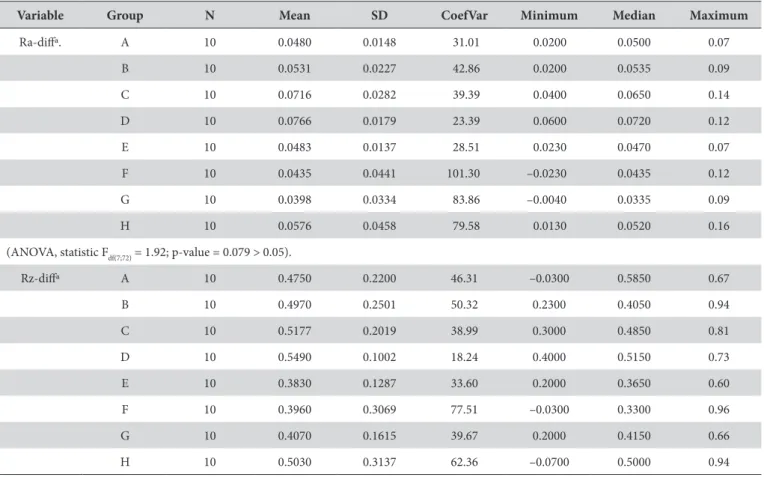
For comparison among the groups with respect to the initial diference and ater immersion in the test products the one-way ANOVA was applied (Table 5), and the results for the Ra values and for the Rz values showed no diference between the values or between the groups.
DISCUSSION
In this in vitro study it was observed that 0.12% chlorhexidine gluconate and mint lavored oral antiseptic without alcohol showed the greatest diferences between initial microhardness and ater solution submersion for 14 days, characterizing a harmful efect and a decrease on microhardness values. Asad et al.12 used 2%
glutaraldehyde, 0.5%, chlorhexidine and a disinfectant solution with alcohol on acrylic resin for 24 h, showing no signiicant change in the values; however, signiicant alteration was observed ater immersion for 7 days,. According to authors, the alteration may have occurred due to the absorption of chemical products by the acrylic resin, resulting in a structural change of the polymer. In addition, the water re-immersion increased the microhardness, suggesting a structural reorganization in the polymer changed by the solution immersion.
In this study it was observed that all solutions promoted alteration in the acrylic resin microhardness; However, statistically signiicant values were only found between the Groups 0.12% chlorhexidine and the disinfectant solution without alcohol in comparison with the cola-based sot drink group (Table 2), whereas the other groups
Table 1. Mean, standard deviation and median of the microhardness values of the denture base acrylic resin - ANOVA
Diference - before and ater immersion
Variable Group N Mean S.D. Minimum Q1 Median Q3
60.28 GCof 10 18.96 16.23 –3.49 12.28 16.75 21.25
33.85 GJui 10 12.13 9.05 2.20 6.84 9.19 15.88
66.97 GChl 10 35.47 23.23 6.46 11.82 36.56 57.67
48.11 GWine 10 14.63 14.00 2.36 4.14 12.04 20.12
12.02 GCola 10 3.87 4.78 –3.48 1.35 2.93 6.17
39.90 GVin 10 14.80 14.03 –4.34 2.35 16.45 25.58
55.63 GAnt 10 25.78 17.77 –0.43 12.46 24.93 39.74
31.76 GAntAlc 10 13.63 6.59 9.03 9.95 12.03 13.90
had intermediate values. here was greater change in microhardness when using the chlorhexidine and antiseptic without alcohol.
Similary to Asad et al.12, absorption of the solutions by the acrylic
resin may have occurred in this study, resulting in diferent levels of sotening by the diferent solutions. In addition, the exposure time of 10 min in the solutions and the storage in artiicial saliva for 23 h and 50 min, completing a period of 24 h for 14 days is a factor inluencing the results. he exposure time recommended
by the manufacturers is from 10 to 30 min, which was extended to 14 days simulating a continuous period of use12.
Acrylic resin denture bases may also undergo alterations in hardness and roughness as a result of the action of foods and beverages, disinfectants, saliva, surface texture and porosities resulting from the laboratory procedure, in addition to the time of use15.
During acrylic resin polymerization, the residual monomer may act as resin plasticizer, changing the properties of the acrylic resin. Storage in water or artiicial saliva is another factor triggering alterations, and could interfere in the properties of denture base materials, due to the absorption of water with consequent alteration in the material8,14. When the surface microhardness was evaluated
in this study, it was veriied that chlorhexidine and disinfectant without alcohol produced the greatest alterations in the acrylic resin. Similar behavior was observed for roughness.
When acrylic resin roughness was evaluated in the diferent groups there was diference between the initial period and immersion in the solution for 10 min/14 days. his diference remained constant among the groups and no statistically signiicance diference was found among them. Azevedo et al.8, submitted the samples for 7 days
in disinfectants solutions, and Ural et al.14, immersed samples for
a week (5 hours/day). Both studies shown small or no signiicant changes in roughness between the periods of evaluation when test
Table 4. Comparison of the mean roughness condition (Rz) in the immediate period and ater immersion in the test products for all the experimental groups, resulting from the Student’s-t test for paired samples
Groups Immediate Ater IC (95%) ; p-value
A:cofee 0.464±0.168 0.939±0.126 0.317 to 0.632; p = 0.001*
B:Juice 0.392±0.134 0.889±0.177 0.318 to 0.676; p = 0.001*
C: Chlorhexidine 0.424±0.212 0.942±0.275 0.373 to 0.662; p = 0.001*
D: Red Wine 0.354±0.138 0.903±0.125 0.477 to 0.620; p = 0.001*
E: Sot Drink 0.344±0.079 0.727±0.146 0.291 to 0.475; p = 0.001*
F: Vinegar 0.454±0.202 0.850±0.242 0.176 to 0.615; p = 0.003*
G:antisept+luoride without alcohol 0.493±0.098 0.900±0.165 0.291 to 0.522; p = 0.001*
H:antisept+luoride with alcohol 0.460±0.236 0.963±0.313 0.278 to 0.727; p = 0.001*
*p<0.05.
Table 3. Comparison of the mean roughness (Ra), resulting from the Student’s-t test for paired samples (df=9), α = 5%
Groups Immediate Ater IC (95%) ; p-value
A:Cofee 0.054±0.008 0.102±0.011 0.037 to 0.058; p = 0.001*
B: Juice 0.051±0.015 0.104±0.017 0.036 to 0.069; p = 0.001*
C: Chlorhexidine 0.054±0.011 0.126±0.036 0.051 to 0.092; p = 0.001*
D: Red Wine 0.043±0.001 0.120±0.019 0.063 to 0.089; p = 0.001*
E: Sot Drink 0.044±0.011 0.093±0.016 0.038 to 0.058; p = 0.001*
F: Vinegar 0.058±0.021 0.102±0.038 0.012 to 0.075; p = 0.012*
G: antisept+luoride without alcohol 0.072±0.027 0.111±0.037 0.016 to 0.063; p = 0.004*
H: antisept+luoride with alcohol 0.063±0.034 0.121±0.066 0.025 to 0.090; p = 0.003*
*p<0.05.
Table 2. Diference in microhardness among Groups – Dunn’s test (5%)
Group Mean Homogeneous
C 59.000 A
G 53.500 A
A 47.900 A B
F 38.700 A B
H 38.700 A B
D 37.000 A B
B 33.400 A B
the efects of disinfectants in denture base resin and relining resins. he diferences among the indings may occur due to solutions types , diferent brands of denture base materials, exposure times and equipment used for evaluation.
Jin et al.16 evaluating denture relining materials (sot denture
lining) observed diferences between the commercial brands, with severe changes in roughness. Its known that cleanser products like toothbrushes and toothpastes cause denture base surface abrasion, but there are no suicient researches about the inluence of mouthwashes on its surface16. Regis et al.17 veriied the efects of
diferent alcohol concentrations in roughness and microhardness of denture base materials. hey found alteration in these properties, difering from the indings of the current study, in which it was veriied that the results for disinfectant with alcohol and red wine did not difer statistically from the other groups, and that chlorhexidine
and disinfectant without alcohol were the solutions most harmful for microhardness.
Considering that the roughness of dentures facilitates bacterial activity and may cause traumas to the sot tissues18, leading to
stomatitis or other types of lesions and contributing to tissue injuries, the maintenance of surface smoothness is important for the good hygiene of denture bases and oral health.
CONCLUSION
• he greatest diference in microhardness occurred in the groups of chlorhexidine and antiseptic without alcohol, and the lowest diference in the cola-based sot drink;
• here was an increase in roughness between the initial period and ater submersion of test specimens in the test products; and • here was no diference in roughness among the groups. Table 5. Descriptive statistics for Ra corresponding to diference in the values of the groups
Variable Group N Mean SD CoefVar Minimum Median Maximum
Ra-difª. A 10 0.0480 0.0148 31.01 0.0200 0.0500 0.07
B 10 0.0531 0.0227 42.86 0.0200 0.0535 0.09
C 10 0.0716 0.0282 39.39 0.0400 0.0650 0.14
D 10 0.0766 0.0179 23.39 0.0600 0.0720 0.12
E 10 0.0483 0.0137 28.51 0.0230 0.0470 0.07
F 10 0.0435 0.0441 101.30 –0.0230 0.0435 0.12
G 10 0.0398 0.0334 83.86 –0.0040 0.0335 0.09
H 10 0.0576 0.0458 79.58 0.0130 0.0520 0.16
(ANOVA, statistic Fdf(7;72) = 1.92; p-value = 0.079 > 0.05).
Rz-difª A 10 0.4750 0.2200 46.31 –0.0300 0.5850 0.67
B 10 0.4970 0.2501 50.32 0.2300 0.4050 0.94
C 10 0.5177 0.2019 38.99 0.3000 0.4850 0.81
D 10 0.5490 0.1002 18.24 0.4000 0.5150 0.73
E 10 0.3830 0.1287 33.60 0.2000 0.3650 0.60
F 10 0.3960 0.3069 77.51 –0.0300 0.3300 0.96
G 10 0.4070 0.1615 39.67 0.2000 0.4150 0.66
H 10 0.5030 0.3137 62.36 –0.0700 0.5000 0.94
(ANOVA, statistic Fdf(7;72) = 0.78; p-value = 0.606 > 0.05).
REFERENCES
1. Tsakos G, Watt RG, Rouxel PL, de Oliveira C, Demakakos P. Tooth loss associated with physical and cognitive decline in older adults. J Am Geriatr Soc. 2015 Jan;63(1):91-9. http://dx.doi.org/10.1111/jgs.13190. PMid:25523131
2. McKenzie-Green B, Giddings LS, Buttle L, Tahana K. Older peoples’ perceptions of oral health: ‘it’s just not that simple’. Int J Dent Hyg. 2009 Feb;7(1):31-8. http://dx.doi.org/10.1111/j.1601-5037.2008.00328.x. PMid:19215309
4. Sepúlveda-Navarro WF, Arana-Correa BE, Borges CP, Jorge JH, Urban VM, Campanha NH. Color stability of resins and nylon as denture base material in beverages. J Prosthodont. 2011 Dec;20(8):632-8. http://dx.doi.org/10.1111/j.1532-849X.2011.00791.x. PMid:22040527 5. Bettencourt AF, Neves CB, Almeida MS, Pinheiro LM, Oliveira SA, Lopes LP, et al. Biodegradation of acrylic based resins: a review. Dent
Mater. 2010 May;26(5):e171-80. http://dx.doi.org/10.1016/j.dental.2010.01.006. PMid:20189238
6. Hersek N, Canay S, Uzun G, Yildiz F. Color stability of denture base acrylic resins in three food colorants. J Prosthet Dent. 1999 Apr;81(4):375-9. http://dx.doi.org/10.1016/S0022-3913(99)80001-8. PMid:10095204
7. Rodrigues Garcia RC, Joane Augusto S Jr, Rached RN, Del Bel Cury AA. Effect of denture cleansers on the surface roughness and hardness of a microwave-cured acrylic resin and dental alloys. J Prosthodont. 2004 Sept;13(3):173-8. http://dx.doi.org/10.1111/j.1532-849X.2004.04028.x. PMid:15345017
8. Azevedo A, Machado AL, Vergani CE, Giampaolo ET, Pavarina AC, Magnani R. Effect of disinfectants on the hardness and roughness of reline acrylic resins. J Prosthodont. 2006 July-Aug;15(4):235-42. http://dx.doi.org/10.1111/j.1532-849X.2006.00112.x. PMid:16827736 9. Al-Huraishi H, Moran J, Jagger R, MacDonald E. Evaluation of stain removal and inhibition properties of eight denture cleansers: an in vitro
study. Gerodontology. 2013 Mar;30(1):10-7. http://dx.doi.org/10.1111/j.1741-2358.2011.00522.x. PMid:23088443
10. Pavarina AC, Vergani CE, Machado AL, Giampaolo ET, Teraoka MT. The effect of disinfectant solutions on the hardness of acrylic resin denture teeth. J Oral Rehabil. 2003 July;30(7):749-52. http://dx.doi.org/10.1046/j.1365-2842.2003.01145.x. PMid:12791163
11. Machado AL, Breeding LC, Vergani CE, da Cruz Perez LE. Hardness and surface roughness of reline and denture base acrylic resins after repeated disinfection procedures. J Prosthet Dent. 2009 Aug;102(2):115-22. http://dx.doi.org/10.1016/S0022-3913(09)60120-7. PMid:19643225 12. Asad T, Watkinson AC, Huggett R. The effects of various disinfectant solutions on the surface hardness of an acrylic resin denture base
material. Int J Prosthodont. 1993 Jan-Feb;6(1):9-12. PMid:8507335.
13. Neppelenbroek KH, Pavarina AC, Vergani CE, Giampaolo ET. Hardness of heat-polymerized acrylic resins after disinfection and long-term water immersion. J Prosthet Dent. 2005 Feb;93(2):171-6. http://dx.doi.org/10.1016/j.prosdent.2004.10.020. PMid:15674229
14. Ural C, Sanal FA, Cengiz S. Effect of different denture cleansers on surface roughness of denture base materials. Clin Dent Res. 2011; 5(2):14-20. 15. Žilinskas J, Junevičius J, Česaitis K, Junevičiūtė G. The effect of cleaning substances on the surface of denture base material. Med Sci Monit.
2013;19:1142-5. http://dx.doi.org/10.12659/MSM.889568. PMid:24326781
16. Jin C, Nikawa H, Makihira S, Hamada T, Furukawa M, Murata H. Changes in surface roughness and colour stability of soft denture lining materials caused by denture cleansers. J Oral Rehabil. 2003 Feb;30(2):125-30. http://dx.doi.org/10.1046/j.1365-2842.2003.01014.x. PMid:12535137
17. Regis RR, Soriani NC, Azevedo AM, Silva-Lovato CH, Paranhos HF, Souza RF. Effects of ethanol on the surface and bulk properties of a microwave-processed PMMA denture base resin. J Prosthodont. 2009 Aug;18(6):489-95.; June 3, 2009. http://dx.doi.org/10.1111/j.1532-849X.2009.00475.x. PMid:19500235
18. Williams DW, Lewis MA. Isolation and identification of Candida from the oral cavity. Oral Dis. 2000 Jan;6(1):3-11. http://dx.doi. org/10.1111/j.1601-0825.2000.tb00314.x. PMid:10673781
CONFLICTS OF INTERESTS
he authors declare no conlicts of interest.
*CORRESPONDING AUTHOR
Fernanda Alves Feitosa, Departmento de Odontologia Restauradora, Instituto de Ciência e Tecnologia, UNESP – Univ Estadual Paulista, Avenida Engenheiro Francisco José Longo, 777, Jardim São Dimas, 12245-000 São José dos Campos - SP, Brazil, e-mail: [email protected]