81
Factors influencing
Serrapinnus notomelas
(Characiformes: Characidae)
populations in upper Paraná river floodplain lagoons
Pitágoras Augusto Piana*, Luiz Carlos Gomes**, and Elimaida Mayo Cortez**
Identification of variables that influence fish populations is one of the main challenges in ecology. To explore this, data were collected quarterly from February 2000 to November 2001 using seines, along the shore of four isolated lagoons of the upper Paraná River floodplain. Serrapinnus notomelas was selected to assess the effect of abiotic and biotic variables using indirect gradient analysis. Abiotic variables were summarized by principal components analysis (PCA) and then the scores of the axis retained for interpretation were correlated with abundances of S. notomelas. Variables that best explained S. notomelas
abundance were surface area of the lagoon, total suspended solids and Secchi depth (these last two, indirectly linked to predation). The most relevant biotic variable that determined population size of S. notomelas was predation.
A identificação das variáveis que influenciam nas densidades populacionais de peixes é um dos principais desafios em ecologia. Para explorar isto, assembléias de peixes foram amostradas trimestralmente de fevereiro de 2000 a novembro de 2001 com auxílio de redes de arrasto, operadas nas regiões marginais de quatro lagoas isoladas da planície de inundação do alto rio Paraná. Serrapinnus notomelas
foi selecionada para avaliar o efeito de variáveis abióticas e bióticas através de análise indireta de gradientes. Variáveis abióticas foram sumarizadas numa análise de componentes principais (ACP) e os escores dos eixos retidos para interpretação foram então correlacionados com as abundâncias de S. notomelas. Área de superfície da lagoa, sólidos totais em suspensão e profundidade do disco de Secchi foram as variáveis que melhor explicaram a abundância de S. notomelas. Além disto, a predação, que é influenciada pela transparência da água, foi a interação biótica que apresentou maior relevância na determinação do tamanho populacional desta espécie.
Key words: population regulation, abiotic variables, competition, predation.
* Graduate Course in Inland Aquatic Environments. Department of Biology, Maringá State University. e-mail: pitapiana@yahoo.com.br ** Nucleus of Research in Limnology, Ichthyology and Aquaculture (Nupelia), Department of Biology, Maringa State University. Avenida Colombo 5790, 87020-900 Maringá, PR, Brazil.
Introduction
Populations show variations in abundance as an adaptive response to changes in chemical, physical and biological char-acteristics of habitats (Pimm, 1991). In order to be regulated by any factor, a population should present: i) persistence, ii) abundance fluctuation threshold and, iii) tendency to return to a balance density (Hixon et al., 2002). Identification of the main factors involved in population regulation and the mecha-nisms acting is a great challenge of ecology. Regulation may be due to natural environment variability that affects birth and death rates. Then, populations are subjected to random fluctuations and therefore, susceptible to extinction.
A population in ideal conditions tends to grow geometri-cally. However, in natural environments, population growth may be limited by several variables and/or events (here named factors). Malthus and Darwin attributed to competition the primary effects on population regulation, in spite of possible effects of predation. The mechanism that would cause a
crease in population growth rate by competition (density de-pendent) was explained by Verhulst in 1838 (sensu Gotelli, 2001) in the logistic equation. This equation defines a maximum limit for abundance of a given population, which depends on the carrying capacity. In a closed population, regulatory growth factors act directly on birth and death rates because there are no migrations. In such cases, factors acting under depen-dence of population density, such as predation and competi-tion, are potentially sources of control (Hixon et al., 2002).
In general, abiotic and biotic factors affect population densities of species belonging to different trophic levels. However, the relative contribution of these factors to each trophic level may, possibly, be differentiated. Therefore, in this work, we attempt to identify possible regulatory mecha-nisms for the population density of Serrapinnus notomelas
(Luiz et al., 1997). These characteristics prompt fast responses of the species to habitat variations concerning chemical, physi-cal and biologiphysi-cal factors. Thus, population growth can be studied in temporal scales compatible with the life cycle of a species. In this paper, we evaluate spatial and temporal varia-tions in the abundance of S. notomelas populations from four lagoons (all isolated) of the upper Paraná River flood-plain, in a period during which no flood occurred (closed populations). Specifically, we try to answer the following question: what is (are) the main factor(s) (abiotic: physical or chemical?; biotic: competition or predation?) that regulates abundance of S. notomelas populations in these lagoons?
Material and Methods
Study Area. The Paraná River is the tenth largest of the world in discharge, and the fourth in drainage area (5.0 x 10⁸ m3/
year; 2.8 x 10⁶ km2, respectively). It drains most of the
central-southern part of South America, from the Andes to the Serra do Mar near the Atlantic Ocean.
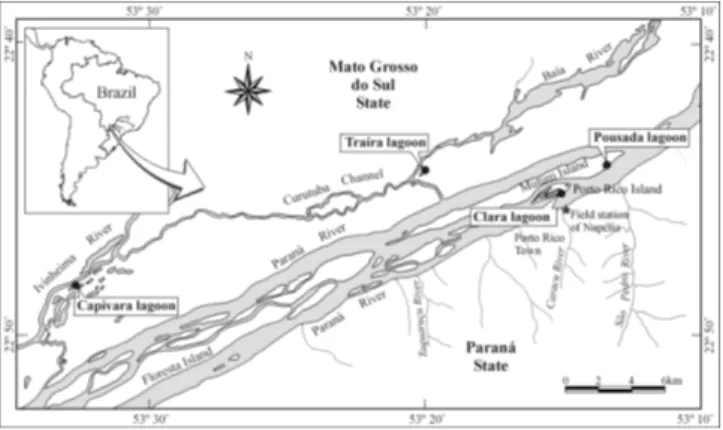
The studied area corresponds to the upper third of the Paraná River (Bonetto, 1986) (Fig. 1). In this stretch, the last one inside Brazilian territory free of dams, there is an exten-sive floodplain on the west margin. This floodplain supports a great diversity of organisms (Agostinho et al., 2000). Main impacts in the region are high biocide loads and pollution from domestic and agricultural activities, deforestation of ri-parian vegetation and, the most conspicuous, construction of dams. Dams have altered the natural water regime (floods) and removed portions of floodplains in the upper Paraná River basin. The remaining floodplain is a mosaic of habitats, with several canals and lagoons (connected or isolated). Isolated lagoons are heterogeneous in surface area, depth, distance from the main river, macrophyte cover and other features (Table 1).
Sampling. Fish samplings were carried out with seines (20 m long; mesh size 0.8 cm opposite knots), in shore areas of the four isolated lagoons of the upper Paraná River floodplain, operated quarterly from February 2000 to November 2001 (in this period, there was no flood). All captured individuals were taken to the laboratory, where they were counted and measured (total and
standard length). Abundances in the lagoons were expressed in number of individuals/100 m2 of seined area.
Chemical [dissolved oxygen (mg/l), total phosphorus (µg/ l), dissolved phosphorus (µg/l), orto-phosphate (µg/l), ni-trate (µg/l), nitrite (µg/l), ammonia (µg/l), dissolved organic carbon (ppm), alkalinity (µeq/l), conductivity (µS/cm), chlo-rophyll-a (µg/l) and (pH)] and physical characteristics [area of the lagoon (ha), depth (m), turbidity (FTU), temperature (oC), Secchi disk depth (cm), total suspended solids (mg/l)] of
the lagoons, here denominated abiotic variables, were col-lected simultaneously and analyzed, later, by the physico-chemical laboratory of the Nucleus of Research in Limnol-ogy, Ichthyology and Aquaculture - Nupelia.
Data Analyses. To identify the most important physical and chemical variables that could be influencing populations of
S. notomelas, we adopted a multivariate approach (Gauch, 1986). We first summarized data in two principal components analysis (PCA), one for chemical and another for physical variables (data were Log10 transformed in order to linearize relationships) using the software PC-ORD (McCune & Mefford, 1997). The Broken Stick model was used as criteria to retain PCA axis for interpretation (Jackson, 1993). Scores of the axis retained for interpretation were correlated against abundance of S. notomelas [if not linear, abundance was Log10(x+1) transformed]. In case of significant correlations (P < 0.05), it is assumed that the variables with larger eigenvectors (coefficients of structure or correlations) for the axis are the ones that most influenced the abundance of the species.
In order to evaluate the effect of the biotic variables (com-petition and predation) on the populations of S. notomelas
(voucher specimens deposited in the Museu de Ictiologia of Nupélia under the code NUP3210), abundance of fish species that are potentially competitors (Apareiodon affinis - voucher specimens code in Nupelia: NUP349, Astyanax altiparanae: NUP322, Aphyocharax anisitsi: NUP358, Astyanax fasciatus: NUP322, Aphyocharax sp.: NUP3225, Astyanax schubarti: NUP34, Brachyhypopomus cf. pinnicaudatus: NUP2510, Bryconamericus stramineus: NUP343, Characidium aff. ze-bra: NUP348, Crenicichla britskii: NUP345, Characidium
sp.: NUP2352, Cyphocharax modestus: NUP3290, Cypho-charax nagelii: NUP431, Gymnotus spp.: NUP3166, Hyphe-ssobrycon eques: NUP1503, Hoplosternum litoralle: NUP334, Hemigrammus marginatus: NUP392, Laetacara sp.: NUP352, Table 1. Physical characteristics of the lagoons sampled in the upper Paraná River floodplain.
Lagoons
Characteristic Capivara Traíra Pousada Clara
Mean depth (m) 3.6 2.1 0.40 1.2
Length (m) 750 110 860 360
Perimeter (m) 1700 290 2908 780
Area (ha) 7.2 0.47 12.7 0.91 Distance from the
main river (m) 80 350 100 15 Fig. 1. Map of the upper Paraná River floodplain showing the
Liposarcus anisitsi: NUP1529, Leporinus sp.: NUP763, Leporinus lacustris: NUP338, Leporinus obtusidens: NUP275, Loricariichthys platymetopom: NUP445, Metynnis maculatus: NUP443, Moenkhausia intermedia: NUP57, Moenkhausia sanctaefilomenae: NUP346, Odontostilbe sp.: NUP1517, Pyrrhulina australis: NUP344, Pimelodella sp. 1: NUP3455, Prochilodus lineatus: NUP330, Pimelodus maculatus: NUP320, Roeboides paranensis: NUP351, Schizodon borellii: NUP435, Steindachnerina brevipinna: NUP3179, Serrapinnus sp. 1: NUP3283, Serrapinnus sp. 2: NUP3455, Steindachnerina insculpta: NUP339, Sternopygus macrurus: NUP2096, Synbranchus marmoratus: NUP320, Satanoperca pappaterra: NUP422) were added and, then, scatterplots made to evaluate the kind of the relationship. Similarly, abundances of all fish species with potential to feed on S. notomelas (predators: Acestrorhynchus lacustris
(voucher specimens code in Nupelia: NUP4), Astronotus crassipinnis (voucher specimens code in Nupelia: NUP3449), Cichla monoculus (voucher specimens code in Nupelia: NUP412), Cichlasoma paranaense (voucher specimens code in Nupelia: NUP109), Hoplias malabaricus (voucher speci-mens code in Nupelia: NUP265), Hoplerythrinus unitaeniatus
(voucher specimens code in Nupelia: NUP61)e Serrassalmus marginatus (voucher specimens code in Nupelia: NUP395)) were also added and compared graphically with its density. For both group formations, we used data on diet composition
(Agostinho et al., 1997; Hahn et al., 1997, 2004; Luiz et al., 1998; Silva, 2002). Then, tendencies of the scatterplots were observed and, when possible, regression models were ad-justed (linear or non-linear) to explain the relationship.
Results
Spatial and Temporal Variations in Abundance. In the period of study (February 2000 to November 2001), 68 fish species were captured, and S. notomelas was among the dominant species with great abundance, especially in Clara and Pousada lagoons, where densities increased over time, but with high variability in the end of the study. In Traíra and Capivara lagoons, for in-stance, densities decreased over time (Figs. 2a-d).
Influence of Abiotic Variables. Abiotic variables were sum-marized through principal components analysis (PCA) and the axes retained for interpretation were correlated against the abundance of S. notomelas.
For the PCA applied to chemical variables, four axis were retained for interpretation (they presented eigenvalues greater than the Broken-Stick eigenvalues) and together they explained almost 60% of total data variability. Eigenvectors (structure co-efficients or correlations) demonstrate the variables that more contributed to formation of an axis and, consequently, in the ordination. For axis 1 (PC1), these variables were dissolved
phos-Figs. 2a-d. Temporal variation in the abundance of Serrapinnus notomelas in lagoons Capivara (a), Clara (b), Pousada (c) and Traíra (d).
Density (individuals/100 m
2)
)
a
Feb /0 0 M a y/00
A ug /0 0 No v/00
Fe b/01 M a y/0 1
Aug/01 Oct/0 1
0 100 200 300 400 500 600
b
Feb /00 M a y/00
A ug /0 0 Nov/0 0
Fe b/0 1 M ay/0 1
Au g/01 Oct/ 0 1
0 200 400 600 800 1000 1200 1400
c
Feb /0 0 M a y/00
A ug /0 0 No v/00
Fe b/01 M a y/0 1
Aug/01 Oct/0 1
0 1000 2000 3000 4000 5000 6000 7000
d
Feb /00 M a y/00
A ug /0 0 Nov/0 0
Fe b/0 1 M ay/0 1
Au g/01 Oct/ 0 1
Table 2. Results of principal components analysis (PCA) ap-plied for chemical variables.
Variables Axis 1 Axis 2 Axis 3 Axis 4
Eigenvalues (explanation %)
3.198 (24.5)
3.006 (23.1)
2.497 (19.2)
1.680 (12.9)
Broken-Stick eigenvalues 3.180 2.180 1.680 1.347
pH 0.032 0.286 -0.102 0.576
Conductivity -0.220 0.320 0.384 0.123
Alkalinity -0.111 0.136 0.523 0.014
Dissolved oxygen 0.166 0.135 -0.475 0.126
Chlorophyll-a -0.218 -0.410 0.148 0.161
Nitrite 0.076 0.002 -0.362 -0.482
Nitrate -0.238 -0.440 -0.069 0.247
Ammonia -0.269 -0.452 -0.065 0.046
Total nitrogen -0.094 0.164 -0.209 0.361
Total phosphorus -0.372 0.294 -0.009 -0.331
Dissolved phosphorus -0.470 0.224 -0.053 -0.166
Orto-phosphate -0.466 -0.095 -0.169 -0.089
Dissolved organic carbon -0.380 0.202 -0.326 0.201
Fig. 3. Scatterplot of the abundance of Serrapinnus noto-melas and the scores of axis 1 of the principal components analysis (PCA) that summarized physical variables. Variables that more contributed to formation of the axis (arrows) are also given. TSS = Total suspended solids.
Table 3. Results of principal components analysis (PCA) ap-plied for physical variables.
Variables Axis 1 Axis 2
Eigenvalues (explanation %) 2.577 (43.0) 1.233 (20.5)
Broken-Stick eigenvalues 2.450 1.150
Area -0.482 -0.345
Lagoon depth 0.348 0.142
Temperature 0.248 -0.689
Secchi depth 0.485 0.109
Turbidity -0.375 0.560
Total suspended solids -0.457 -0.245
phorus and orto-phosphate, both negatively. For PC2, conduc-tivity showed positive correlation, whereas ammonia, nitrate and chlorophyll-a presented negative correlations. For PC3, alkalin-ity presented the larger positive correlation and dissolved oxy-gen the most negative. Finally, for PC4, pH was more correlated positively, whereas nitrite more negatively (Table 2).
For physical variables the first two PCA axes were retained for interpretation, based on the Broken Stick model. They to-gether explained 63.5% of the total variability of the data ma-trix. Great eigenvectors were, for axis 1, Secchi depth (posi-tively) and area of the lagoon and total suspended solids tively). For axis 2, turbidity (positive) and temperature (nega-tive) were the variables with greater correlations (Table 3).
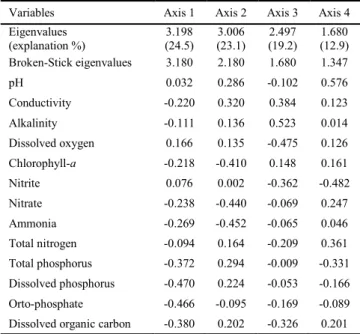
Scores of the axes retained for interpretation were gener-ated and plotted against abundances of S. notomelas [trans-formed in Log(x+1)]. Only scores of the axis 1 of the PCA that summarized physical variables presented significant Pearson correlation (r = -0.46; P < 0.05) with the abundance of the species (Table 4). Therefore, it can be inferred that, for the
studied lagoons, abiotic factors that more influenced abun-dance of S. notomelas were the area of the lagoon, total sus-pended solids and Secchi depth (Table 4 and Fig. 3).
Influence of Biotic Variables. Relationship between abundance of S. notomelas and abundance of its competitors was positive (Fig. 4a). A quadratic model with significant parameters (P < 0.05) accounted for 93% of variation in S. notomelas populations. For piscivores species, as larger their abundance, lower the densities of S. notomelas (Fig. 4b). However it was neither possible to adjust a model to explain this relationship, nor explain it due to a significant correlation (Spearman: r = -0.10, P = 0.65).
Discussion
High abundances of S. notomelas in isolated lagoons of the upper Paraná River, as well as of other small bodied species is in part due to their opportunistic life strategy (sensu Winemiller, 1989), i.e., they present multiple spawning and mature quickly.
All variables considered in this study, i.e., abiotic vari-ables, competition and predation, may somehow affect, di-rectly or indidi-rectly, fish populations (Matthews, 1998; Hixon
et al., 2002). In the upper Paraná River floodplain, the flood pulse promotes homogenization of abiotic variables (Thomaz
et al., 1992, 1997; Agostinho et al., 2000). With the end of the flood, lagoons are isolated and, every one of them, depend-ing on their physiography, present characteristic values of abiotic variables. As time increases since inundation, these variables become more restrictive and, therefore, may deter-mine composition and structure of fish assemblages.
Abundance of S. notomelas was greater in lagoons with larger surface area and with greater loads of total suspended solids (Pousada lagoon) and, it was lower in lagoons with smaller values of these variables and greater Secchi depth,
i.e., cleaner waters (Traíra lagoon, for instance). These re-sults are biologically relevant because larger environments usually present larger heterogeneity of habitats that can
sup-S . n otom ela s abun dan ce (lo g10(x +1 ))
P
-1 0 1 2 3 4 5 6
-5 -4 -3 -2 -1 0 1 2 3
Area TSS Secchi
r = -0.46 P = 0.03
port more species and greater abundances (Krebs, 1994). The other two variables that apparently influenced S. no-tomelas populations work antagonistically, i.e., when total suspended solids is high, Secchi depth is low, resulting in darker water and hindering predation (Matthews, 1998). Okada
et al. (2003) identified that the amount of piscivores fishes in a lagoon is an important variable determining structure of fish assemblages. Thus it is possible that predators find dif-ficulties to prey when Secchi depth is low.
These findings differ slightly from others presented in the literature. In the review of Jackson et al. (2001), the most impor-tant variables structuring fish assemblages were pH and dis-solved oxygen. It is reasonable to consider that the scale of their study was regional and they considered all species. For this study, the scale was more local and only a single species was analyzed. Therefore, in our scale of study, pH and dissolved oxygen did not present wide variations, and in most cases, they were not restrictive for fish, including S. notomelas.
Other studies developed in the upper Paraná River flood-plain identified macrophyte cover and dissolved oxygen as the main factors explaining fish assemblages composition and structure (Veríssimo, 1994; Okada et al., 2003). In this study, quantity of macrophyte cover was not available to be related with the abundance of the species. However, macrophyte
Figs. 4a-b. Relationship between densities of Serrapinnus notomelas and densities of competitors (a) and piscivores (b).
Table 4. Pearson and Spearman correlations (r) between the abundance of Serrapinnus notomelas [transformed in Log10 (x+1)] and axes retained for interpretation of the principal com-ponents analysis (PCA) applied for chemical and physical variables. P is the probability of finding a larger r.
PCA Axes r (Pearson) P r (Spearman) P
PC1 chemical -0.03 0.88 -0.06 0.77
PC2 chemical -0.28 0.20 -0.15 0.50
PC3 chemical 0.33 0.12 0.25 0.26
PC4 chemical 0.08 0.72 0.10 0.66
PC1 physical -0.46 0.03 -0.24 0.26
PC2 physical -0.07 0.75 -0.05 0.84
might have influenced total suspended solids, and, they are, therefore, fundamental to explain the abundance of several species of fish, especially juveniles (Agostinho et al., 2003). With respect to biotic variables, the positive relationship between abundance of S. notomelas and its competitors evi-dences that inter-specific competition is not the main factor that determines size of its populations in the studied lagoons. If it was, the relationship should be inverse. This fact can be ex-plained because competition becomes evident when food re-sources are scarce (Matthews, 1998), and this is not the case of the lagoons on the studied period, except when in early phase of desiccation (Agostinho et al., 2000, 2004; Okada et al., 2003).
In floodplains, the high species diversity in lagoons is deter-mined and influenced directly by variations in water level (Junk
et al., 1989; Neiff, 1990). Therefore, water level and local topog-raphy regulate changes among biotopes and, after isolation, biotic interactions (predation and competition) are important fac-tors in structuring fish assemblages (Matthews, 1998; Jackson
et al., 2001). For the studied lagoons, predation appeared to be the stronger interaction, as mentioned by Petry et al. (2003a, 2003b) and Okada et al. (2003) who studied the same area.
Conclusion
In the four studied lagoons, alterations in the density of
S. notomelas were apparently due to variations in abiotic and biotic variables resulted from the lack of a flood pulse during the period studied. Abiotic variables related to the density of the species, i.e., that controlled its population, were surface area of the lagoon, amount of total suspended solids and Secchi depth (these last two, indirectly linked to predation). The most relevant biotic variable that appears to influence population sizes of S. notomelas was predation, and this may be the case for all small sized species that inhabit lagoons.
Acknowledgements
We thank the Brazilian Long Term Ecological Research (Programa Ecológico de Longa Duração - PELD) site 6 for financing this research. We also thank the Nucleus of Re-search in Limnology, Ichthyology and Aquaculture (Nupelia) of the Maringa State University by the infrastructure to con-duct the research.
S. notomelas
density (ind./100m
2)
b
S. notomelas
density (ind./100m
2)
0 1000 2000 3000 4000 5000 6000 7000
Competitors density (ind./100m2)
0 200 400 600 800 1000 1200 1400
y = 11.57 - 0.0055x + 0.000038x2
R2=0.93
0 5 10 15 20 25 30 35
Piscivores density (ind./100m2)
0 200 400 600 800 1000 1200 1400
Literature Cited
Agostinho, A. A., N. S. Hahn, L. C. Gomes & L. M. Bini. 1997. Estrutura trófica. Pp. 229-248. In: Vazzoler, A. E. A. M., A. A. Agostinho & N. S. Hahn (Eds). A Planície de Inundação do Alto Rio Paraná: Aspectos Físicos, Biológicos e Socioeconômicos. Eduem, Maringá, 460p.
Agostinho, A. A., S. M. Thomaz, C. V. Minte-Vera & K. O. Winemiller. 2000. Biodiversity in the high Paraná river floodplain. Pp. 89-118. In: Gopal, B., W. J. Junk & J. A. Davis (Eds). Biodiversity in wetlands: assessment, function and conservation. Leiden, Backhuys Publishers, v.1, 353p.
Agostinho, A. A., L. C. Gomes & H. F. Julio Jr. 2003. Relações entre macrófitas aquáticas e fauna de peixes. Pp. 261-279. In: Thomaz, S. M. & L. M. Bini (Eds). Ecologia e manejo de macrófitas aquáticas. Maringá, Eduem, 341p.
Agostinho, A. A., L. C. Gomes, S. Veríssimo & E. K. Okada. 2004. Flood regime, dam regulation and fish in the Upper Paraná river: effects on assemblage attributes, reproduction and recruitment. Reviews in Fish Biology and Fisheries, 14: 11-19.
Bonetto, A. A. 1986. The Paraná river system. Pp. 541-555. In: Davies, B. R. & K. F. Walker (Eds). The ecology of river systems. Dordrecht, Dr. W. Junk Publishers, 793p.
Gauch, H. G. 1986. Multivariate analysis in community ecology. Cambridge, Cambridge University Press, 298p.
Gotelli, N. J. 2001. A Primer of Ecology, Third Edition. Massachusetts, Sinauer Associates, 265p.
Hahn, N. S., I. F. Andrian, R. Fugi & V. L. L. Almeida. 1997. Ecolo-gia trófica. Pp. 209-228. In: Vazzoler, A. E. A. M., A. A. Agos-tinho & N. S. Hahn (Eds). A Planície de Inundação do Alto Rio Paraná: Aspectos Físicos, Biológicos e Socioeconômicos. Eduem, Maringá, 460p.
Hahn, N. S., R. Fugi & I. F. Andrian. 2004. Trophic ecology of the fish assemblages. Pp. 247-269. In: Thomaz, S. M., A. A. Agos-tinho & N. S. Hahn (Eds). The upper Paraná River and its floodplain: physical aspects, ecology and concervation. Backhuys Publishers, Leiden, 393p.
Hixon, M. A., S. W. Palaca & S. A. Sandin. 2002. Population regulation: historical context and contemporary challenges of open vs. closed systems. Ecology, 83(6): 1490-1508. Jackson, D. A. 1993. Stopping rules in principal component analysis:
a comparison of heuristical and statistical approaches. Ecology, 74(8): 2204-2214.
Jackson, D. A., P. R. Peres Neto & J. D. Olden. 2001. What controls who is where is fresh water fish communities - the roles of biotic, abiotic, and spatial factors. Canadian Journal of Fisheries and Aquatic Sciences, 58: 157-170.
Junk, W. J., P. B. Bayley & R. E. Sparks. 1989. The flood pulse concept in river-floodplain systems. Canadian Journal of Fisheries and Aquatic Sciences, 106: 110-127.
Krebs, C. J. 1994. Ecology: The Experimental Analysis of Distribution and Abundance, Fourth Edition. New York, Harper Collins College Publishers, 801p.
Luiz, E. A., A. A. Agostinho, L. C. Gomes & N. S. Hahn. 1998. Ecologia trófica de peixes em dois riachos da bacia do rio Paraná. Revista Brasileira de Biologia, 58(2): 273-285.
Matthews, W. J. 1998. Patterns in freshwater fish ecology. New York, Chapman & Hall, 756p.
McCune, B. & M. S. Mefford. 1997. Pc-Ord. Multivariate analysis of ecological data. Version 2.0. MjM Software Design. Gleneden Beach, Oregon, U.S.A.
Neiff, J. J. 1990. Ideas para la interpretacion ecológica del Paraná. Interciencia, 15(6): 424-441.
Okada, E. K., A. A. Agostinho, M. Petrere & T. Penczak. 2003. Factors affecting fish diversity and abundance in drying ponds and lagoons in the upper Paraná River basin. Ecohydrology & Hydrobiology, 3(1): 97-110.
Petry, A. C., A. A. Agostinho & L. C. Gomes. 2003a. Fish assemblages of tropical floodplain lagoons: exploring the role of connectivity in a dry year. Neotropical Ichthyology, 15(4): 111-119.
Petry, A. C., A. A. Agostinho & L. C. Gomes. 2003b. Spatial variation of the assemblage structure from the upper Rio Paraná floodplain, Brazil, in a dry year. Acta Limnologica Brasiliense, 15(1): 1-13. Pimm, S. L. 1991. The balance of nature? Ecological issues in the
conservation of species and communities. Chicago, The University of Chicago Press, 434p.
Silva, V. L. B. 2002. Ecologia alimentar de Cheirodon stenodon e Serrapinnus notomelas (Characiformes, Cheirodontinae) na re-gião de desembocadura do rio Paranapanema na represa de Jurumirim, São Paulo. Unpublished Ph.D. Dissertation, Uni-versidade Estadual Paulista, Botucatu. 105p.
Suzuki, H. I., F. M. Pelicice, E. A. Luiz, J. D. Latini & A. A. Agostinho. 2004. Reproductive strategies of the fish community of the upper Paraná River floodplain. Pp. 125-130. In: Agostinho, A. A., L. Rodrigues, L. C. Gomes, S. M. Thomaz & L. E. Miranda (Eds). Structure and functioning of the Paraná River and its floodplain: LTER – Site 6 (PELD – Sítio 6). Maringá, Eduem, 275p. Thomaz, S. M., F. A. Lansac-Tôha, M. C. Roberto, F. A. Esteves &
A. F. Lima. 1992. Seasonal variation of some limnological factors of lagoa do Guaraná, a várzea lake of the High Rio Paraná, State of Mato Grosso do Sul, Brazil. Revue d’Hydrobiologie Tropicale, 25(4): 269-276.
Thomaz, S. M., M. C. Roberto & L. M. Bini. 1997. Caracterização limnológica dos ambientes aquáticos e influência dos níveis fluviométricos. Pp. 73-102. In: Vazzoler, A. E. A. M., A. A. Agostinho & N. S. Hahn (Eds). A planície de inundação do alto rio Paraná: aspectos físicos, biológicos e socio-econômicos. Maringá, Eduem, 460p.
Veríssimo, S. 1994. Variações na composição da ictiofauna em três lagoas sazonalmente isoladas, na planície de inundação do alto rio Paraná, ilha de Porto Rico, PR-Brasil. Unpublished Master Dissertation, Universidade Federal de São Carlos, São Carlos. 77p. Winemiller, K. O. 1989. Patterns of variation on life history among South American fishes in seasonal environments. Oecologia, 81: 225-241.
![Table 4. Pearson and Spearman correlations (r) between the abundance of Serrapinnus notomelas [transformed in Log 10 (x+1)] and axes retained for interpretation of the principal com-ponents analysis (PCA) applied for chemical and physical variables](https://thumb-eu.123doks.com/thumbv2/123dok_br/15773876.641911/5.892.459.822.191.334/spearman-correlations-abundance-serrapinnus-notomelas-transformed-interpretation-principal.webp)
