MEASURING BACTERIAL CELLS SIZE WITH AFM
Denise Osiro¹, Rubens Bernardes Filho²*, Odilio Benedito Garrido Assis², Lúcio André de Castro Jorge², Luiz Alberto Colnago²
¹ Centro Universitário da Fundação Educacional Guaxupé, Guaxupé, MG, Brasil; ²Embrapa Instrumentação, CNPDIA, São
Carlos, SP, Brasil.
Submitted: June 08, 2010; Approved: August 30, 2011.
ABSTRACT
Atomic Force Microscopy (AFM) can be used to obtain high-resolution topographical images of bacteria
revealing surface details and cell integrity. During scanning however, the interactions between the AFM
probe and the membrane results in distortion of the images. Such distortions or artifacts are the result of
geometrical effects related to bacterial cell height, specimen curvature and the AFM probe geometry. The
most commonartifact in imaging is surface broadening,what can lead to errors in bacterial sizing. Several
methods of correction have been proposed to compensate for these artifacts and in this study we describe a
simple geometric model for the interaction between the tip (a pyramidal shaped AFM probe) and the
bacterium (Escherichia coli JM-109 strain) to minimize the enlarging effect. Approaches to bacteria immobilization and examples of AFM images analysis are also described.
Key words: Atomic force microscopy (AFM); Escherichia coli; cell dimensions; bacteria visualization
INTRODUCTION
Since its first design in 1986 as an exploratory device, the
Atomic Force Microscopy (AFM) has evolved as an instrument
for investigating biological materials with variable complexity
such as tissues, yeasts, bacteria and their components,
providing real-time in situ quantitative morphological information (7, 11). The AFM’s versatility combines high
resolution (less than 1 nm) on a sample in native conditions,
i.e., the ability to generate detailed images in air and even in
liquid, with no conductive coating or staining applications (23).
The AFM principle is relatively simple: the object to be
scanned is positioned under a fine tip held by a flexible spring
(cantilever). The scanning is driven by a piezo ceramic that
depending on the microscopy model, can move the specimen or
the cantilever. A fine laser beam is reflected at the back-end of
the cantilever and the position of the reflected beam is detected
by a photodiode array. During scanning, the cantilever bending
is registered and a topographical digital image is constructed
representing both the repulsion and the attraction undergo by
the tip. The resulting image represent the deflection of the
cantilever (Z) at each point of scanned area (X,Y). Further
details of AFM operation can be found in the literature (3, 19).
Since AFM is instrument capable of non-destructively
analysis, biological specimens such as cells, microorganisms
and molecules can be three-dimensionally imaged with high
resolution, providing significant information about structural,
dimensional and functional properties under several
physiological conditions and with superior details than those
attained by conventional electronic scanning microscopy (13).
Bacteria immobilization and AFM imaging
In order to be imaged with AFM, bacteria must be
anchored to a flat surface. Many strains of bacteria readily
adhere to glass or other solid surfaces, but not all of them.
Since immobilization must not affect the chemical and
structural integrity of the cell surface, different approaches
have been used for bacterial immobilization in AFM imaging.
The most common and less inhibitive procedure is to dip a
glass slide in a liquid bacterial culture and remove it after the
specimen has had time to adhere, or to drop the solution on to
surface and carry out the observation after spontaneous drying.
In both methods the immobilization is ruled by weak
electrostatic interactions (physical adsorption) to the slide
surface, thus making it easy for the AFM probe to detach the
cell from the substrate whilst scanning (12). To amend
adherence and improve the ease of imaging, the substrate
surface can be chemically modified by introducing polar
groups that are receptive to the bacteria outer membrane, thus
promoting covalent bonding. Organo-functional silanes, as for
example 3-aminopropyl trimethoxysilane, are widely used to
induce biological specimen adhesion. The silane substituent at
one end reacts with hydroxyl groups on the substrate surface to
give a polysiloxane polymeric layer. The organic substituent on
the other end reacts with cell’s carboxyl groups on cell
membrane providing a covalent link (5).
Cleaved mica (Muscovite) has been commonly employed
as a substrate and is considered a suitable surface for bacteria
attachment. This material consists of tetrahedral double sheets
of (Si/Al)2O5 electrostatically linked by potassium ions (general composition = KAl2(OH)2AlSi3O10). When cleaved and hydrated, this gives rise to an atomically flat surface with high
charge density and a well oriented crystal structure. The
cleaved mica surface can be easily functionalized by
silanization with alkoxysilanes in the presence of water,
introducing cross-linking groups to the surface that promote
irreversible adhesion of bacteria (14).
After immobilization, the AFM tip interacts with the
scanned surface and creates a surface image. This image
generally contains all metrological data and can be analyzed
including height and distance measurements, roughness, cross
section profile, and 3D visualization. Nevertheless, the
geometrical interaction between AFM side size tip and cell
surface causes image distortion when compared with the real
surfaces. Since the final AFM image is the result of a
convolution of the probe geometry and the shape of the cell
being imaged, the dimensions of the objects are distorted,
yielding overestimated values (2, 27). Several mathematical
methods of different complexity have been proposed to correct
or reduce such artifacts in bacterial sizing (9, 24, 26). In this
paper AFM analysis of immobilized E.coli on mica are presented and a simple approach to minimize tip-specimen
distortion is proposed and discussed.
MATERIALS AND METHODS
Escherichia coli JM-109 (provided by Fundação Tropical André Tosello, Campinas, Brazil) was used as model
bacterium. The microorganism was cultured overnight in
LB-medium at 37oC in a shaker flask. An aliquot of a culture of was pelleted by centrifugation, washed in deionized water and
resuspended in 3 ml of tris-HCl buffer at 108 c.f.u/ml. A 10 l droplet of this cell suspension was applied onto a freshly
cleaved mica surface (first rinsed in ultrasonic bath and
silanized with 3-aminopropyltriethoxysilane (APTES -
NH2(CH2)3Si(OC2H5)3 - from Fluka). The surfaces were rinsed twice with tris-HCl buffer to remove non-adherent bacteria and
allowed to dry spontaneously.
AFM images were recorded in contact modes using a
CA, USA) in air. A V-shaped cantilever with silicon nitride
(Si3N4) pyramidal shaped tip (TopoMetrix, model 1520-000) was used. Random areas of 50 x 50 µ m were scanned and the
images processed by a resident TOPOSPM software. Images
were then processed in JPG format and directly imported into
the image processing software SIARCS® v. 3.0 for quantification in two dimensions.
SIARCS (Sistema Integrado para Análise de Raízes e Cobertura do Solo - Integrated System for Roots and Soil Coverage Analysis) is a image analysis software developed by
Embrapa, originally designed for evaluate area and length
measures in agricultural experimentation agricultural
applications. SIARCS has several tools as automatic contour
identification and numerical analyzes through graphs and
columns. Details of the software can be found in
http://www.cnpdia.embrapa.br/produtos/siarcs.html (22)
RESULTS AND DISCUSSION
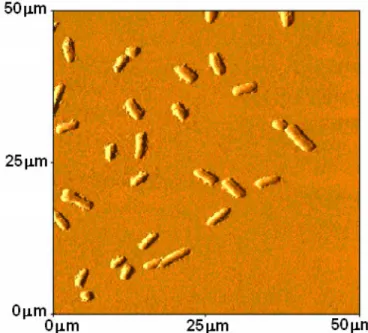
A typical image of bacteria attached on sinalized mica is
presented in Figure 1. The cells are random and dispersed over
the scanned area, allowing individual assessment. A zoomed
area can be selected and local analysis performed. In Figure 2
are displayed two small regions (6 x 6µ m) with a few
organisms zoomed at closer range and 3D reconstructed. These
examples visually confirm the integrity of the attached cells.
Figure 1. Example of AFM image of Escherichia coli on cleaved silanized mica. Topographic image processed using
side illumination (Topospm software).
Figure 2. Closed observation of
individual bacterias and corresponding
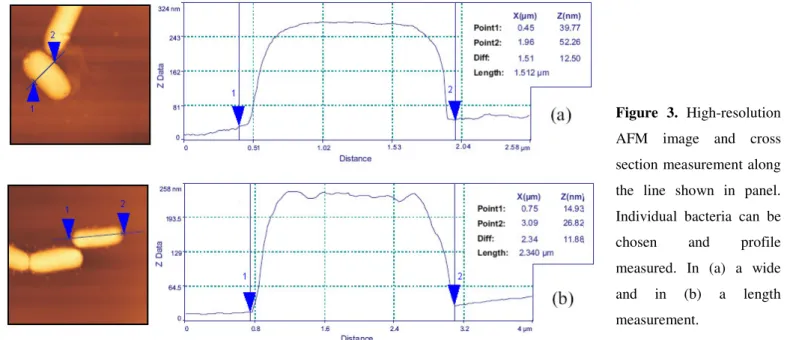
By using standard AFM software, individual analysis can
be conducted providing a quantitative measurement of cell
dimensions and surface roughness. Analytical examples for
those images presented in Figure 2 are displayed in Figure 3,
for which the height and the cross-sectional profile along the
identified lines are presented. In general, the observed outer
membranes of immobilized microorganisms were well
structured and integrated, and there were no apparent
indentations and grooves on cell surface. From height and
section images the bacterial cells were observed to be relatively
smooth, rod-shaped, 2.5 µ m long, 1.5 µ m in diameter and with
middle high not exceeding 0.4 µ m.
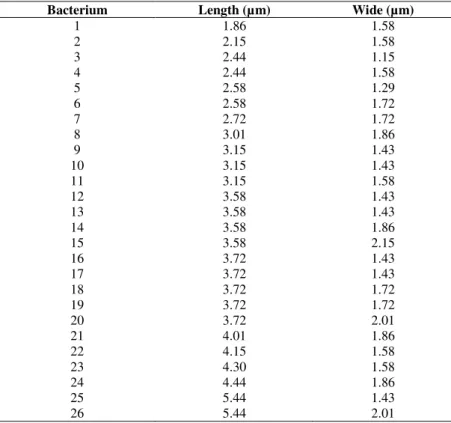
The AFM images gathered in this study were imported
into SIARCS image analysis software. This software locates
individual objects within an AFM image and measures their
geometrical characteristics. This facilitates quick analysis of
several individual objects, organizing measurements into large
data sets of which can be analyzed statistically. By defining
lower and upper threshold levels ranging from 0 (black) to 255
(white), the background signal can be removed. The result for
the illustrative image (Figure 4) is sorted in ascending order by
length in Table 1.
Figure 3. High-resolution
AFM image and cross
section measurement along
the line shown in panel.
Individual bacteria can be
chosen and profile
measured. In (a) a wide
and in (b) a length
measurement.
Figure 4. Example of
image processing: (A)
initial feature
identification, (B)
marked automatically
counted cells, and (C) the
binarized image (the total
number of bacterial cells
Table 1. Automatic measurements from cells of binarized exemple of Figure 4 (C).
Bacterium Length (µm) Wide (µm)
1 1.86 1.58
2 2.15 1.58
3 2.44 1.15
4 2.44 1.58
5 2.58 1.29
6 2.58 1.72
7 2.72 1.72
8 3.01 1.86
9 3.15 1.43
10 3.15 1.43
11 3.15 1.58
12 3.58 1.43
13 3.58 1.43
14 3.58 1.86
15 3.58 2.15
16 3.72 1.43
17 3.72 1.43
18 3.72 1.72
19 3.72 1.72
20 3.72 2.01
21 4.01 1.86
22 4.15 1.58
23 4.30 1.58
24 4.44 1.86
25 5.44 1.43
26 5.44 2.01
From several images analyzed and more than 200 bacterial
cells computed, the average dimensions obtained were: length
3.71 ± 0.18 µm and wide 1.73 ± 0.04 µm. It should be noted
that images generated by an atomic force microscope are
always a convolution of the probe geometry and the shape of
the features being imaged. If the probe is greater than the
feature examined, then the probe-generated artifact will be
maximized and the dimensional measurements derived from
the images will be inaccurate. In Figure 5 is shown a schematic
picture of probe-cell interaction (20). As the AFM probe moves
across the surface of a sample, it is prematurely lifted if the
side of the probe is in contact with the sample instead of the
apex. This lift introduces an error broadening the actual
dimension.
Figure 5. Motion of an AFM probe as it goes
over a coliphorm bacterium attached to a flat
surface. In such a measurement the side of the
The used tip has pyramidal shape with angle θ/2 = 25.6o and radium of 20 nm (TopoMetrix tip - supplier information).
Bacterium height is considered to be 400 nm (average data
from AFM individual measurements) so R = h/2 = 200 nm.
From Figure 5, geometrically can be estimated the broadening
of bacterium image as 2(X-R) where:
( )
( )
[
( )
]
{
1
}
2
sin
2
tan
2
cos
+
•
+
=
R
θ
θ
θ
X
i,e., X = 420.68 nm, so the calculated linear broadening is
then 441.36 nm (0.441 µm) in each direction. Considering that
the location of the artifact did not change when the scan
direction changed (26), the adjusted average dimensions are
3.26 µm length by 1.28 µm wide. It is worth noticing that
proportionally the tip radium is considerable shorter when
compared to the bacteria dimensions. The image will
essentially be ruled by the tip geometry rather than by the tip
radium, which can be neglected with no loss of accuracy.
Our resulting size are in good agreement with other E. coli AFM measurements as presented by Amro et al., (1); Qian et al., (21) and Silva & Teschk (25) though still larger than the
actual E. coli dimensions established as 2.0 µ m length by 0.8-1.0 µm wide (15).
One point to take into account in sizing rod-shaped
bacteria is the increasing of two-dimensional size while
attaching to flat surface. When a bacterium comes near to a
surface the attraction is ruled by the interaction between
physicochemical bacterial wall and solid substratum.
According to Fletcher (8), the initial adhesion can be caused by
nonspecific adsorption. Then once the contact has occurred the
cell tries to accommodate on the surface such that it
strengthens and stabilizes immobilization. The greater the
affinity towards the surface, the higher will be the lateral walls
elongation to bind to a greater number of interacting points as
possible. The final bacterium conformation will reflect the
affinity of the surface lipopolysaccharide or outer membrane
proteins to attach to the solid surface (4).
The morphology of the bacteria after immobilization has
been examined by means of high-resolution scanning electron
microscope (6) and clearly related the shape of the
immobilized colonies to the solid surface features. The level of
bacteria to adhere to different surfaces is based on
physicochemical characteristics of the bacterial surface and
substrate such as wettability and charge density (10, 18).
According to this concept, E. coli cells exhibit a greater propensity to adhere to hydrophilic based surfaces, such as
silanized mica, resulting in an increase in two-dimensional size
while attaching to the surface (17). Treated mica is
energetically favorable facilitating the bacterium approach and
short-range attractive interaction. The presence of many
attaching sites leads the bacteria to attain a maximum
adherence as possible resulting in a flattened pattern. AFM
analysis have shown that morphology of bacteria after mica
immobilization, registered an attachment pattern with large or
elongated cells, around 40% in length and 30% in wide (16),
what is in perfect agreement to results here presented.
CONCLUSION
Atomic force microscopy is a powerful tool for studying
bacteria cells features. It provides high resolution topographic
images as well as quantitative information about surface and
morphology. However, the discrepancy caused primarily by the
distortion of the images of individual cells due to the finite size
of the AFM tip, results in enlargement of the lateral
dimensions of bacterium cell. By applying a simple
geometrical relationship, the artifact can be minimized and the
error in the calculated dimensions reduced. Nevertheless, two
dimensional cell enlargements due to bacterium and substrate
affinity after adhesion have also to be considered.
REFERENCES
Microscopy Studies of the Escherichia coli Outer Membrane: Structural Basis for Permeability. Langmuir. 16, 2789-2796.
2. Bernardes-Filho, R.; Assis, O.B.G. (2005). Development of an Algorithm for Tip-related Artifacts Identification in AFM Biological Film Imaging. Braz. Arch. Biol. Technol., 48, 667-674.
3. Binnig. G.; Quate, C.F.; Gerber, C. (1986). Atomic force microscope. Phys. Rev. Lett., 56, 930-933.
4. Boman, H.G.; Monner, D.A. (1975). Characterization of lipopolysaccharides from Escherichia coli K-12 mutants. J. Bacteriol., 121, 455-464.
5. Camesano, T., Logan, B. E. (2000). Probing bacterial electrosteric interactions using atomic force microscopy. Environ. Sci. Technol., 34, 3354-3362.
6. Díaz, C.; Cortizo, M.C.; Schilardi, P.L.; Saravia, S.G.G.; Mele, M.A.F.L. (2007). Influence of the Nano-micro Structure of the Surface on Bacterial Adhesion. Materials Research., 10, 11-14.
7. Dufrêne, Y.F. (2002). Atomic force microscopy, a powerful tool in microbiology. J. Bacteriol., 184, 5205-5213.
8. Fletcher, M. (1996). Bacterial attachment in aquatic environments: A diversity of surfaces and adhesion strategies. In: Fletcher, M. (ed). Bacterial adhesion: Molecular and ecological diversity. Willey-Liss Inc., New York, USA, Chapter 1, pp. 1-24.
9. Gainutdinov, R.V.; Arutyuno P.A. (2001). Artifacts in Atomic Force Microscopy. Russian Microelectronics. 30, 219–224.
10. Gallardo-Moreno, A.M.; Gonzalez-Martín, M.L.; Pérez-Giraldo, C.; Bruque, J.M.; Gómez-García, A.C. (2002). Serum as a Factor Influencing Adhesion of Enterococcus faecalis to Glass and Silicone. Appl. Environ. Microbiol., 68, 784–5787.
11. Ikai, A. (1996). STM and AFM of bio/organic molecules and structure. Surface Science Reports, 26, 261-332.
12. Kailas, L.; Ratcliffe, E.C.; Hayhurst, E.J.; Walker, M.G.; Foster, S.J.; Hobbs, K. (2009). Immobilizing live bacteria for AFM imaging of cellular processes. Ultramicroscopy. 109, 775–780.
13. Kasas, S.; Thomson, N.H.; Smith, B.L.; Hansma, P.K.; Miklossy, J.; Hansma, H.G. (1997). Biological applications of the AFM: from single molecules to organs. Int. J. Imaging Syst.Technol. 8, 151-161.
14. Lyubchenko, Y.L.; Jacobs, B.L.; Lindsay, S.M.; Stasiak, A. (1995). Atomic force microscopy of nucleoprotein complexes. Scanning Microscopy. 9, 705-727.
15. Meztler, D.E.; Meztler, C.M. (1997). Biochemistry: The chemical reactions of living cells. Hartcourt Academic Press, London, UK, v.1. 16. Mitik-Dineva, N.; Wang, J.; Mocanasu, R.C.; Stoddart, P.R.; Crawford,
R.J.; Ivanova. E. P. (2008). Impact of nano-topography on bacterial attachment. Biotechnol. J., 3,536–544.
17. Mitik-Dineva, N.; Wang. J.; Truong, V.K.; Stoddart, P.; Malherbe. F.; Crawford, R.J.; Ivanova. E. P. (2009). Escherichia coli, Pseudomonas aeruginosa, and Staphylococcus aureus Attachment Patterns on Glass Surfaces with Nanoscale Roughness. Curr. Microbiol., 58,268–273. 18. Morais, L.C.; Bernardes-Filho, R.; Assis, O.B.G. (2009). Wettability and
bacteria attachment evaluation of multilayer proteases films for biosensor application. World J. Microbiol. Biotechnol., 25,123-129.
19. Morris, V.J.; Kirby, A.R.; Gunning, A.P. (1999). Atomic Force Microscopy for Biologists. London: Imperial College Press.
20. Osiro, D. (1998). Análise de vírus e bactérias por microscopia de força atômica. São Carlos, Brazil, (M.Sc. Dissertation. Instituto de Química de São Carlos. USP).
21. Qian, L.; Guan, Y.; He, B.; Xiao. H. (2008). Modified guanidine polymers: Synthesis and antimicrobial mechanism revealed by AFM. Polymer. 49, 2471–2475.
22. SIARCS. Sistema Integrado para Análise de Raízes e Cobertura do Solo. Available at: http://www.cnpdia.embrapa.br/produtos/siarcs.html. Accessed 15 Oct 2010.
23. Schabert, F.A.; Henn C.; Engel, A. (1995). Native Escherichia coli OmpF porin surfaces probed by atomic force microscopy. Science. 268, 92-94.
24. Shen, Y.; Sun, J.L.; Zhang, A.; Hu, J.; Xu, LX. (2007). A new image correction method for live cell atomic force microscopy. Phys. Med. Biol., 52, 2185–2196.
25. Silva Jr., A.; Teschke, O. (2005). Dynamics of the antimicrobial peptide PGLa action on Escherichia coli monitored by atomic force microscopy. World J. Microbiol. Biotechnol., 21, 1103–1110.
26. Velegol, S.B.; Pardi, S.; Li, X.; Velegol, D.; Logan, B.E. (2003). AFM Imaging artifacts due to bacterial cell height and AFM tip geometry. Langmuir. 19, 851-857.
27. Yang, D-Q.; Xiong, Y-Q.; Guo, Y.; Da, D-A.; Lu, W-G. (2001) Sizes correction on AFM images of nanometer spherical particles. J. Materials Sci., 36, 263– 267.