R E S E A R C H
Open Access
Systolic time ratio measured by impedance
cardiography accurately screens left
ventricular diastolic dysfunction in patients
with arterial hypertension
Rodrigo Nazário Leão
1,2*, Pedro Marques Silva
2,3, Luísa Branco
4, Helena Fonseca
3, Bruno Bento
5, Marta Alves
6,
Daniel Virella
6and Roberto Palma Reis
2,5Abstract
Background:The use of impedance cardiography (ICG) may play a role in the assessment of cardiac effects of hypertension (HT), especially its hemodynamic features. Hypertensive heart disease involves structural changes and alterations in left ventricular geometry that end up causing systolic and/or diastolic dysfunction. TheIMPEDDANS
study aims to assess the usefulness of ICG for the screening of left ventricular diastolic dysfunction (LVDD) in patients with HT.
Methods:Patients with HT were assessed by echocardiography and ICG. Receiver-operating characteristic curve and the area under the curve were used to assess the discriminative ability of the parameters obtained by ICG to identify LVDD, as diagnosed by echocardiography.
Results:ICG derived pre-ejection period (PEP), left ventricle ejection time (LVET), systolic time ratio (STR) and D wave were associated (p< 0.001) with LVDD diagnosis, with good discriminative ability: PEP (AUC 0.81; 95% CI 0.74– 0.89), LVET (AUC 0.82; 95% CI 0.75–0.88), STR (AUC 0.97; 95% CI 0.94–1.00) and presence of D wave (AUC = 0.87; 95% CI 0.82–0.93). STR≥0.30 outperformed the other parameters (sensitivity of 98.0%, specificity of 90.2%, positive predictive value of 95.2%, and negative predictive value of 96.1%).
Conclusion:The ICG derived value of STR allows the accurate screening of LVDD in patients with HT. It might as well be used for follow up assessment.
Trial registration:The study protocol was retrospectively registered as IMPEDDANS on ClinicalTrials.gov (ID: NCT03209141) on July 6, 2017.
Keywords:Arterial hypertension, Diastolic dysfunction, Impedance Cardiography, Systolic time ratio, Screening
Background
Arterial hypertension (HT) causes high morbidity and mortality [1]. The progression of hypertensive heart disease involves myocardial fibrosis and changes in left ventricular geometry that precedes functional changes [2]. Diastolic dysfunction is part of this continuum, and despite the growing recognition of its importance, it is
generally undervalued because of the difficulty in its diag-nosis and the absence of effective therapies [3]. Currently, the asymptomatic cardiac damage repercussion of HT is mainly evaluated by electrocardiography and by echocar-diography [4]. Cardiac magnetic resonance imaging (MRI) is an alternative diagnostic examination but should only be considered for assessment of left ventricle (LV) size and mass when echocardiography is not feasible (or, in less fre-quent situations, when imaging of delayed enhancement could have therapeutic implications). Impedance cardiog-raphy (ICG) is a non-invasive, non-operator dependent, low-cost complementary diagnostic tool that easily allows
* Correspondence:[email protected]
1Unidade Funcional Medicina 1.2, Hospital de São José, Centro Hospitalar
Lisboa Central-EPE, Rua José António Serrano, 1150-199 Lisboa, Portugal
2NOVA Medical School, Universidade NOVA de Lisboa, Lisboa, Portugal
Full list of author information is available at the end of the article
characterizing a hypertensive patient’s hemodynamic phenotypic profile and optimizing the antihypertensive therapy [5, 6]. It analyses and registers hemodynamic changes through the measurement of electrical resistance changes in the thorax and translating them graphically as impedance and electrocardiogram waveforms [5, 7, 8]. This technique has evolved in recent years, making it an attract-ive and economical alternatattract-ive approach. However, it is recognized that well-designed clinical trials are lacking in well-defined populations, in order to justify its widespread use in clinical practice [9–12]. Some other more specific procedures are reserved only for diagnosis of myocardial is-chaemia in hypertensive patients with LV hypertrophy [4]. Therefore it is important to have alternative tests for the initial assessment of diastolic function in hypertensive patients.
In diastolic dysfunction, there is a relative shift in LV filling to the final part of the diastole with a greater de-pendence on atrial contraction. These changes can be detected by Doppler echocardiography and by ICG [2].
The phase of rapid passive ventricular filling at the onset of diastole produces the E wave and the atrial contraction produces the A wave. The E and the A waves on the Dop-pler sonography correspond to the O and A waves in ICG, respectively [13, 14]. Normally, the E wave in Doppler is higher than the A wave, whereas in diastolic dysfunction, the E wave is prolonged and becomes smaller than the A wave. ICG can detect diastolic dysfunction by revealing a delayed O wave (called a D wave) when contractility is normal, [14] whereas diastolic dysfunction produces a sig-nificant increase in the amplitude and duration of A wave
(Fig. 1) [5]. A D wave with an amplitude above the dZ/dt baseline greater than one third of the amplitude of the corresponding E wave is considered abnormal [15].
The pre-ejection period (PEP), corresponding to the interval between the depolarization onset (Q-wave) and aortic valve opening that includes the excitation-contraction coupling and isovolumetric excitation-contraction of the LV, decreases with increasing LV pressure at the end of diastole, the main physiological consequence of dia-stolic dysfunction [16–18]. On the other hand, the left ventricular ejection time (LVET), measured as the inter-val between the opening of the aortic inter-valve and its clos-ure, increases in patients with diastolic dysfunction. It has been reported that a marked increase in LVET oc-curs in patients with isolated diastolic dysfunction and that this increase correlates with the severity of diastolic dysfunction [19]. Thus, in diastolic dysfunction, the sys-tolic time ratio (STR) is expected to decrease (STR = PEP / LVET).
The thoracic fluid content (TFC) reflects the total volume of fluid (intravascular and extravascular) within the thoracic cavity, being inversely related to patient transthoracic electrical bioimpedance. It is therefore a reliable index of fluid overload in ambulatory patients. This parameter increases with the evolution of diastolic dysfunction being a sign of severity and has recently been proposed for monitoring diastolic heart failure pa-tients [20, 21].
The purpose of IMPEDDANS study is to assess the usefulness of ICG in the screening of LV diastolic dys-function (LVDD) in patients with HT.
Methods
This is a validation study of a diagnostic method (ICG) used for a new purpose (diagnosis of LVDD) comparing it with the clinical standard (echocardiography), the method currently used for this effect in usual clinical practice.
Patients of either gender, aged 18–75 years, diagnosed with grade 2 or 3 HT (systolic blood pressure [BP]≥ 160 mmHg and/or diastolic BP≥100 mmHg) and/or with resistant hypertension (according the definition of ESH/ESC guidelines), [4] followed up in ambulatory clinic of an Internal Medicine Department of a tertiary referral hospital were eligible for recruitment.
Patients were excluded in the presence of: pregnancy, height less than 120 cm or more than 230 cm, weight less than 30 kg or greater than 155 kg, heart failure II-IV NYHA, [22] heart rate (HR) less than 50 bpm or greater than 110 bpm, atrial fibrillation or flutter, more than three premature ventricular contractions per hour, complete left bundle branch or atrioventricular block, pacemaker, se-vere valvulopathy, constrictive pericarditis, hypertrophic and restrictive cardiomyopathy, ischaemic heart disease and/or segmental kinetics anomalies assessed by echocar-diography, left ejection fraction <50%, or poor echocardio-graphic window.
Recruitment began in January 2015 and was finished in July 2017.
Sample size was estimated to test a hypothesized posi-tive predicposi-tive value of 70 ± 5% of the ICG parameters with 95% confidence. Since the prevalence of LVDD in patients with HT is estimated, in most studies, [2, 23, 24] to be approximately 50%, to reach an effective sam-ple of 77 patients with LVDD, the samsam-ple to be recruited was doubled to 154 hypertensive patients.
Considering that it would not be ethically acceptable to perform right heart catheterization of patients with grade 2 or 3 HT, we chose to design a concordance study between ICG and echocardiography, which is the clinical standard for the diagnosis of LVDD and characterization of hypertensive cardiomyopathy.
Participants were invited to be systematically assessed by ICG and echocardiography, within a maximum interval of 8 days. To ensure that both tests were performed under similar conditions, evaluations matching variations greater than 10% in BP or variations more than 5% in HR were not considered. These patients were asked to repeat at least one of the exams. If the variations persisted, they were excluded. Demographic and clinical baseline data were collected from the patients’medical records. Outpatient HT clinic protocol requires clinical evaluation, blood chemistry tests, electrocardiogram (EKG) and, eventually, 24 h am-bulatory blood pressure monitoring (AMBP). Data re-garding the comorbidities and medication were collected. Body mass index was calculated as weight (kg) divided by height (m) squared.
ICG was carried out by an experienced cardiopneumol-ogy technician with Niccomo–Non-Invasive Continuous Cardiac Output Monitor (Medis, GmbH, Ilmenau, Germany) according the approved department protocol. According to this, patients had to present with 6 h of fast-ing but took their usual antihypertensive drugs. It was car-ried out in supine position during 20 min (continuous recording) and 70° orthostatism with the help of the tilting table (10 min in continuous recording). The test was inter-rupted if there was syncope or pre-syncope; dizziness, nausea and malaise associated with poorly tolerated hypotension and/or bradycardia; pain/precordial discom-fort; EKG ST segment changes; systolic BP > 210 mmHg. Table 1 presents the evaluated parameters.
Transthoracic echocardiography was performed in Vivid E9 and S5 devices (GE Healthcare, Chicago, Illi-nois, USA), always by the same three experienced cardi-ologists. To ensure uniformity of evaluation and correct evaluation, all exams were reviewed by one of the other cardiologists. In order to diagnose and classify diastolic dysfunction, the left atrium volume index, the velocities E, A, septal e’, lateral e’, deceleration time (DT), isovolu-metric relaxation time (IRVT), atrial reverse velocity (Ar) and E/A ratio variation with Valsalva manoeuvre were recorded (whenever the patient cooperated and if the images obtained had the necessary quality for ana-lysis) as recommended by 2009 guidelines. We consid-ered that patients had LVDD when present septal e’< 8, lateral e’< 10 and left atrial volume equal or greater than 34 mL/m2(Fig. 2) [25].
The estimated efficacy and effectivity measures are the positive predictive value (PPV), negative predictive value (NPV), sensitivity and specificity of the presence of the D wave and the values of PEP, LVET, STR, and TFC ob-tained by ICG to detect LVDD.
Categorical variables were described with frequencies and percentages. After evaluating the normal distribu-tions of the continuous variables by the Kolmogorov-Smirnov test and histograms analysis, the variables that presented normal distribution were described with mean and standard deviation, and the variables without nor-mal distribution were described with median and inter-quartile range (25th percentile, P25 - 75th percentile, P75) or amplitude (minimum - maximum).
Table 1Parameters assessed in impedance cardiography
Parameter Definition Formula
Heart rate Number of heart beats per minute (bpm) RR interval measurement on the ECG and extrapolation for bpm
Mean blood pressure (MAP) Average pressure exerted by the blood on the arterial walls Automatic (oscillometric method) = MAP is measured directly and SBP and DBP are derived
Cardiac output (CO) Amount of blood ejected from the left ventricle / minute CO = Stroke volume x Heart rate Cardiac index (CI) Standard CO for the body surface area (BSA) CI = CO / BSA
Stroke volume (SV) Amount of blood ejected from the left ventricle / heart beat
SV = VEPT x LVET x VI (Z MARC Algorithm) Stroke volume index (SVI) Standard SV for the BSA SVI = SV / BSA
Vascular systemic resistance (VSR) Resistance to circulating blood in the arterial system VSR = 80 x ((MAP-CVP)/CO) Vascular systemic resistance index (VSRI) Standard resistance to circulating blood in the arterial
system for the BSA
VSRI = 80 x ((MAP-CVP)/CI) Acceleration index (AI) Initial acceleration of blood in the aorta that occurs within
the first 10–20 milliseconds after opening of the aortic valve
AI = (d2Z/dt2 Max)/TFI
Velocity index (VI) Aorta blood velocity peak VI = (dZ/dtMax)/TFI
Thoracic fluid (TF) Electrical conductivity of the thoracic cavity (determined by intravascular, interalveolar and interstitial fluids)
TF = 1/TFI Left heart work (LHW) Indicator of the amount of work the left ventricle exerts to
pump blood every minute
LHW = (MAP–PAOP) x CO Left heart work index (LHWI) Standard LHW for the BSA LHW = (MAP–PAOP) x CI Systolic time ratio (STR) Ratio of electrical and mechanical systole STR = PEP / LVET Pre-ejection period (PEP) Time interval from the beginning of the electrical
stimulation of the ventricles to the beginning of the opening of the aortic valve (electric systole)
Time interval between the start of wave Q on the ECG and point B on wave dZ / dt (opening of the aortic valve) Left ventricular ejection time (LVET) Time interval from opening to closing of the aortic valve
(mechanical systole)
Time interval from point B to point X on wave dZ / dt
CVPCentral venous pressure (pressure in the thoracic and right atrial vein - 6 mmHg is considered by default),dZ / dtMaxMaximum of the first derivative ofΔZ,
d2Z / dt2
MaxMaximum of the second derivative ofΔZ,PAOPPulmonary artery occlusion pressure (considered by default as 10 mmHg),TFIThoracic fluid index
(baseline thoracic impedance, Z0),VEPTVolume of electrically participating tissue (conductive volume for chest size affected by weight, height and sex)
confidence interval method [26]. Dichotomized ICG pa-rameters by the obtained cut-off points, were used to es-timate the test performance measures (sensitivity, specificity, positive and negative predictive values as well as false positive and negative rates). The level of signifi-cance α= 0.05 was considered. Data were analysed with SPSS 22.0 (SPSS for Windows, Rel. 22.0.1. 2013. SPSS Inc., Chicago, Il, EUA) and MedCalc Statistical Software version 16.4.3 (MedCalc Software bvba, Ostend, Belgium; https://www.medcalc.org; 2016).
The study protocol was approved by the hospital’s Eth-ics Committee (approval number 166/2014). Informed consent was obtained from each patient.
The study protocol is registered as IMPEDDANS on ClinicalTrials.gov (ID: NCT03209141).
Results
IMPEDDANS study recruited 167 patients. Ten patients were excluded: three had syncope during ICG, three gave up and did not perform the tests, three had a
significant dysrhythmia and one was diagnosed with atrial septal defect. From the 157 hypertensive patients included, 102 (65%) had LVDD (diagnosed by echocar-diogram). Table 2 shows the main demographic, clinical and hemodynamic characteristics of the patients.
The patients with LVDD diagnosis had significantly lower PEP and STR and higher LVET and TFC than the patients without LVDD (Table 3 and Fig. 3). The D wave was more frequently identified among patients with LVDD (Table 3) and its presence was also associated with LVDD diagnosis.
The diagnostic performance was estimated for those ICG parameters significantly associated with the diag-nosis of LVDD. The AUC estimated for PEP was 0.81 (95% CI 0.74–0.87; p < 0.001), for LVET the AUC was
0.82 (95% CI 0.75–0.87; p< 0.001), the AUC was 0.97
(95% CI 0.93–0.99; p< 0.001) for STR and for the
presence D wave the AUC was 0.88 (95% CI 0.82– 0.93; p< 0.001) (Fig. 4). From the analysis of the ROC
curves, were defined the following cut-off points for
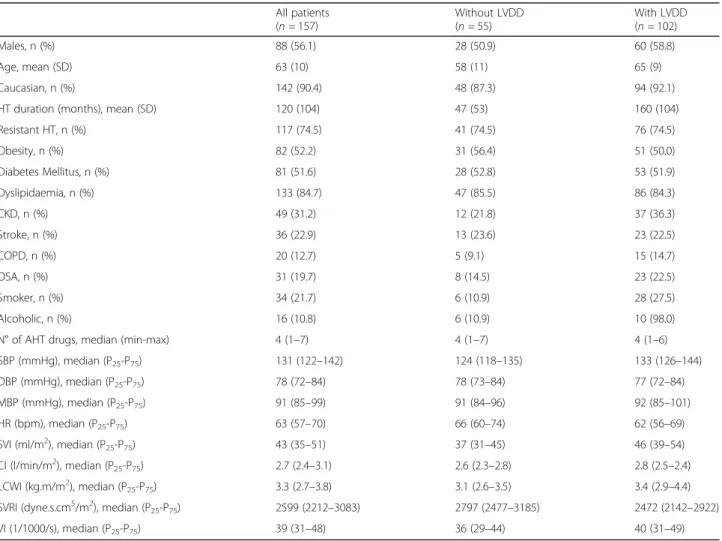
Table 2Main characteristics of the effective sample (n= 157)
All patients (n= 157)
Without LVDD (n= 55)
With LVDD (n= 102) Males, n (%) 88 (56.1) 28 (50.9) 60 (58.8) Age, mean (SD) 63 (10) 58 (11) 65 (9) Caucasian, n (%) 142 (90.4) 48 (87.3) 94 (92.1) HT duration (months), mean (SD) 120 (104) 47 (53) 160 (104) Resistant HT, n (%) 117 (74.5) 41 (74.5) 76 (74.5) Obesity, n (%) 82 (52.2) 31 (56.4) 51 (50.0) Diabetes Mellitus, n (%) 81 (51.6) 28 (52.8) 53 (51.9) Dyslipidaemia, n (%) 133 (84.7) 47 (85.5) 86 (84.3) CKD, n (%) 49 (31.2) 12 (21.8) 37 (36.3) Stroke, n (%) 36 (22.9) 13 (23.6) 23 (22.5) COPD, n (%) 20 (12.7) 5 (9.1) 15 (14.7) OSA, n (%) 31 (19.7) 8 (14.5) 23 (22.5) Smoker, n (%) 34 (21.7) 6 (10.9) 28 (27.5) Alcoholic, n (%) 16 (10.8) 6 (10.9) 10 (98.0) N° of AHT drugs, median (min-max) 4 (1–7) 4 (1–7) 4 (1–6) SBP (mmHg), median (P25-P75) 131 (122–142) 124 (118–135) 133 (126–144)
DBP (mmHg), median (P25-P75) 78 (72–84) 78 (73–84) 77 (72–84)
MBP (mmHg), median (P25-P75) 91 (85–99) 91 (84–96) 92 (85–101)
HR (bpm), median (P25-P75) 63 (57–70) 66 (60–74) 62 (56–69)
SVI (ml/m2), median (P
25-P75) 43 (35–51) 37 (31–45) 46 (39–54)
CI (l/min/m2), median (P
25-P75) 2.7 (2.4–3.1) 2.6 (2.3–2.8) 2.8 (2.5–2.4)
LCWI (kg.m/m2), median (P
25-P75) 3.3 (2.7–3.8) 3.1 (2.6–3.5) 3.4 (2.9–4.4)
SVRI (dyne.s.cm5/m2), median (P
25-P75) 2599 (2212–3083) 2797 (2477–3185) 2472 (2142–2922)
VI (1/1000/s), median (P25-P75) 39 (31–48) 36 (29–44) 40 (31–49)
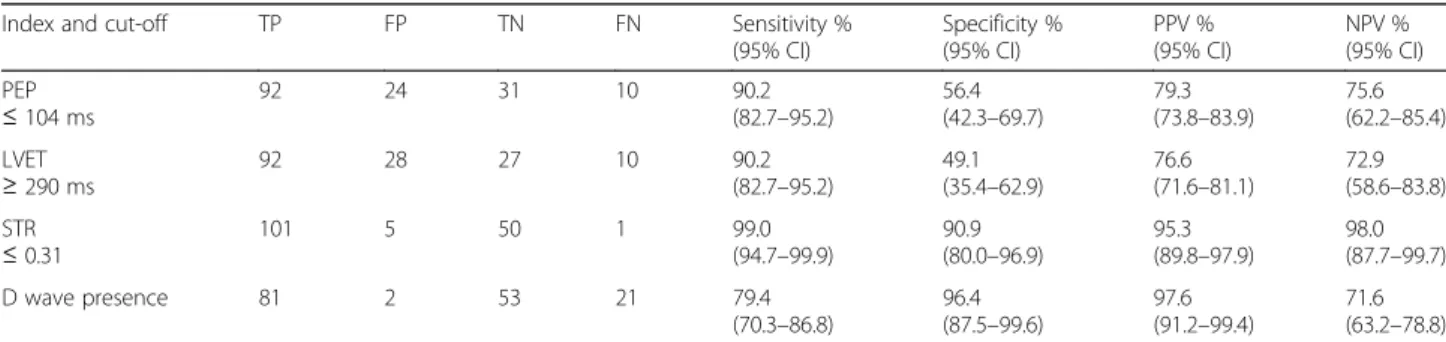
LVDD screening: PEP ≤ 104 ms, LVET ≥ 320 ms; STR ≤ 0.31. Table 4 presents the results of the LVDD diagnostic evaluation with the ICG variables PEP, LVET, STR and D wave.
The misclassification of LVDD using STR affected 6 cases, one false negative (FN) and five false positive (FP). The only FN case had STR = 0.32, which is only slightly above the cut-off value 0.31. No demographic, clinical and hemodynamic characteristics were found that differenti-ated the misclassified cases from the rest of the sample.
Discussion
In the IMPEDDANS study, the STR, with sensitivity of 99.0% and specificity of 90.9%, outperformed the other analysed variables as screening test for LVDD. This index only misclassified 5 FP cases, which deter-mine a 95.3% PPV, and 1 FN case, which deterdeter-mines a 98.0% NPV.
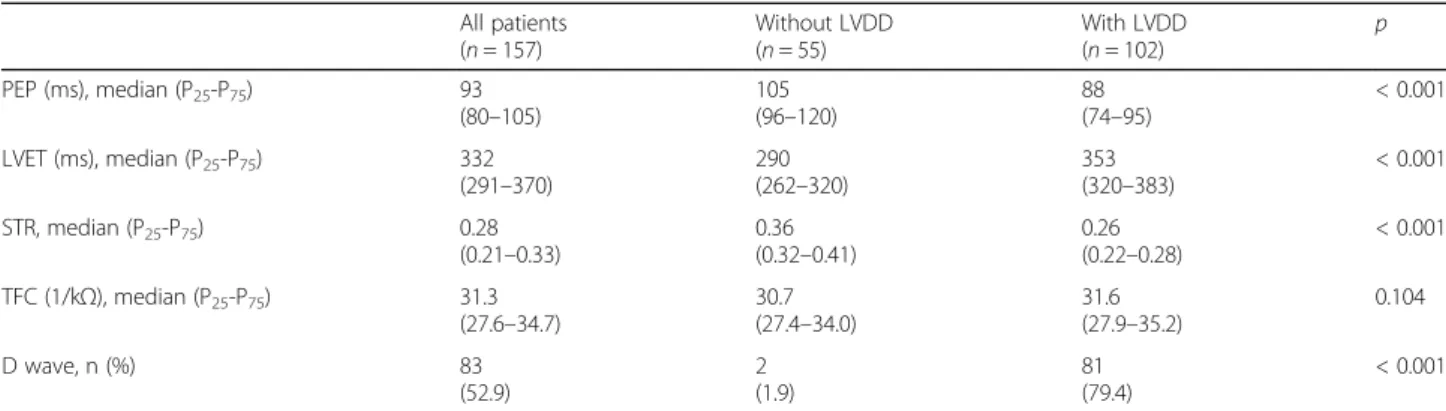
In the IMPEDDANS study, PEP≤ 104 ms was identi-fied as a good screening test for LVDD with sensitivity of 90.2% and PPV of 79.3%. PEP extends from the onset Table 3Distribution of the values of measurements obtained by ICG considered to be used to screen LVDD (n= 157). Mann-Whitney test
All patients (n= 157)
Without LVDD (n= 55)
With LVDD (n= 102)
p
PEP (ms), median (P25-P75) 93
(80–105)
105 (96–120)
88 (74–95)
< 0.001 LVET (ms), median (P25-P75) 332
(291–370)
290 (262–320)
353 (320–383)
< 0.001 STR, median (P25-P75) 0.28
(0.21–0.33)
0.36 (0.32–0.41)
0.26 (0.22–0.28)
< 0.001 TFC (1/kΩ), median (P25-P75) 31.3
(27.6–34.7)
30.7 (27.4–34.0)
31.6 (27.9–35.2)
0.104 D wave, n (%) 83
(52.9)
2 (1.9)
81 (79.4)
< 0.001
ICGimpedance cardiography,LVDDleft ventricular diastolic dysfunction,LVETleft ventricle ejection time,PEPpre-ejection period,STRsystolic time ratio,TFCthoracic fluid content
of ventricular depolarization to the opening of the aortic valve. It is composed of two sub-intervals, known as the period of the electromechanical coupling and the period of elevation of pressure (or isovolumetric systole). The electromechanical coupling period undergoes few changes in acute interventions, but changes in the final diastolic pressure, aortic diastolic pressure and in the mean velocity of elevation of LV pressure (usually predominantly) in this period are the factors that deter-mine the period of pressure rise and, consequently, PEP. Elevation of LV end-diastolic pressure (LVEDP),
reduction of aortic diastolic pressure or gain in the rate of pressure increase in the pre-ejection period, lead to a time reduction. In mild LVDD, we expect a rise in LVEDP and a shortening of PEP, as we confirmed in this sample [16–18]. However, we must point out that LVEDP, aortic diastolic pressure or alterations in the rate of pressure increase can act simultaneously and we can have an unexpected PEP time. For example, in the estab-lished heart failure, the final diastolic pressure is in-creased, but the rate of ventricular pressure elevation in the pre-ejective period is so slow that it predominates Fig. 4Discriminative ability of PEP, LVET, STR and D wave to identify LVDD in hypertensive patients, as determined by the AUC and ROC curves. STR AUC = 0.97; PEP AUC = 0.81; LVET AUC = 0.82; D Wave AUC = 0.88. AUC, area under the curve; LVDD, left ventricular diastolic dysfunction; LVET, left ventricle ejection time; PEP, pre-ejection period; STR, systolic time ratio
Table 4Diagnostic performance of ICG-derived indexes for identification of LVDD, for the identified cut-off points (n= 157)
Index and cut-off TP FP TN FN Sensitivity % (95% CI)
Specificity % (95% CI)
PPV % (95% CI)
NPV % (95% CI) PEP
≤104 ms
92 24 31 10 90.2 (82.7–95.2)
56.4 (42.3–69.7)
79.3 (73.8–83.9)
75.6 (62.2–85.4) LVET
≥290 ms
92 28 27 10 90.2 (82.7–95.2)
49.1 (35.4–62.9)
76.6 (71.6–81.1)
72.9 (58.6–83.8) STR
≤0.31
101 5 50 1 99.0 (94.7–99.9)
90.9 (80.0–96.9)
95.3 (89.8–97.9)
98.0 (87.7–99.7) D wave presence 81 2 53 21 79.4
(70.3–86.8)
96.4 (87.5–99.6)
97.6 (91.2–99.4)
71.6 (63.2–78.8)
and prolongs PEP. In this sample, it was not the case, because we excluded the patients with heart failure [16– 18].
Increased LVET (≥ 320 ms) was also a good LVDD screening tool with sensitivity 90.2%, and PPV 76.6%. Con-sidering that active relaxation can be considered in the strictest sense as an early diastolic event, the time of onset of this process depends, at least in part, on systolic events such as the duration of contraction. In LVDD, increases in load during the contraction phase induce compensatory in-creases in duration of systole (LVET) and delayed onset of relaxation, which explain these results [27, 28].
The diastolic properties of the LV are largely determined by the size or volume of the LV, the thickness, physical properties of the ventricular wall and the relaxation process of the myocardium. Thus, a combination of increased myo-cardial mass and changes in the extracellular collagen net-work may cause or contribute to an increase in the passive elastic rigidity of the ventricle with a diastolic pressure-volume relation represented by a steep curve. Disorders of the active myocardial relaxation process, acting alone or in conjugation with abnormal passive ventricular properties, may also cause increased ventricular rigidity. As a result, there is a reduction in the compliance and distensibility of the ventricle, the filling dynamics are changed and the final diastolic pressure increases. Under these circumstances, as the disease progresses, an increase in central blood volume may produce a substantial increase in LV diastolic pressure and, consequently, cause some degree of pulmonary congestion, which can be evidenced by an increase in TFC [13, 29, 30]. In the IMPEDDANS study, however, we did not verify any relation between LVDD and TFC. We hypothesize that this is related with the important
proportion of resistant hypertensive patients which are polymedicated (n= 117, 74.5% of the total sample; 48.4% of
the patients with LVDD,n= 76), most of them taking
di-uretics (n= 82, 80.4%). On the other hand, pulmonary
con-gestion is more common in an advanced phase of hypertensive disease, when patients start to evidence heart failure symptoms, which were not included (only patients with mild asymptomatic LVDD were included).
During early diastole, the occurrence of a prominent wave may indicate diastolic dysfunction. As such, the presence of a pronounced diastolic O wave (D wave), in either upright or supine position, can be assumed as an evidence of diastolic dysfunction [2]. Thus, it was verified that the presence of a D wave was statistically related with LVDD and that it had good performance screening LVDD, with 79.4% of sensitivity and 97.6% PPV.
Our observational study has some weak points: the two tests were performed within a time lapse of 8 days. In order to minimize this weakness, evaluations matching variations >10% in BP or variations >5% in HR were not considered. Although sample was recruited by conveni-ence of researchers all patients had strict inclusion and ex-clusion criteria, were submitted to the same evaluation protocols and patients were recruited non-consecutively. Significant strengths are the exclusion of the elderly (due to the influence of age on the physiopathology of diastolic dysfunction), and the fact that examinations have been performed in a clinical environment controlled by experi-enced professionals under well-defined protocols.
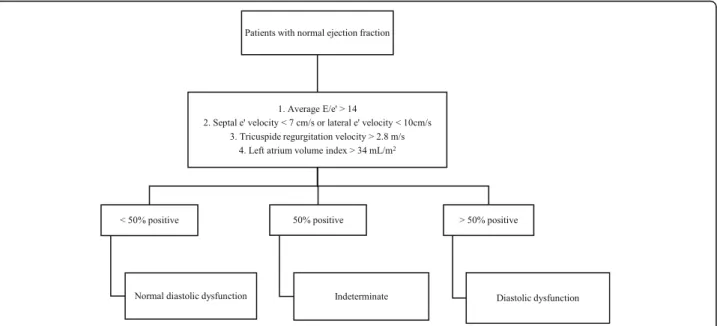
Recommendations for the diagnosis of diastolic dys-function were updated in 2016 (Fig. 5 presents the diag-nostic approach proposed) [31]. However, there is no real consensus in the scientific community regarding its
applicability due to the fact that they have not yet been duly validated and just during this year was presented the first trial studying their applicability being difficult to conclude about their performance [32, 33]. We can, however, admit that the new recommendations create situations in which diastolic dysfunction may be under-diagnosed. In fact, the inclusion of the tricuspid regurgi-tation peak velocity as a criterion for the diagnosis and classification of diastolic dysfunction may lead to some interpretation problems because high values may be due to pulmonary hypertension and its increase is usually as-sociated with elevation of pulmonary artery pressure due to increased filling pressures of the left ventricle, phe-nomena present in advanced stages of diastolic dysfunc-tion [34–37]. Thus, we can only diagnose diastolic dysfunction in patients with established heart failure and patients with diastolic dysfunction at an early stage may go unnoticed, which goes against the spirit of this study, whose aim is to diagnose patients at an early stage, asymptomatic, without heart failure. In addition, the adoption of new recommendations would bring the limi-tation of not allow to compare our results with previous studies and perform other substudies with the acquired data. After analyzing these points and considering that these recommendations were published in the middle of the study period, we chose to not integrate them into our protocol and to keep the previous recommenda-tions, already studied and validated.
Despite all the potential demonstrated by the ICG, we must emphasize the importance of performing routine echocardiography in hypertensive patients, indispensable to provide the recommended basic echocardiographic as-sessments [4]. In hypertensive patients ICG can be a valid, cost effective alternative for LVDD screening, it might also be used to monitor follow-up and define patients who would benefit from early transthoracic echocardiography.
Conclusions
ICG can accurately screen LVDD in hypertensive pa-tients, using its derived parameters STR, PEP, LVET and D wave. STR alone showed the highest discrim-inative ability. Therefore, we recommend its use as a LVDD screening tool.
Future ICG studies applying the diagnostic test for LVDD will probably increase our understanding of the physiopa-thology/hemodynamics of HT and demonstrate that earlier detection and treatment of these hemodynamic features will favour patients’evolution and, perhaps, reduce morbid-ity and mortalmorbid-ity.
Abbreviations
AHT:Antihypertensive; AMBP: 24 hours ambulatory blood pressure monitoring; Ar: Atrial reverse velocity; AUC: Area under the curve; BO: Blood pressure; BSA: Body surface area; CI: Confidence interval; CIn: Cardiac index; CKD: Chronic kidney disease; CO: Cardiac output; COPD: Chronic obstructive
pulmonary disease; CVP: Central venous pressure; DBP: Diastolic blood pressure; DT: Deceleration time; EKG: Electrocardiogram; FN: False negatives; FP: False positives; HR: Heart rate; HT: Hypertension; ICG: Impedance cardiography; IRVT: Isovolumic relaxation time; LCW: Left cardiac work; LCWI: Left cardiac work index; LV: Left ventricle; LVDD: Left ventricle diastolic dysfunction; LVEDP: Left ventricle end diastolic pressure; LVET: Left ventricle ejection time; MAP: Mean blood pressure; MRI: Magnetic resonance imaging; NPV: Negative predictive value; OSA: Obstructive sleep apnea;
PAOP: Pulmonary artery occlusion pressure; PEP: Pre-ejection period; PPV: Positive predictive value; ROC: Receiver-operating characteristic; SBP: Systolic blood pressure; STR: Systolic time ratio; SV: Stroke volume; SVI: Stroke volume index; TFC: Thoracic fluid content; TFI: Thoracic fluid index; TN: True negatives; TP: True positives; VEPT: Volume of electrically participating tissue; VI: Aorta velocity index; VSR: Vascular systemic resistence; VSRI: Vascular systemic resistance index
Acknowledgments
We would like to thank Ana Rita Víctor, António Sousa Guerreiro, José Rola, Luís Dias, Rui Ferreira, who contributed with their knowledge, expertise to the protocol design and allowed IMPEDDANS study to be successfully completed in the departments they lead. We also would like to thank the cardiopneumology technician Paula Ribeiro for her effort and dedication performing ICG exams and Pedro Rio and Júlio Calaça for their performance and availability in the realization and revision of echocardiograms, respectively.
Funding
This study has no funding.
Availability of data and materials
The data that support the findings of this study are available from Centro Hospitalar Lisboa Central–EPE but restrictions apply to the availability of these data, which were used under license for the current study, and so are not publicly available. Data are however available from the authors upon reasonable request and with permission of the patients and Centro Hospitalar Lisboa Central–EPE administration.
Authors’contributions
All authors contributed to the acquisition, analysis and interpretation of data. All authors drafted and revised the manuscript. They approve and agree to be accountable for all aspects of work.
Ethics approval and consent to participate
The study protocol was approved by the hospital’s Ethics Committee (approval number 166/2014). Informed consent was obtained from each patient.
Consent for publication
Patients gave consent to publication.
Competing interests
The authors declare that they have no competing interests.
Publisher’s Note
Springer Nature remains neutral with regard to jurisdictional claims in published maps and institutional affiliations.
Author details
1Unidade Funcional Medicina 1.2, Hospital de São José, Centro Hospitalar
Lisboa Central-EPE, Rua José António Serrano, 1150-199 Lisboa, Portugal.
2NOVA Medical School, Universidade NOVA de Lisboa, Lisboa, Portugal. 3Núcleo de Investigação Arterial, Unidade Funcional Medicina 4, Hospital
Santa Marta, Centro Hospitalar Lisboa Central-EPE, Lisboa, Portugal.
4Laboratório de Ecocardiografia, Serviço de Cardiologia, Hospital de Santa
Marta, Centro Hospitalar de Lisboa Central-EPE, Lisboa, Portugal.5Unidade de
Cardiologia, Hospital Pulido Valente, Centro Hospitalar Lisboa Norte-EPE, Lisboa, Portugal.6Gabinete de Análise Epidemiológica e Estatística, Centro de
Received: 9 August 2017 Accepted: 30 November 2017
References
1. Mills KT, Bundy JD, Kelly TN, Reed JE, Kearney PM, Reynolds K, Chen J, He J. Global disparities of hypertension prevalence and control: a systematic analysis of population-based studies from 90 countries. Circulation. 2016; 134(6):441–50.
2. Nazario Leao R, Marques da Silva P. Diastolic dysfunction in hypertension. Hipertens Riesgo Vasc. 2017;34(3):128–39.
3. Messerli FH, Rimoldi SF, Bangalore S. The transition from hypertension to heart failure: contemporary update. JACC Heart Fail. 2017;5:543. 4. Mancia G, Fagard R, Narkiewicz K, Redon J, Zanchetti A, Bohm M,
Christiaens T, Cifkova R, De Backer G, Dominiczak A, et al. 2013 ESH/ESC guidelines for the management of arterial hypertension: the task force for the management of arterial hypertension of the European Society of Hypertension (ESH) and of the European Society of Cardiology (ESC). Eur Heart J. 2013;34(28):2159–219.
5. Bour J, Kellett J. Impedance cardiography: a rapid and cost-effective screening tool for cardiac disease. Eur J Intern Med. 2008;19(6):399–405. 6. Ventura HO, Taler SJ, Strobeck JE. Hypertension as a hemodynamic disease:
the role of impedance cardiography in diagnostic, prognostic, and therapeutic decision making. Am J Hypertens. 2005;18(2 Pt 2):26S–43S. 7. Patterson RP. Fundamentals of impedance cardiography. IEEE Eng Med Biol
Mag. 1989;8(1):35–8.
8. Cybulski G, Strasz A, Niewiadomski W, Gasiorowska A. Impedance cardiography: recent advancements. Cardiol J. 2012;19(5):550–6. 9. Cybulski G. Ambulatory impedance cardiography: new possibilities. J Appl
Physiol (1985). 2000;88(4):1509–10.
10. Harvey S, Harrison DA, Singer M, Ashcroft J, Jones CM, Elbourne D, Brampton W, Williams D, Young D, Rowan K, et al. Assessment of the clinical effectiveness of pulmonary artery catheters in management of patients in intensive care (PAC-Man): a randomised controlled trial. Lancet. 2005;366(9484):472–7.
11. Richard C, Warszawski J, Anguel N, Deye N, Combes A, Barnoud D, Boulain T, Lefort Y, Fartoukh M, Baud F, et al. Early use of the pulmonary artery catheter and outcomes in patients with shock and acute respiratory distress syndrome: a randomized controlled trial. JAMA. 2003;290(20):2713–20. 12. Tang WH, Tong W. Measuring impedance in congestive heart failure:
current options and clinical applications. Am Heart J. 2009;157(3):402–11. 13. Zile MR, Brutsaert DL. New concepts in diastolic dysfunction and diastolic
heart failure: part I: diagnosis, prognosis, and measurements of diastolic function. Circulation. 2002;105(11):1387–93.
14. DeMarzo AP, Calvin JE. A new approach for low-cost noninvasive detection of asymptomatic heart disease at rest. Prev Cardiol. 2007;10(1):9–14. 15. DeMarzo AP. Using impedance cardiography with postural change to stratify
patients with hypertension. Ther Adv Cardiovasc Dis. 2011;5(3):139–48. 16. Talley RC, Meyer JF, McNay JL. Evaluation of the pre-ejection period as an
estimate of myocardial contractility in dogs. Am J Cardiol. 1971;27(4):384–91. 17. Martin CE, Shaver JA, Thompson ME, Reddy PS, Leonard JJ. Direct
correlation of external systolic time intervals with internal indices of left ventricular function in man. Circulation. 1971;44(3):419–31.
18. Sant Anna JRM. Valorização do período de pré-ejeção na dinâmica cardiovascular. Rev Bras Marcapasso e Arritmia. 1971;7(1):5–12. 19. Weber T, Auer J, O'Rourke MF, Punzengruber C, Kvas E, Eber B. Prolonged
mechanical systole and increased arterial wave reflections in diastolic dysfunction. Heart. 2006;92(11):1616–22.
20. Malfatto G, Branzi G, Giglio A, Villani A, Facchini C, Ciambellotti F, Facchini M, Parati G. Transthoracic bioimpedance and brain natriuretic peptide levels accurately indicate additional diastolic dysfunction in patients with chronic advanced systolic heart failure. Eur J Heart Fail. 2010;12(9):928–35. 21. CM Y, Wang L, Chau E, Chan RH, Kong SL, Tang MO, Christensen J, Stadler
RW, Lau CP. Intrathoracic impedance monitoring in patients with heart failure: correlation with fluid status and feasibility of early warning preceding hospitalization. Circulation. 2005;112(6):841–8.
22. New York Heart Association. Criteria C: nomenclature and criteria for diagnosis of diseases of the heart and great vessels. 7th ed. Boston: Little, Brown and Company; 1973.
23. Kane GC, Karon BL, Mahoney DW, Redfield MM, Roger VL, Burnett JC Jr, Jacobsen SJ, Rodeheffer RJ. Progression of left ventricular diastolic dysfunction and risk of heart failure. JAMA. 2011;306(8):856–63.
24. Owan TE, Hodge DO, Herges RM, Jacobsen SJ, Roger VL, Redfield MM. Trends in prevalence and outcome of heart failure with preserved ejection fraction. N Engl J Med. 2006;355(3):251–9.
25. Nagueh SF, Appleton CP, Gillebert TC, Marino PN, JK O, Smiseth OA, Waggoner AD, Flachskampf FA, Pellikka PA, Evangelisa A. Recommendations for the evaluation of left ventricular diastolic function by echocardiography. Eur J Echocardiogr. 2009;10(2):165–93.
26. DeLong ER, DeLong DM, Clarke-Pearson DL. Comparing the areas under two or more correlated receiver operating characteristic curves: a nonparametric approach. Biometrics. 1988;44(3):837–45.
27. Brutsaert DL, Sys SU. Diastolic dysfunction in heart failure. J Card Fail. 1997; 3(3):225–42.
28. Munagala VK, Hart CY, Burnett JC Jr, Meyer DM, Redfield MM. Ventricular structure and function in aged dogs with renal hypertension: a model of experimental diastolic heart failure. Circulation. 2005;111(9):1128–35. 29. Gaasch WH, Zile MR. Left ventricular diastolic dysfunction and diastolic heart
failure. Annu Rev Med. 2004;55:373–94.
30. Nishimura RA, Tajik AJ. Evaluation of diastolic filling of left ventricle in health and disease: Doppler echocardiography is the clinician's Rosetta Stone. J Am Coll Cardiol. 1997;30(1):8–18.
31. Nagueh SF, Smiseth OA, Appleton CP, Byrd BF 3rd, Dokainish H, Edvardsen T, Flachskampf FA, Gillebert TC, Klein AL, Lancellotti P, et al.
Recommendations for the evaluation of left ventricular diastolic function by echocardiography: an update from the American Society of
Echocardiography and the European Association of Cardiovascular Imaging. Eur Heart J Cardiovasc Imaging. 2016;17(12):1321–60.
32. Mitter SS, Shah SJ, Thomas JD. A test in context: E/A and E/e’to assess diastolic dysfunction and LV filling pressure. J Am Coll Cardiol. 2017;69(11):1451–64. 33. Andersen OS, Smiseth OA, Dokainish H, Abudiab MM, Schutt RC, Kumar A,
Sato K, Harb S, Gude E, Remme EW, et al. Estimating left ventricular filling pressure by echocardiography. J Am Coll Cardiol. 2017;69(15):1937–48. 34. Enriquez-Sarano M, Rossi A, Seward JB, Bailey KR, Tajik AJ. Determinants of
pulmonary hypertension in left ventricular dysfunction. J Am Coll Cardiol. 1997;29(1):153–9.
35. Galie N, Humbert M, Vachiery JL, Gibbs S, Lang I, Torbicki A, Simonneau G, Peacock A, Vonk Noordegraaf A, Beghetti M, et al. 2015 ESC/ERS guidelines for the diagnosis and treatment of pulmonary hypertension: the joint task force for the diagnosis and treatment of pulmonary hypertension of the European Society of Cardiology (ESC) and the European Respiratory Society (ERS): Endorsed by: Association for European Paediatric and Congenital Cardiology (AEPC), International Society for Heart and Lung Transplantation (ISHLT). Eur Heart J. 2016;37(1):67–119.
36. Moller JE, Hillis GS, JK O, Pellikka PA. Prognostic importance of secondary pulmonary hypertension after acute myocardial infarction. Am J Cardiol. 2005;96(2):199–203.
37. Neuman Y, Kotliroff A, Bental T, Siegel RJ, David D, Lishner M. Pulmonary artery pressure and diastolic dysfunction in normal left ventricular systolic function. Int J Cardiol. 2008;127(2):174–8.
• We accept pre-submission inquiries
• Our selector tool helps you to find the most relevant journal • We provide round the clock customer support
• Convenient online submission
• Thorough peer review
• Inclusion in PubMed and all major indexing services
• Maximum visibility for your research
Submit your manuscript at www.biomedcentral.com/submit
![Fig. 1 ICG waves in diastolic dysfunction (adapted from Bour et al. [5])](https://thumb-eu.123doks.com/thumbv2/123dok_br/15751228.638035/2.892.89.808.710.1069/fig-icg-waves-diastolic-dysfunction-adapted-bour-et.webp)
![Fig. 2 Practical approach to grade diastolic dysfunction (adapted from Nagueh et al. [25])](https://thumb-eu.123doks.com/thumbv2/123dok_br/15751228.638035/4.892.85.818.799.1067/fig-practical-approach-grade-diastolic-dysfunction-adapted-nagueh.webp)