451
The Effect of Institutional Development on
the Growth of Brazilian Firms
∗
Antonio Gledson de Carvalho
†
Contents: 1. Introduction; 2. The Data; 3. Growth Analysis; 4. Empirical Results; 5. Conclusions.
Keywords: Institutional Development; Firm’s Growth; Corruption; Inefficiency of the Judicial System.
JEL Code: D43; D63; D92.
Este artigo foca nos determinantes da taxa de crescimento das firmas no Brasil. Em particular, investigamos as características individuais das empresas que determinam o seu crescimento, como o desenvolvimento institucional afeta a performance da firma e como o desenvolvimento in-stitucional afeta de maneira diversa pequenas e grandes empresas. Nos-sos resultados, consistentemente com os modelos de crescimento, indicam que taxas de crescimento decrescem com a idade e tamanho da empresa. Conforme o esperado, empresas que pertencem a um grupo econômico, exportam ou mantêm operações no exterior crescem mais rapidamente. Crescimento é negativamente correlacionado com lucratividade. Observa-mos também que fraco desenvolvimento institucional, mensurado em ter-mos de corrupção e ineficiência do sistema judiciário e baixo desenvolvi-mento financeiro, tem impacto negativo sobre o crescidesenvolvi-mento das empre-sas. O impacto negativo da corrupção e ineficiência do sistema judiciário é mais acentuado em firmas menores. As grandes empresas são as que mais se beneficiam do desenvolvimento financeiro. No geral, nossos resul-tados indicam que o desenvolvimento institucional pode ser um mecan-ismo importante para a promoção do crescimento. Além do mais, o baixo desenvolvimento institucional tem o efeito perverso de promover a con-centração.
This article focuses on the determinants of firm’s growth in Brazil. In par-ticular it investigates the individual characteristics of firm that determine its
∗This article was developed under financial support from Worldbank, FAPESP (Project 03/08825-7) and CNPq (Project 477572/2003-0). Solange Kileber and Rodrigo Andrade Tolentino and Humberto Gabrielli are acknowledged for excellent re-search assistance. The author is grateful to Marcelo Resende, Ricardo Leal and two anonymous referees. Any errors or omissions are of my exclusive responsibility.
†FGV-EAESP, R. Itapeva, 474, 7o andar. CEP: 01332-000, São Paulo, SP, Brasil. Tel: (5511) 3281-7767. E-mail: gledson. [email protected]
452
Antonio Gledson de Carvalho
growth; how institutional development affects firm’s performance, and how in-stitutional development differently affects small and large firms. We find that, consistently with the learning models, growth is decreasing on age and nega-tively correlated to size. As expected, firms that belong to an economic group, export and maintain operations abroad grow faster. Growth is negatively cor-related to profitability. Furthermore, we observe that shortcomings in institu-tional development, when measured in terms of corruption, inefficiency of the judicial system and lack of financial development, have a negative impact on firms’ growth. This negative impact of corruption and inefficiency of the judi-cial system is stronger for smaller firms. Large firms benefit the most with finan-cial development. Overall our results indicate that improvement in institutions can be an important mechanism to promote growth. Furthermore, institutional underdevelopment has the perverse effect of promoting concentration.
1. INTRODUCTION
While it has been widely known that institutional development affects firms’ performance, little has been known about how institutional development differently affect small and large firms. This article aims at tackling this issue in the Brazilian context by studying the determinants of the growth of Brazilian firms and their relation with institutional development at the federal states level. More specifically we examine i) the correlation between firms growth and size; ii) the correlation between institutional development at the state level and firms’ growth; and iii) whether institutional development affect differently small and large firms.
Gibrat (1931) is commonly credited as the precursor of research on growth and size distribution of firms. According to hislaw of proportionate effect(LPE), firms grow following a random drawing from a distribution of growth rates. Models based on the LPE generate log-normal distributions that fit the firms size distributions found in developed countries (Ijiri and Simon, 1964). If LPE holds firms growth rate should be uncorrelated with factors such as size and age. However, many studies find a negative correlation between firms growth and size (Mansfield, 1962, Evans, 1987, Kumar, 1985, Dunne and Hughes, 1994, McPherson, 1996, Das, 1995), and between firms growth and age (Evans, 1987, Dunne and Hughes, 1994). Models of learning provide an explanation for the negative correlation between firm growth, and age and size (Lucas, 1978, Jovanovic, 1982, Pakes and Ericson, 1990).
For many developing countries, it has been detected a bimodal firm size distribution characterized by large number of small and large firms but a small number of medium size firms (Tybout (2000) reviews these empirical evidences). This bimodal distribution is not consistent with negative correlation between size and growth: if small firms grow faster than large ones, successful small firms would move up to the middle of the distribution and there would be no missing middle. These evidences suggest that for some countries there can be a positive correlation between size and growth. Using a sample of Côte d´Ivoire firms, Sleuwaegen and Goedhuys (2002) find positive correlation between growth and size that is consistent with the bimodal distribution.
In the Brazilian context, Resende (2004) investigates firm size distribution and rejects log-normality, consequently rejecting Gibrat’s LPE. Ribeiro (2007) and Esteves (2007) study the relation between firm size and growth on Brazil. Both authors find that that firm size and growth are negatively correlated.
Institutional Economics provides another reason, other than learning, relating growth and size: sev-eral theories relate firms’ performance to institutional development. For instance, finance theory sug-gests that market imperfections, such as conflict of interest and informational asymmetries between corporate insiders and investors, constrain firms in their ability to fund investment projects. The
453
The Effect of Institutional Development on the Growth of Brazilian Firms
tude of these imperfections depends on the level of institutional development: firms that wish to obtain external financing must be able to commit to controlling opportunistic behavior by corporate insid-ers. Outside capital suppliers use credit covenants and explicit fiduciary responsibilities to constrain opportunistic behavior by insiders. Institutional shortcomings such as ineffective judiciary system or pervasive corruption may restrict corporate insiders’ ability to commit to controlling opportunistic be-havior. Some empirical evidence support this point of view: Demirgüç-Kunt and Maksimovic (1998) find that firms in countries with developed financial institutions and efficient legal systems obtain more external financing than firms in countries with underdeveloped institution. Rajan and Zingales (1998) show that industries that are dependent on external finance grow faster in countries with more devel-oped financial systems. Wurgler (2000) finds that the rate at which resources are allocated to productive industries depends on the development of the financial system. Love (2001) shows that the sensitivity of investment to cash flow depends negatively on financial development.
Following the institutional insight, growth and size would be correlated when the lack of institutional development differently affects small and large firms. From a financial perspective, small firms could suffer the most with the lack of financial development because large firms are able to internalize many of the capital allocation functions carried out by the financial system. Some other non-financial arguments claim that large firms suffer less with the lack of institutional development because: 1) within the manufacturing sector policies favor large firms while inhibits the growth of small firms (Little, 1987). In some cases, investment incentives are available only to projects above a minimum scale. Anti-trust enforcement is typically weak and special tax breaks are sometimes meted out to large influential corporations (Gauthier and Gersovitz, 1997); 2) protectionist trade regimes are also more likely to favor large firms because these firms products compete more directly with imports, and because sectors with large firms lobby the government more effectively; 3) of lack of competition or enforcement of anti-trust regulation that give incumbent-large firms advantage; 4) of high sunk costs barriers that small firms have difficulty at facing, e.g., costs of dealing with dense regulatory regimes are fixed and the payoffs for doing so increases with the scale of operations (Levenson and Maloney, 1997). Tybout (2000) reviews this literature. However, as Beck et al. (2005) points out there is the possibility that weak institutions create greater obstacles to the growth of large firms. For instance, large firms are most likely to tax the resources of an underdeveloped financial or legal system, since they are more likely than small firms to depend on the long-term financing and on larger loans. Therefore, it is possible that financial development can disproportionately reduce the effects of institutional obstacles on the largest firms.
Following thisstructural-institutionalinsight, Beck et al. (2005) in a cross-country study covering 54 countries investigate the role of financial and legal constraints on growth. They found 1) that the smallest firms are the most constrained ones, and 2) financial and institutional development weakens the constraining effects of financial, legal and corruption obstacles faced by firms, and that this benefit is stronger for small firms.
This article pursues the same path of Beck et al. (2005) and Sleuwaegen and Goedhuys (2002). We study the determinants of growth for Brazilian firms and their relation with institutional development at the federal states level. Our results indicate that 1) consistently with learning models, younger firms grow faster; 2) corroborating Ribeiro (2007) and Esteves (2007) size and growth are negatively corre-lated; 3) firms that belong to an economic group, export and maintain operations abroad also grow at a faster rate; 4) profitability has a negative effect on growth; 5) weak institutional development such as pervasive corruption and inefficiency of the judicial system affect small firms more severely than large ones; and 6) financial development favor growth and large firms profit the most from it. The rest of this article is structured as follows: Section 2 describes the data; Section 3 presents the econometric models used; Section 4 presents the results; and Section 5 concludes.
454
Antonio Gledson de Carvalho
2. THE DATA
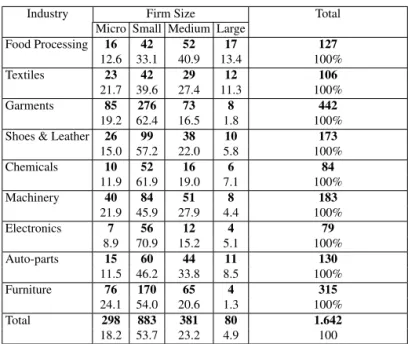
This paper is based on a unique data set created by the World Bank, theInvestment Climate Survey (ICS) with information on 1642 Brazilian firms with size ranging from 10 to 10.500 employees. The sample was drawn to be representative across size, industrial sectors, and macro-regions. For sampling purposes firms were stratified by number of employees according to the following rule:microfirms have 19 employees or less;small, between 20 and 99;medium, between 100 and 499; andlarge, 500 or more. The nine industrial sectors covered are food processing, textiles, garments, shoes & leather, chemicals, machinery, electronics, auto-parts, and furniture. Table 1 describes the sample across industries and size: micro firms comprise 18.2% of the sample; small, 53.7%; medium 23.2%; and large 4.9%. One should note that micro and small firms comprise 73.9% of the sample. The sectors that are most rep-resented are garments (26.9%) and furniture (19.2%), and the least reprep-resented are chemicals (5.1%) and electronics (4.8%). With respect to geographical distribution, the sample was stratified across 13 of the Brazilian states: Amazonas, Bahia, Ceará, Goiás, Maranhão, Minas Gerais, Mato Grosso, Paraíba, Paraná, Rio de Janeiro, Rio Grande do Sul, Santa Catarina, and São Paulo. One should note that all the five Brazilian macro-regions are represented. Table 2 presents the distribution of the sample across states. As expected there is a heavy concentration on the states of the southeast (Minas Gerais, 14.1%; Rio de Janeiro, 7.4%; and Sao Paulo, 21.9%) and south regions (Parana, 11.1%; Rio Grande do Sul, 11.6%; and Santa Catarina, 10.6%). Never can we overstress the importance of such a dataset: because of data availability, most studies on corporate issues in Brazil focus on large firms (sometimes only pub-licly traded firms). However, the number of pubpub-licly traded firms is too small and, furthermore, these firms are little representative of the Brazilian economy. Most of what we know about corporate issues in Brazil is based on the experience of large firms. Unfortunately, studies based on large firms can not provide answers about how certain factors affect differently small and large firms. Furthermore, the fact that the sample was stratified to be representative across size and industrial sectors and states minimizes concerns with sample biases.
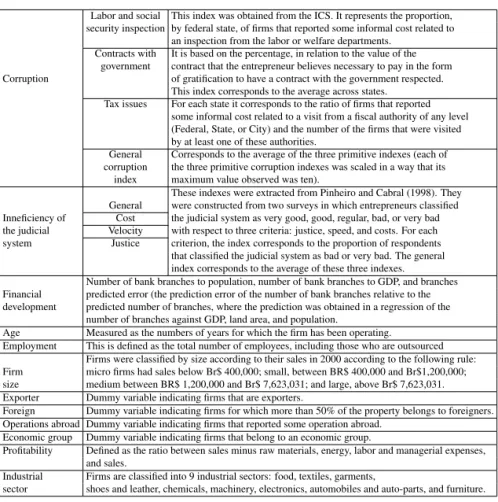
Using theInvestment Climate Survey(ICS) and other publicly available data we could compute some indexes that capture the institutional development at the state level for each of the 13 Brazilian states in our sample. From the ICS we obtained three primitive indexes measuring corruption: 1)corruption related to inspections of the Labor and Social Security Office: for each state, this index is calculated as the ratio between the number of firms that reported some informal cost related to an inspection from the Labor or Social Security Office and the number of firms that were inspected; 2)corruption in contracts with the government: based on the percentage that the entrepreneur believes it is necessary to pay in the form of gratification, in relation to the value of the contract, to have a contract with the government respected. This index is computed as the average opinion in the state; and 3)corruption in tax issues: for each state it correspond to the ratio of firms that reported some informal cost related to a visit from a fiscal authority of any level (Federal, State, or City) and the number of the firms that were visited by at least one of these authorities. A fourth index namedgeneral corruption indexcorresponds to the average1of the three primitive indexes.
The indexes for the inefficiency of the judicial system were borrowed from Pinheiro and Cabral (1998). These indexes were constructed from two surveys in which entrepreneurs classified the judicial system of their states as very good, good, regular, bad, and very bad with respect to three criteria: justice,velocity, andcost. For each criterion, the index corresponds to the proportion of respondents that classified the judicial system as bad or very bad. The general index was computed as the average of these three primitive indexes.
As indexes of financial development we use scaled measures of the number of branches of banks in the state for the year of 1996, namely bank branches-to-population, bank branches-to-GDP and
1To take the average, each of the three corruption primitive indexes was scaled in a way that its maximum value observed was
ten.
455
The Effect of Institutional Development on the Growth of Brazilian Firms
Table 1 –Sample Distribution Across Industries and Size
Industry Firm Size Total
Micro Small Medium Large
Food Processing 16 42 52 17 127
12.6 33.1 40.9 13.4 100%
Textiles 23 42 29 12 106
21.7 39.6 27.4 11.3 100%
Garments 85 276 73 8 442
19.2 62.4 16.5 1.8 100%
Shoes & Leather 26 99 38 10 173
15.0 57.2 22.0 5.8 100%
Chemicals 10 52 16 6 84
11.9 61.9 19.0 7.1 100%
Machinery 40 84 51 8 183
21.9 45.9 27.9 4.4 100%
Electronics 7 56 12 4 79
8.9 70.9 15.2 5.1 100%
Auto-parts 15 60 44 11 130
11.5 46.2 33.8 8.5 100%
Furniture 76 170 65 4 315
24.1 54.0 20.6 1.3 100%
Total 298 883 381 80 1.642
18.2 53.7 23.2 4.9 100
This table describes the sample of the Investment Climate Survey for Brazil. Only industrial firms were included. Firms are classified by size according to the number of employees (including outsourcing). Micro firms have 19 employees or less; small, between 20 and 99; medium, between100 and 499, large, 500 or more. Numbers in bold face are absolute, while the small ones represent percentages.
branches predicted error(calculated as the difference between the actual number of bank branches and the predicted2number of branches, divided by the predicted number of branches). The raw data used
to compute the financial development indexes were obtained from the Brazilian Central Bank, Institute for Applied Economic Research (IPEA) and Brazilian Institute for Geography and Statistics (IBGE).
Table 4 reports the institutional development indexes. Even though the rankings generated by each of the primitive indexes are different, some patterns can be observed. The states with worst performance in terms of corruption are Ceara, Rio de Janeiro (between the five states with worst performance in all rankings generated by the primitive indexes), and São Paulo and Parana (between the five states with worst performance in two rankings). The states with best performance in terms of corruption are Mato Grosso (between the five states with best performance in all rankings), and Santa Catarina, Rio Grande do Sul, Minas Gerais and Bahia (between the five states with best performance in two rankings). The states with best performance in terms of judicial system are Rio Grande do Sul (always between the five states with best performance), and Minas Gerais, Santa Catarina and Amazonas (between the five states with best performance in two rankings). Some of the states with worst judicial performance are Mato grosso (always between the five states with worst performance), and Ceara, Parana and Goiás (between the five states with worst performance in two rankings). Table 5 reports the correlation across indexes. One can observe that even though these indexes in blocks seek to measure the same aspects of institutional development, their correlation is considerably low inside groups (near 0.5) and generally very low across groups.
The ICS also contains other important variables characterizing individual firms: 1)age: numbers of years for which the firm has been operating; 2) operations abroad: a dummy variable indicating firms that reported some operation abroad; 3)exporter: a dummy variable indicating firms that export;
2The prediction was obtained in a regression of the number of branches against GDP, land area, and population.
456
Antonio Gledson de Carvalho
Table 2 –Sample Distribution Across States and Size
State Firm Size Total
Micro Small Medium Large
Amazonas 0 16 6 2 24
0 66.7 25.0 8.3 100
Bahia 18 48 9 1 76
23.7 63.2 11.8 1.3 100
Ceará 15 50 18 7 90
16.7 55.6 20.0 7.8 100
Goiás 23 45 12 3 83
27.7 54.2 14.5 3.6 100
Maranhão 4 15 6 0 25
16.0 60.0 24.0 0.0 100
Minas Gerais 43 120 58 11 232
18.5 51.7 25.0 4.7 100
Mato Grosso 13 16 9 0 38
34.2 42.1 23.7 0.0 100
Paraíba 11 26 9 1 47
23.4 55.3 19.1 2.1 100
Paraná 29 100 48 5 182
15.9 54.9 26.4 2.7 100
Rio de Janeiro 28 71 21 1 121
23.1 58.7 17.4 0.8 100
Rio Grande do Sul 24 93 61 12 190
12.6 48.9 32.1 6.3 100
Santa Catarina 36 78 46 14 174
20.7 44.8 26.4 8.0 100
São Paulo 54 205 78 23 360
15.0 56.9 21.7 6.4 100
Total 298 883 381 80 1.642
18.1 53.8 23.2 4.9 100
This table describes the sample of the Investment Climate Survey for Brazil. Only industrial firms were included. Firms are classified by size according to the number of employees (including outsourcing). Micro firms have 19 employees or less; small, between 20 and 99; medium, between100 and 499, large, 500 or more. Numbers in bold face are absolute, while the small ones represent percentages.
4) foreign: a dummy variable indicating firms for which more than 50% of the property belongs to foreigners; 5)economic group: a dummy variable indicating firms that belong to an economic group; and 6)profitability: ratio of profit to sales (profit was defined as sales minus raw materials, energy, labor and managerial expenses). Our endogenous variable, growth, was defined as the percentage change in firm sales between 2000 and 2002. Firms were classified by size according to their sales in 2000 according to the following rule:microfirms had sales below Br$ 400,000;small, between BR$ 400,000 and Br$1,200,000;mediumbetween BR$ 1,200,000 and Br$ 7,623,031; andlarge, above Br$ 7,623,031.
3. GROWTH ANALYSIS
Following Evans (1987) and Sleuwaegen and Goedhuys (2002), the basic model of growth can be stated as
St′ =G(St,At,X,ǫ)×St (1)
where:
St′ andStare the size of the firm in periodst′andt;
Atis the age of the firm in periodt;
X is a vector of institutional and firm specific characteristics, and;
457
The Effect of Institutional Development on the Growth of Brazilian Firms
Table 3 –Variables Description
Labor and social This index was obtained from the ICS. It represents the proportion, security inspection by federal state, of firms that reported some informal cost related to
an inspection from the labor or welfare departments. Contracts with It is based on the percentage, in relation to the value of the
government contract that the entrepreneur believes necessary to pay in the form Corruption of gratification to have a contract with the government respected.
This index corresponds to the average across states. Tax issues For each state it corresponds to the ratio of firms that reported
some informal cost related to a visit from a fiscal authority of any level (Federal, State, or City) and the number of the firms that were visited by at least one of these authorities.
General Corresponds to the average of the three primitive indexes (each of corruption the three primitive corruption indexes was scaled in a way that its
index maximum value observed was ten).
These indexes were extracted from Pinheiro and Cabral (1998). They General were constructed from two surveys in which entrepreneurs classified Inneficiency of Cost the judicial system as very good, good, regular, bad, or very bad the judicial Velocity with respect to three criteria: justice, speed, and costs. For each system Justice criterion, the index corresponds to the proportion of respondents
that classified the judicial system as bad or very bad. The general index corresponds to the average of these three indexes. Number of bank branches to population, number of bank branches to GDP, and branches Financial predicted error (the prediction error of the number of bank branches relative to the development predicted number of branches, where the prediction was obtained in a regression of the
number of branches against GDP, land area, and population.
Age Measured as the numbers of years for which the firm has been operating. Employment This is defined as the total number of employees, including those who are outsourced
Firms were classified by size according to their sales in 2000 according to the following rule: Firm micro firms had sales below Br$ 400,000; small, between BR$ 400,000 and Br$1,200,000; size medium between BR$ 1,200,000 and Br$ 7,623,031; and large, above Br$ 7,623,031. Exporter Dummy variable indicating firms that are exporters.
Foreign Dummy variable indicating firms for which more than 50% of the property belongs to foreigners. Operations abroad Dummy variable indicating firms that reported some operation abroad.
Economic group Dummy variable indicating firms that belong to an economic group.
Profitability Defined as the ratio between sales minus raw materials, energy, labor and managerial expenses, and sales.
Industrial Firms are classified into 9 industrial sectors: food, textiles, garments,
sector shoes and leather, chemicals, machinery, electronics, automobiles and auto-parts, and furniture.
ǫis a stochastic term.
Expression 1 can be rearranged into
St′
St
=G(St,At,X,ǫ) (2)
The partial derivativesGS,GA andGX allow to test for alternative theories of growth. Gibrat’s
LPE requires GS,GA andGX to be null. Alternatively, learning models of firm growth (e.g., Lucas
(1978), Jovanovic (1982), Pakes and Ericson (1990)) and efficient scale arguments imply thatGS <0
andGA<0. Finally there are the structural/institutional conjectures that predict thatGX 6= 0.
One should note that the theory does not predict the structural form ofG. Some authors, e.g. Evans (1987) and Sleuwaegen and Goedhuys (2002), use a logarithm approach such as G(St, At,X,ǫ) =
g(St, At)×exp(bX)×ǫ. However, some other authors use different forms. Following Beck et al.
(2005), we assume some aditivity forG: we express growth(St′/St)as the percentage change in firm
sales, and size(St)as the logarithm of sales. This is done to account for non-linearity in the effect of
size. As in Sleuwaegen and Goedhuys (2002) we included the age of the firm and the square of this variable to allow for diminishing returns on the learning process. The econometric models used for the analysis of growth are:
F irm Growth=α+λ Size+ϕ1Age+ϕ2Age2+γ controls+ǫ (Model 1)
458
Antonio
Gledson
de
Carv
alho
Table 4 –Indexes of Institutional and Financial Development by State
Corruption Inefficiency of Judicial System Financial Developnent
State Labor and Contracts Corruption General Cost Velocity Justice General Branches/ Branches/ Branches GDP
welfare with in tax index POP GDP forecast per
inspections government issues error capita
Amazonas 0.0 12.5 17.7 4.50 0.60 0.60 0.2 0.47 5.2 1.1 -0.22 4.84
Bahia 0.29 10.6 1.9 3.44 0.49 0.82 0.46 0.59 6.2 2.1 -0.17 2.98
Ceará 0.58 16.8 20.3 7.90 0.38 1.00 0.38 0.59 5.3 2.3 -0.26 2.31
Goiás 0.23 15.4 4.9 4.51 0.60 0.87 0.27 0.58 12.3 2.9 0.42 4.08
Maranhão 0.0 12.5 5.0 3.05 0.50 1.00 0.25 0.58 5.0 2.6 -0.21 1.67
Minas Gerais 0.25 9.9 3.0 3.28 0.39 0.87 0.23 0.50 10.9 2.0 0.12 5.36
Mato Grosso 0.0 9.0 3.4 2.17 0.67 1.00 0.33 0.67 10.9 2.4 0.42 4.40
Paraíba 0.0 12.2 4.6 2.95 0.75 0.75 0.25 0.58 5.1 2.3 -0.30 2.10
Paraná 0.42 11.4 12.5 5.32 0.51 0.93 0.27 0.57 13.9 2.3 0.33 5.93
Rio de Janeiro 0.25 13.5 29.2 6.98 0.52 0.91 0.22 0.55 10.0 1.3 -.016 7.47
Rio Grande do Sul 0.11 8.7 1.2 2.29 0.41 0.82 0.17 0.47 14.4 2.2 0.30 6.61
Santa Catarina 0.0 14.3 2.7 3.15 0.40 0.89 0.21 0.50 16.3 2.8 0.54 5.76
São Paulo 0.86 11.7 12.1 7.04 0.33 0.91 0.24 0.49 14.1 1.4 -0.01 10.08
RBE
Rio
de
Janeiro
v.
62
n.
4
/
p.
451–466
Out-Dez
459
The
Ef
fect
of
Institutional
De
v
elopment
on
the
Gro
wth
of
Brazilian
Firms
Table 5 –Correlation Across State Indexes
Corruption Inefficiency of judicial system Financial development
Labor and Contracts Corruption General Cost Velocity Justice General Branches / Branches / Branches forecast GDP
welfare with in tax index index POP GDP error per capita
inspections government issues
Labor and welfare 0.21 0.36 0.77*** -0.60** 0.31 0.26 -0.11 0.20 -0.28 -0.14 0,48*
inspections
Contracts with 0.21 0.48* 0.61** -0.08 0.13 0.11 0.07 -0.19 0.18 -0.20 -0,24
Corruption government
Corruption in 0.36 0.48* 0.83*** -0.08 0.01 -0.07 -0.07 -0.21 -0.61** -0.45 0,26
tax issues
General index 0.77*** 0.61** 0.83*** -0.38 0.21 0.13 -0.79 -0.05 -0.43 -0.36 0,33
Cost -0.60** -0.08 -0.08 -0.38 -0.32 0.06 0.52* -0.40 0.12 -0.10 -0,47
Inefficiency Velocity 0.31 0.13 0.01 0.21 -0.32 0.30 0.54* 0.22 0.46 0.25 -0,02
of judicial Justice 0.26 0.11 -0.07 0.13 0.06 0.30 0.68** -0.41 0.21 -0.23 0,42
system General Index -0.11 0.07 -0.07 -0.79 0.52* 0.54* 0.68** -0.32 0.47 -0.01 -0,55*
Branches / POP 0.20 -0.19 -0.21 -0.05 -0.40 0.22 -0.41 -0.32 0.19 0.85*** 0,75***
branches / GDP -0.28 0.18 -0.61** -0.43 0.12 0.46 0.21 0.47 0.19 0.51 -0,50*
Financial branches -0.14 -0.20 -0.45 -0.36 -0.10 0.25 -0.23 -0.01 0.85*** 0.51 0,33
forecast error
development GDP per capita 0,48* -0,24 0,26 0,33 -0,47 -0,02 0.42 -0,55* 0,75*** -0,50* 0,33
*, **, and *** indicate statistical significance levels of 10, 5, and 1% respectively (2-tailed)
RBE
Rio
de
Janeiro
v.
62
n.
4
/
p.
451–466
Out-Dez
460
Antonio Gledson de Carvalho
F irm Growth=α+λ Size+ϕ1Age+ϕ2Age2+β Institutional Index
+γ controls ǫ (Model 2a)
F irm Growth=α+λ Size+ϕ1Age+ϕ2Age2+β Institutional Index
∗F irm Size+γ controls ǫ (Model 2b)
Model 1 is used to identify the effect individual characteristics of the firm on its growth. Model 2a assesses whether institutional development at the state level influences the growth of the firms. Model 2b is crafted to capture how institutional development at the state level differently affects small and large firms.
As pointed out in Moulton (1990), ordinary least squares inferences of aggregate variables based on micro data can lead to standard errors that are biased downward. To avoid such a problem we use ordinary least squares with robust errors. To minimize the impact of outliers, the dependent variable was winsorized at a lower bound of -50% (39 observations were winsorized) and an upper bound of 500% (13 observations were winsorized).
The individual characteristics of the firm included in all the regressions are size, age and other operational characteristics (whether the firm maintains operations abroad, exports, is controlled by for-eigners, belongs to an economic group and its profitability). In all the models we include industrial sector dummy variables as control. In Models 2a and 2b, we also control for the GDP per capita of the state in which the firm is located.
Survivorship bias is an all important issue in the study of firm’s growth (Audretsch et al., 2004): negative growth for a large firm means that the firm will be smaller in periodtthan it was in period
t−1but it will likely survive. Negative growth for a small firm may imply bankruptcy. Therefore, the higher propensity for low-growth small firms to exit vis-à-vis low-growth large firms tends create a bias because the small firms in the sample (the surviving ones) will tend to present high growth rates. Large firms are more likely to survive to a series of low growth periods than small firms are. Hence the longer the period over which growth is analyzed, the more severe is the survivorship bias. This present study, by analyzing growth over a two-year period, minimizes this survivorship bias.
4. EMPIRICAL RESULTS
Tables 6 to 9 present the empirical estimations for Models 1, 2a and 2b. Regressions in Table 6 include only variables characterizing individual firms. Consistently with learning models, firms’ growth decreases with age at a decreasing rate: the coefficient associated to variableageis negative, while the one associated to the square of variable age is positive – both are statistically significant at the 1% level. Confirming the findings of Ribeiro (2007) and Esteves (2007), growth decreases with size: the coefficient associate to size is negative and statistically significant at the 1% level. Firms that belong to an economic group, export and maintain operations abroad also grow at a faster rate: the coefficients associated to variableseconomic group, exporter, operations abroadare positive and statistically sig-nificant at the 5 or 1% levels. Foreign ownership fails to present sigsig-nificant effect on growth. Finally, profitability has a negative effect on growth that is statistically significant at the 1% level.
Tables 7 to 9 report the effects of institutional development on firms’ growth. Regressions 1, 3, 5, and 7 in Table 7 indicate that corruption has a negative effect on firms growth, regardless of the index considered. Only the index related to corruption in contracts with government fails to present statistical significance (the other three indexes are statistically significant at the 5% level). In Regressions 2, 4, 6, and 8 the index of corruption interacts with the size of the firm, categorized as micro, small, medium and large. In general the negative effect of corruption on growth is stronger for micro and small firms. For three of the indexes the coefficient is negative and statistically significant for micro or small firms. It is never statistically significant for medium or large firms.
461
The Effect of Institutional Development on the Growth of Brazilian Firms
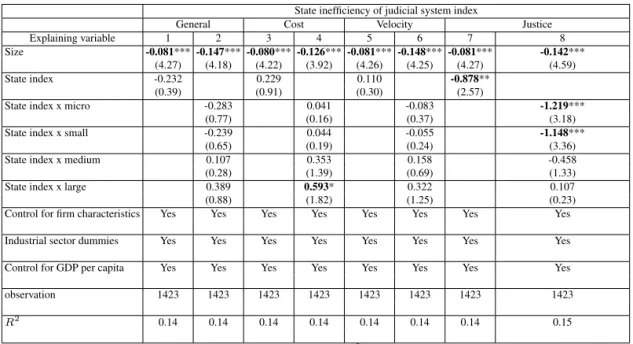
Table 8 reports the effects of the inefficiency of the judicial system. Regressions 1, 3, 5 and 7 assess the effect of the different indexes for the inefficiency of the judicial system. Only in Regression 7, index ofJustice, the coefficient presents statistical significance, indicating a negative effect on growth. Regressions 2, 4, 6, and 8 include the interaction between the indexes and the size of the firm. We find statistical significance for the indexes ofJusticeandCost. Regression 4 indicates that when the costs are higher, large firms grow faster. Regression 8 indicates that when the quality of arbitration is low, index ofjustice, smallest firms suffer the most. These results reinforce the idea that smallest firms are the ones that suffer the most with the lack of institutional development.
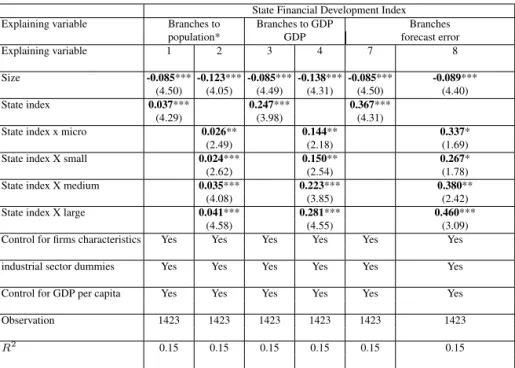
Finally, Table 9 investigates the role of financial development. In Regressions 1, 3, and 5 the finan-cial development indexes present positive sign that is statistically significant at the 1% level indicating that financial development at the state level speeds growth. In Regressions 2, 4 and 6 the financial indexes interact with the size of firms. In Regressions 2, 4 and 6 all the interactions are positive and statistically significant indicating a monotonic pattern: all firms benefit of financial development and largest firms benefit the most.
Table 6 –Effects of Size and Age on Firm Growth
Explaining Regressions
variable 1 2 3 4
Size -0.098*** -0.098*** -0.081*** -0.082***
(5.42) (5.47) (4.29) (4.36) Age -0.549*** -0.547*** -0.538*** -0.535***
(4.98) (4.99) (4.67) (4.67) Age2 0.067*** 0.067*** 0.065*** 0.064***
(4.17) (4.17) (3.88) (3.87) Econ. Group 0.336*** 0.329*** 0.310*** 0.301***
(2.87) (2.81) (2.58) (2.52) Exporter 0.256*** 0.257*** 0.239*** 0.240***
(4.25) (4.25) (3.89) (3.90)
Foreing -0.035 -0.038
(0.22) (0.23)
Operations Abroad 0.199*** 0.192*** 0.189*** 0.183*** (2.08) (2.13) (2.00) (2.04) Profitability -0.393*** -0.392***
(3.73) (3.73) industrial sector Yes Yes Yes Yes dummies
observation 1505 1505 1423 1423
R2 0.13 0.13 0.14 0.14
The estimated model isF irm Growth=α+λSize+ϕ1Age+ϕ2Age2+ γ controls+ǫ. Growth was computed as the average of sales growth for two pe-riods, 2000-2001 and 2001-2002. Size is measured as the natural logarithm of sales. Age is the number of years the firms has been operating, Economic Group, Exporter, Foreign and Operations abroad are dummy variables indicating, respectively, whether the firm is part of an economic group, exports, is controlled by foreigners and maintains operations abroad. Profitability is defined as sales minus raw materials, energy, labor and managerial expenses. The results were obtained using OLS with robust errors. All regressions include dummy variables for industry sectors (not reported in the table). For each variable we report the coefficient and the t-statistic in parenthesis. *, **, and *** indicate statistical significance levels of 10, 5, and 1% respectively.
5. CONCLUSIONS
In this article we investigated 1) the determinants of firm growth in Brazil; 2) the correlation between institutional development at the state level and firms’ growth; and 3) how institutional development dif-ferently affect small and large firms. This investigation was possible due to a unique dataset (the Invest-ment Climate Survey of the World Bank) that contains detailed information on firms’ characteristics such
462
Antonio Gledson de Carvalho
Table 7 –Influence of Corruption on Firm Growth
State corruption index
General Corruption in labor Bonifications in contracts Corruption in corruption index and welfare inspections with government tax issues
Explaining variable 1 2 3 4 5 6 7 8
Size -0.081***-0.120***-0.080*** -0.099*** -0.081*** -0.143*** -0.082*** -0.091*** (4.30) (4.62) (4.25) (4.56) (4.26) (4.49) (4.33) (4.33) Corruption -0.027** -0.002** -0.003 -0.005**
(2.31) (2.23) (0.27) (2.04)
Corruption x micro -0.042** -0.003* -0.013 -0.006
(2.52) (1.77) (1.25) (1.18)
Corruption x small -0.047*** -0.004*** -0.011 -0.010***
(3.39) (3.21) (1.28) (2.91)
Corruption x medium -0.017 -0.001 0.004 -0.002
(1.32) (1.18) (0.39) (0.65)
Corruption x large 0.000 -0.000 0.016 -0.002
(0.00) (0.35) (1.37) (0.31)
Control for firm Yes Yes Yes Yes Yes Yes Yes Yes
characteristics
industrial sector Yes Yes Yes Yes Yes Yes Yes Yes dummies
Control for GDP Yes Yes Yes Yes Yes Yes Yes Yes
per capita
Observation 1423 1423 1423 1423 1423 1423 1423 1423
R2 0.14 0.14 0.14 0.14 0.14 0.14 0.14 0.14
The estimated models areF irm Growth=α+λSize+ϕ1Age+ϕ2Age2+β InstitutionalIndex+γ controls+ǫ(regressions
with odd number) orF irm Growth=α+λSize+ϕ1Age+ϕ2Age2+β InstitutionalIndex∗F irmSize+γ controls+ǫ
(regressions with even number). Growth was computed as the average of sales growth for two periods, 2000-2001 and 2001-2002. Size is measured as the natural logarithm of sales. Micro firms had sales in 2000 below Br$ 400,000; small, between BR$ 400,000 and Br$1,200,000; medium between BR$ 1,200,000 and Br$ 7,623,031; and large, above Br$ 7,623,031. The control variables (not reported in the table) are: the number of years the firms has been operating; dummy variables indicating whether the firm belongs to an economic group, exports, is controlled by foreigners, and has operations abroad; the GDP per capita of the state where the firm is located; and the firm profitability. The results were obtained using OLS with robust errors. All regressions include dummy variables for industry sectors. For each variable we report the coefficient and the t-statistic in parenthesis.
*, **, and *** indicate statistical significance levels of 10, 5, and 1% respectively.
as age, size, whether the firm maintains operation abroad, exports, is controlled by foreigners, belongs to an economic group, and its profitability. This dataset contains information on 1642 firms stratified across size, 13 federal states and 9 industrial sectors. Our results indicate that, consistently with the learning models, growth is decreasing on age. Corroborating Ribeiro (2007) and Esteves (2007), we found that growth is negatively correlated to size. As expected, firms that belong to an economic group, export and maintain operations abroad grow faster. Growth is negatively correlated to profitability.
Further investigating the relation between institutional factors and growth, we found that shortcom-ings of institutional development, when measured in terms of corruption and inefficiency of the judicial system have a negative impact on firm growth. Financial development at the states level has a positive effect on growth. When examining how institutional development differently affect small and large firms, we found that while smallest firms are those who suffer the most with corruption and inefficiency of the judicial system, largest firms are the one that profit the most from financial development.
Overall our results indicate that improvement in institutions can be an important mechanism to promote growth. Furthermore, institutional underdevelopment has the perverse effect of promoting concentration.
463
The Effect of Institutional Development on the Growth of Brazilian Firms
Table 8 –Influence of the Efficiency of the Judicial System on Firms’ Growth
State inefficiency of judicial system index
General Cost Velocity Justice
Explaining variable 1 2 3 4 5 6 7 8
Size -0.081***-0.147***-0.080***-0.126***-0.081***-0.148***-0.081*** -0.142*** (4.27) (4.18) (4.22) (3.92) (4.26) (4.25) (4.27) (4.59)
State index -0.232 0.229 0.110 -0.878**
(0.39) (0.91) (0.30) (2.57)
State index x micro -0.283 0.041 -0.083 -1.219***
(0.77) (0.16) (0.37) (3.18)
State index x small -0.239 0.044 -0.055 -1.148***
(0.65) (0.19) (0.24) (3.36)
State index x medium 0.107 0.353 0.158 -0.458
(0.28) (1.39) (0.69) (1.33)
State index x large 0.389 0.593* 0.322 0.107
(0.88) (1.82) (1.25) (0.23)
Control for firm characteristics Yes Yes Yes Yes Yes Yes Yes Yes
Industrial sector dummies Yes Yes Yes Yes Yes Yes Yes Yes
Control for GDP per capita Yes Yes Yes Yes Yes Yes Yes Yes
observation 1423 1423 1423 1423 1423 1423 1423 1423
R2 0.14 0.14 0.14 0.14 0.14 0.14 0.14 0.15
The estimated models areF irm Growth=α+λ Size+ϕ1Age+ϕ2Age2+β Institutional Index+γ controls+ǫ(regressions
with odd number) orF irm Growth=α+λ Size+ϕ1Age+ϕ2Age2+β Institutional Index∗F irmSize+γ controls+ǫ
(regressions with even number).Growthwas computed as the average of sales growth for two periods, 2000-2001 and 2001-2002. Size is measured as the natural logarithm of sales. Micro firms had sales in 2000 below Br$ 400,000;small, between BR$ 400,000 and Br$1,200,000;
mediumbetween BR$ 1,200,000 and Br$ 7,623,031; andlarge, above Br$ 7,623,031. The control variables (not reported in the table) are: the number of years the firms has been operating; dummy variables indicating whether the firm belongs to an economic group, exports, is controlled by foreigners, and has operations abroad; the GDP per capita of the state where the firm is located; and the firm profitability. The results were obtained using OLS with robust errors. All regressions include dummy variables for industry sectors. For each variable we report the coefficient and the t-statistic in parenthesis.
*, **, and *** indicate statistical significance levels of 10, 5, and 1% respectively.
464
Antonio Gledson de Carvalho
Table 9 –Influence of Financial Development on Firms’ Growth
State Financial Development Index Explaining variable Branches to Branches to GDP Branches
population* GDP forecast error
Explaining variable 1 2 3 4 7 8
Size -0.085***-0.123***-0.085***-0.138***-0.085*** -0.089*** (4.50) (4.05) (4.49) (4.31) (4.50) (4.40) State index 0.037*** 0.247*** 0.367***
(4.29) (3.98) (4.31)
State index x micro 0.026** 0.144** 0.337*
(2.49) (2.18) (1.69)
State index X small 0.024*** 0.150** 0.267*
(2.62) (2.54) (1.78)
State index X medium 0.035*** 0.223*** 0.380**
(4.08) (3.85) (2.42)
State index X large 0.041*** 0.281*** 0.460***
(4.58) (4.55) (3.09)
Control for firms characteristics Yes Yes Yes Yes Yes Yes
industrial sector dummies Yes Yes Yes Yes Yes Yes
Control for GDP per capita Yes Yes Yes Yes Yes Yes
Observation 1423 1423 1423 1423 1423 1423
R2 0.15 0.15 0.15 0.15 0.15 0.15
The estimated models areF irm Growth=α+γ Size+ϕ1Age+ϕ2Age2+βInstitutional Index+ γ controls+ǫ(regressions with odd number) orF irmaGrowth=α+γ Size+ϕ1Age+ϕ2Age2+ β Institutional Index∗F irm Size+γ controls+ǫ(regressions with even number). Growthwas computed as the average of sales growth for two periods, 2000-2001 and 2001-2002. Size is measured as the natural logarithm of sales. Micro firms had sales in 2000 below Br$ 400,000;small, between BR$ 400,000 and Br$1,200,000;
mediumbetween BR$ 1,200,000 and Br$ 7,623,031; andlarge, above Br$ 7,623,031.The control variables (not re-ported in the table) are: the number of years the firms has been operating; dummy variables indicating whether the firm belongs to an economic group, exports, is controlled by foreigners, and has operations abroad; the GDP per capita of the state where the firm is located; and the firm profitability. The results were obtained using OLS with ro-bust errors. All regressions include dummy variables for industry sectors. For each variable we report the coefficient and the t-statistic in parenthesis.
*, **, and *** indicate statistical significance levels of 10, 5, and 1% respectively.
465
The Effect of Institutional Development on the Growth of Brazilian Firms
BIBLIOGRAPHY
Audretsch, D., Klomk, L., Santarelli, E., & Thurik, A. R. (2004). Gribrat’s law: Are the services different. Review of Industrial Organization, 24:301–324.
Beck, T., Demirguc-Kunt, A., & Maksimovic, V. (2005). Financial and legal constraints to firm growth: Does firm size matter? Journal of Finance, 60:137–177.
Das, S. (1995). Size, age and firm growth in an infant industry: The computer hardware industry in India. International Journal of Industrial Organization, 13:111–126.
Demirgüç-Kunt, A. & Maksimovic, V. (1998). Law, finance and firm growth. Journal of Finance, 53:2107–2137.
Dunne, P. & Hughes, A. (1994). Age, size, growth and survival: UK companies in the 1980s. The Journal of Industrial Economics, 42:115–140.
Esteves, L. A. (2007). A note on Gibrat’s law, Gibrat’s legacy and firm growth: Evidence from Brazilian companies.Economic Bulletin, 12(19):1–7.
Evans, D. (1987). The relationship between firm growth, size and age: Estimates for 100 manufacturing industries. The Journal of Industrial Economics, 35:567–582.
Gauthier, B. & Gersovitz, M. (1997). Revenue erosion through tax exemption and evasion in poor countries.Journal of Public Economics, 63:404–424.
Gibrat, R. (1931).Les Inégalités Économiques. Sirey, Paris.
Ijiri, Y. & Simon, H. (1964). Business firm growth and size.The American Economic Review, 54:77–89.
Jovanovic, B. (1982). Selection and the evolution of industry. Econometrica, 50:649–670.
Kumar, M. S. (1985). Growth, acquisition activity and firm size: Evidence from United Kingdom. The Journal of Industrial Economics, 33:327–338.
Levenson, A. & Maloney, W. (1997). The informal sector: Firm dynamics and institutional participation. Technical report, University of Illinois.
Little, I. (1987). Small manufacturing enterprises in developing countries. World Bank Economic review, 1:203–236.
Love, I. (2001). Financial development and financial constraints: International evidence from the struc-tural investment model. Technical Report 2694, World Bank.
Lucas, R. E. (1978). On the size distribution of business firms. The Bell Journal of Economics, 9:508– 523.
Mansfield, E. (1962). Entry, Gibrat´s law, innovation and the growth of firms. The American Economic Review, 52:1023–1051.
McPherson, M. A. (1996). Growth of micro and small enterprises in Southern Africa. Journal of Development Economics, 48:253–277.
Moulton, B. R. (1990). An illustration of a pitfall in estimating the effects of aggregate variables on micro units. Review of Economics and Statistics, 72(2):334–338.
466
Antonio Gledson de Carvalho
Pakes, A. & Ericson, R. (1990). Empirical implications of alternative models of firm dynamics. Tech-nical report, Columbia University.
Pinheiro, A. C. & Cabral, C. (1998). Mercado de crédito no Brasil: O papel do judiciário e de outras instituições. Technical Report 9, BNDES.
Rajan, R. & Zingales, L. (1998). Financial dependence and growth. American Economic Review, 88:559–586.
Resende, M. (2004). Lei de Gibrat na indústria brasileira: Evidência empírica. Economia, 2(5):221– 268.
Ribeiro, E. P. (2007). The dynamics of firm size distribution. Brazilian Review of Econometrics, 27:250–272.
Sleuwaegen, L. & Goedhuys, M. (2002). Growth of firms in developing countries, evidence from Côte d´Ivoire.Journal of Development Economics, 68:117–135.
Tybout, J. (2000). Manufacturing firms in developing countries: How well do they do and why.Journal of Economic Literature, 38:11–44.
Wurgler, J. (2000). Financial markets and the allocation of capital. Journal of Financial Economics, 58:187–214.