ISSN 0100-879X
BIOMEDICAL SCIENCES
AND
CLINICAL INVESTIGATION
www.bjournal.com.br
www.bjournal.com.br
Volume 43 (01) 1-123 January 2010
Braz J Med Biol Res, January 2010, Volume 43(1) 17-24
A DNA enzyme targeting Egr-1 inhibits rat vascular smooth
muscle cell proliferation by down-regulation of cyclin D1 and
TGF-β1
Y. Wu, W. Han and G.-N. Liu
Institutional Sponsors
A DNA enzyme targeting Egr-1 inhibits rat
vascular smooth muscle cell proliferation by
down-regulation of cyclin D1 and TGF-β1
Y. Wu, W. Han and G.-N. Liu
Department of Cardiology, The First Affiliated Hospital of China Medical University, Shenyang, China
Abstract
We have demonstrated that a synthetic DNA enzyme targeting early growth response factor-1 (Egr-1) can inhibit neointimal hyperplasia following vascular injury. However, the detailed mechanism of this inhibition is not known. Thus, the objective of the present study was to further investigate potential inhibitory mechanisms. Catalytic DNA (ED5) and scrambled control DNA enzyme (ED5SCR) were synthesized and transfected into primary cultures of rat vascular smooth muscle cells (VSMCs).
VSMC proliferation and DNA synthesis were analyzed by the MTT method and BrdU staining, respectively. Egr-1, TGF-β1,
p53, p21, Bax, and cyclin D1 expression was detected by RT-PCR and Western blot. Apoptosis and cell cycle assays were
performed by FACS. Green fluorescence could be seen localized in the cytoplasm of 70.6 ± 1.52 and 72 ± 2.73% VSMCs 24 h after transfection of FITC-labeled ED5 and ED5SCR, respectively. We found that transfection with ED5 significantly inhibited
cultured VSMC proliferation in vitro after 24, 48, and 72 h of serum stimulation, and also effectively decreased the uptake of
BrdU by VSMC. ED5 specifically reduced serum-induced Egr-1 expression in VSMCs, further down-regulated the expression of cyclin D1 and TGF-β1, and arrested the cells at G0/G1, inhibiting entry into the S phase. FACS analysis indicated that there
was no significant difference in the rate of apoptosis between ED5- and ED5SCR-transfected cells. Thus, ED5 can specifically
inhibit Egr-1 expression, and probably inhibits VSMC proliferation by down-regulating the expressions of cyclin D1 and TGF-β1.
However, ED5 has no effect on VSMC apoptosis.
Key words: DNA enzyme; Egr-1; VSMC; Proliferation; Apoptosis
Introduction
Correspondence: G.-N. Liu, Department of Cardiology, The First Affiliated Hospital of China Medical University, Shenyang 110001, China. Fax: +86-24-2328-1638. E-mail: [email protected]
Received August 12, 2009. Accepted November 10, 2009. Available online November 23, 2009. Published January 11, 2010.
Although atherogenesis, percutaneous transluminal coronary angioplasty, and the subsequent anastomotic restenosis of the vasculature is a complicated pathological process involving multiple factors (1-3), the over-production of extracellular matrix by smooth muscle cells of the in-jured vessel, their hyperproliferation and their migration to the intima play a key role in lesion formation (4). Local endogenous early growth response factor-1 (Egr-1) is rapidly expressed and activated following vascular injury
(5). Egr-1, an immediate-early gene product and zinc finger
transcription factor, regulates the expression of multiple
proliferation-associated genes (6,7), and Egr-1 levels closely
correlate with cell proliferation (8). Deoxyribozyme (DNA enzyme, DRz) is a small single-stranded DNA fragment
with enzymatic activity that cleaves specific RNA strands
thereby regulating protein expression. In a previous study,
we synthesized a specific DRz targeting rat Egr-1 mRNA
(DNA enzyme/10-23 DRz, ED5), and transfected it into
the rat carotid following balloon injury. We found that ED5 could inhibit neointimal hyperplasia (9) although the detailed mechanism underlying the inhibition was unclear. In the present study, we further analyzed the ED5-transfected vascular smooth muscle cells (VSMCs) by measuring
the levels of Egr-1, TGF-β1, p53, p21, Bax, and cyclin
D1 expression, changes in the cell cycle, apoptosis, cell proliferation, and DNA synthesis.
Material and Methods
VSMC isolation and primary culture
Rat primary aortic VSMCs were isolated as described
previously (10). Briefly, Wistar rats (120 g, purchased from the Experimental Center, China Medical University) were sacrificed with excess anesthesia. The intima was peeled
18 Y. Wu et al.
transferred to a 35-mm plate and barely covered with DMEM
supplemented with 20% FBS (Gibco-BRL, USA). The tissue blocks were cultured at 37°C in a humid atmosphere of 5%
CO2. After 2 weeks, cells that had migrated onto the tissue
culture dish were collected by trypsinization and subcultured successively; cells were used from the fourth to the eighth
passage. Culture homogeneity was confirmed by staining for smooth muscle actin and was confirmed when staining exceeded 98% (Figure 1).
ED5 synthesis and transfection
The catalytic DNA, ED5, and scrambled control DNA enzyme, ED5SCR, were synthesized by Takara (China). The sequences were as follows: ED5 5’-CCGCTGCCAGG CTAGCTACAACGACCCGGACGT-3’; ED5SCR 5’-GCC AGCCGCGGCTAGCTACAACGATGGCTCCAC-3’. The underlined regions at both ends are the oligonucleotide recognition sequences and the middle sequences represent the conserved catalytic zone. The 5’ and 3’ termini of the oligonucleotides were protected from exonucleases by a phosphorothioate linkage. The 5’ terminus was labeled with
fluorescein isothiocyanate (FITC) to identify gene distribu
-tion under fluorescence microscopy. VSMCs at 70% conflu -ence were cultured in serum-free medium for 30 h and then
transfected with 0.1 μM ED5 or ED5SCR using FuGENE6
in the dark for 18 h. The medium was then replaced with
DMEM supplemented with 10% FBS containing 0.1 μM ED5 or ED5SCR using FuGENE6 and incubated for 24
h. The medium was discarded and 2 mL PBS was added.
Transfection efficiency was determined using an inverted fluorescent microscope (Olympus, Japan).
MTT assay
VSMC proliferation was assayed using a colorimetric
(MTT) assay kit (Amersco, USA). Approximately 5000 cells/ well were plated onto a 96-well plate and incubated with 0.1 μM ED5 or ED5SCR using FuGENE6 for various times.
Four hours before the end of the incubation, 100 µg MTT was added to each well. MTT was then removed and the
cells were solubilized with 150 μL dimethyl sulfoxide. The
absorbance of each well was measured using a microculture plate reader at 490 nm. The cell inhibition ratio (IR) was expressed using the following equation: IR = (absorbance in control - absorbance in treated groups / absorbance in
control) x 100%.
Apoptosis and cell cycle assay
Apoptosis was measured by staining cells with a
com-bination of fluoresceinated (FITC) annexin V and propidium iodide (PI) as described previously. Briefly, after transfection for 72 h, the VSMCs were resuspended in 100 μL binding
buffer (140 mM NaCl, 2.5 mM CaCl2, 10 mM HEPES, pH 7.4). Next, 5 µL annexin V-FITC and 10 μL PI (20 μg/mL;
Jingmei, China) were added and incubated for 15 min at room temperature in the dark. Data were acquired with a
flow cytometer (Becton Dickinson, USA). PI-stained cells were analyzed with a FACSCalibur flow cytometer (Becton
Dickinson) for cell cycle analysis. The cell proliferation index (CPI) was calculated using the following equation: CPI = ((S + G2/M) / (G0/G1 + S + G2/M)) x 100%.
RT-PCR
Total RNA was isolated using a Takara RNA PCR kit according to manufacturer instructions. The PCR primers were designed by Takara (China) and are shown in Table
1. GAPDH was amplified as an internal control. The am
-plification was performed with 30 cycles, which was the
optimal condition for linearity and permitted semiquantitative
analysis of signal strength (temperature profile: 93°C for
30 s, 55°C for 30 s, 72°C for 1 min). PCR products were
separated by 1.5% agarose gel electrophoresis and stained
with DNAgreen (Bioteke Co., China). The target bands were analyzed densitometrically with a gel image analysis system
(Chemi Imager 5500, Alpha Innotech, USA).
Western blot analysis
Aliquots of cell lysates containing 50 µg protein were
separated by 10% SDS-polyacrylamide gel electrophoresis and transferred to nitrocellulose filters. The filters were blocked with TBS-T buffer containing 5% skim milk, incu
-bated with antibodies (1:300) against Egr-1, TGF-β1, p53, p21, Bax, cyclin D1 (Santa Cruz Biotechnology, USA) and β-actin (Sigma, USA) overnight, followed by the addition
Table 1. PCR primers used in the present study.
Primer sequence Size
5’→3’
Egr-1 CAGTCGTAGTGACCACCTTACCA 449 bp AGGTTGCTGTCATGTCTGAAAGAC
TGF-β1 CTGAACCAAGGAGACGGAATACA 462 bp
CAAAGCCTGCGGCACG
p53 GTGGCCTCTGTCATCTTCCG 292 bp CCGTCACCATCAGAGCAACG
p21 TCCGATCCTGGTGATG 442 bp TCTGTTAGGCTGGTCTGC
Bax GACACCTGAGCTGACCTTGG 311 bp GAGGAAGTCCAGTGTCCAC
Cyclin D1 CTGACACCAATCTCCTCAACGAC 409 bp GCGGCCAGGTTCCACTTGAGC
GAPDH ACCACAGTCCATGCCATCAC 452 bp TCCACCACCCTGTTGCTGTA
of a horseradish peroxidase-linked anti-mouse or rabbit IgG (Maixin Biological Company, China) and binding was visualized following incubation with a DAB solution (Maixin
Biological Company). β-actin expression was used as an
internal control to normalize protein content. Bands were scanned using a GS-800 Calibrated Densitometer
(Bio-Rad, USA) and results were quantified using Quantity One
software (Bio-Rad).
Bromodeoxyuridine (BrdU) incorporation
To measure BrdU incorporation, cells were seeded on coverslips and, at the indicated times, 10 μM BrdU (Sigma)
was added to the medium for 24 h. Cells were then harvested
and fixed in ice-cold 75% ethanol, treated with 2 N HCl,
neutralized with 0.1 M borax, washed with PBS containing
0.05% bovine serum albumin, and incubated with anti-BrdU antibody (Sigma). BrdU incorporated into the cell nuclei was
visualized by the avidin-biotin-peroxidase complex method using DAB. The signal intensity within a given area was
quantified from digital images using Metamorph software (Universal Imaging Corporation, USA).
Statistical analyses
Experiments were repeated three to five times. Unless otherwise indicated, data are reported as means ± SD.
Data were analyzed by one-way analysis of variance
fol-lowed by the least significant difference (LSD) method for
multiple comparisons. Differences were considered to be
significant if P < 0.05. All analyses were performed using
the SPSS 13.0 software.
Results
Transfection efficiency
The FITC-labeled ED5 and ED5SCR were readily
de-tectable with the fluorescence microscope apparently within
the cytoplasm and, to a lesser extent, within the nucleus as
a result of endocytosis. Green fluorescence could be seen localized in the cytoplasm of 70.6 ± 1.52 and 72 ± 2.73%
VSMCs 24 h after transfection of FITC-labeled ED5 and ED5SCR, respectively.
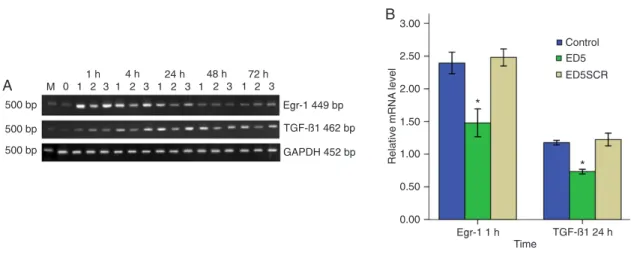
ED5 inhibits Egr-1 and TGF-β1 expression
Under serum-free conditions, very little Egr-1 and TGF-β1 mRNA expression and no Egr-1 protein expression
were detected in VSMCs (Figures 2A and 3A). After 1 h of serum stimulation, Egr-1 was expressed extensively and its levels began to decline after 4 h of serum stimulation. Egr-1 mRNA and protein expression levels in ED5-transfected
cells were significantly lower than in either ED5SCR-transfected or control cells at all times (P < 0.05; Figures 2B and 3B). After 1 h of serum stimulation, TGF-β1 began to increase and peaked after 24 h of stimulation. TGF-β1
mRNA and protein expression levels in ED5-transfected
cells were significantly lower than in ED5SCR-transfected or
control cells at all times (P < 0.05; Figures 2B and 3B). Egr-1 and TGF-βEgr-1 expression levels did not differ significantly
between ED5SCR-transfected and control cells.
ED5 inhibits cell proliferation and DNA synthesis
As shown in Figure 4, ED5-transfected cell proliferation
was significantly inhibited compared to the proliferation of ED5SCR-transfected and control cells (P < 0.05). This
inhibition occurred in a time-dependent manner. The rate
of BrdU incorporation into ED5-transfected cells was also significantly decreased (P < 0.01; Figure 5). However, there was no significant difference in the degree of cell prolifera -tion or DNA synthesis between ED5SCR-transfected and control cells.
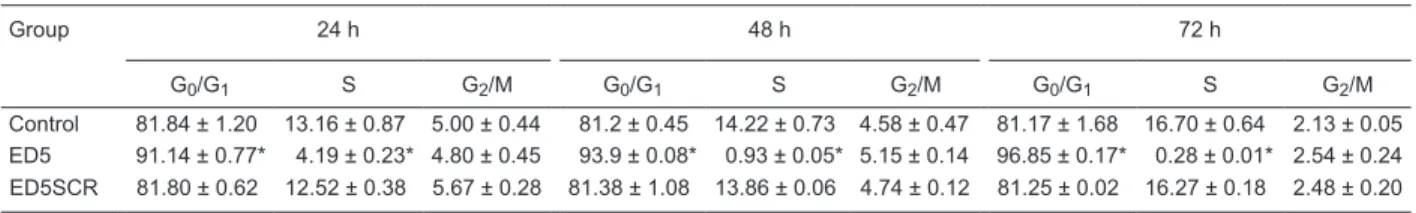
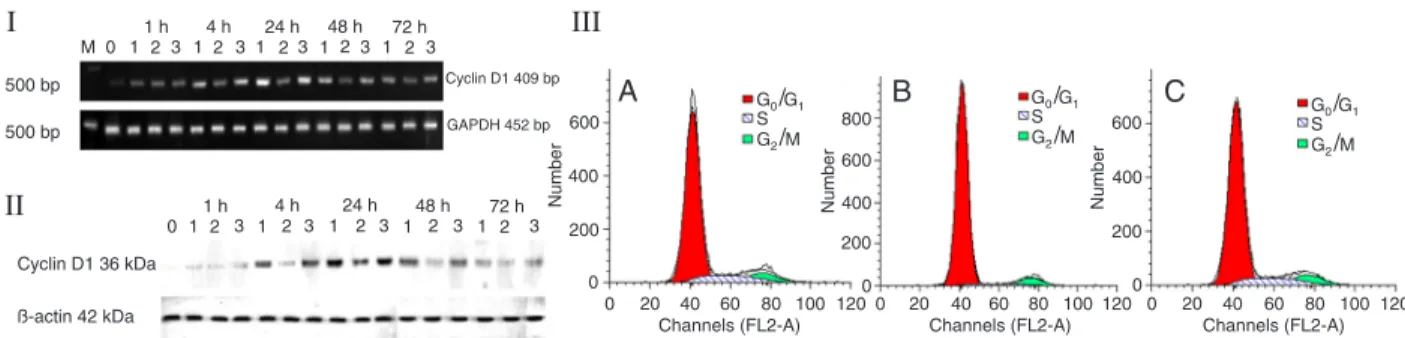
ED5 caused G0/G1 phase arrest by down-regulating cyclin D1
Under serum-free conditions, 89.99 ± 2.96% of VSMCs
were at the G0/G1 stage, and only 1.62 ± 0.11% were at
the S stage. After 24 h of serum stimulation the
propor-tion of cells in the S stage was significantly increased to 13.16%, and the proportion of cells in the G0/G1 stage was decreased to 81.84%. However, after ED5 treatment, the
cells in the G0/G1 stage were significantly increased and
the cells at S + G2/M were significantly decreased. There
was no difference between ED5SCR-transfected and control in cell cycle stage after any treatment (Table 2). The CPI
Figure 1. Immunochemical identification of vascular smooth
20 Y. Wu et al.
was significantly lower in ED5-transfected cells compared
to ED5SCR-transfected and control cells at all times. We found that both cyclin D1 mRNA and protein expression in
ED5-transfected cells was significantly decreased as well (Figure 6). These results indicated that ED5 may
down-regulate cyclin D1 expression, arrest the cells at the G0/G1
phase, and block their entry into the S phase.
Apoptosis is not involved in ED5 inhibition
FACS analysis indicated that there was no significantly
difference in the rate of apoptosis between ED5-transfected
cells, ED5SCR-transfected cells and control cells (Figure 7I). ED5 did not induce necrosis of VSMC. Under serum-free conditions, only low levels of p53, p21, and Bax mRNA expression, and no protein expression, were detected in VSMCs (Figure 7II,III). After 1 h of serum stimulation, p53, p21, and Bax mRNA expression began to increase and peaked at 24 h. p53 and p21 protein expression was increased, but Bax protein was not detected. There was no
significant difference in p53, p21, and Bax levels between
ED5-transfected cells, ED5SCR-transfected cells, and control cells.
Figure 2. Representative expression of Egr-1 and TGF-β1 mRNA in cultured vascular smooth muscle cells (VSMC) in each group.
A, DNA marker (M); serum-free VSMCs (lane 0); normal VSMCs as control (lane 1); VSMCs transfected with ED5 (lane 2); VSMCs
transfected with ED5SCR (lane 3). Expression of Egr-1 and TGF-β1 mRNA was significantly inhibited following ED5 transfection.
B, Quantitative data are shown in the graph. Comparison to normal VSMCs and ED5SCR-transfected cells showed that Egr-1 and
TGF-β1 mRNA expression in ED5-transfected cells was significantly inhibited. GADPH is the internal control. *P < 0.01, compared to
control and ED5SCR (one-way ANOVA).
Figure 3. Time-lapse expression of Egr-1 and TGF-β1 protein levels in cultured vascular smooth muscle cells (VSMC) in each group.
A, DNA marker (M); serum-free VSMCs (lane 0); normal VSMCs as control (lane 1); VSMCs transfected with ED5 (lane 2); VSMCs
transfected with ED5SCR (lane 3). The expression of Egr-1 and TGF-β1 protein levels was significantly inhibited following ED5 trans -fection. B, Quantitative data are shown in the graph. Comparison to control and ED5SCR-transfected cells showed that Egr-1 and
TGF-β1 protein expression in ED5-transfected cells was significantly inhibited. β-actin is the internal control. *P < 0.01, **P < 0.05,
Discussion
Transcription factors are DNA-binding proteins that
can bind to a specific sequence of the gene promoter to
regulate gene expression. Recent studies (11,12) have found that some transcription factors can regulate the ex-pression of several VSMC proliferation-associated genes, and thereby regulate VSMC proliferation. Egr-1 is a zinc
finger transcription factor expressed at low basal levels or
not expressed in normal vascular walls. However, following stimulation such as arterial injury, VSMCs and endothelial cell express Egr-1, which in turn promotes VSMC division, proliferation, and intimal hyperplasia (13,14). Consequently, interfering with the expression of the Egr-1 transcription factor gene as a method to inhibit VSMC proliferation and reduce intimal hyperplasia may provide a novel treatment for restenosis.
10-23 DRz, a DNA enzyme obtained by in vitro target screening (15), successfully hydrolyzes the phosphodiester bond binding free purine and paired pyrimidine. Because its active center is composed of a non-variable sequence, the recognition sequence at the two ends can vary depending on the sequence of the target substrate RNA. This enzyme
can then theoretically cut the AUG loci located in any RNA
sequence. Our previous study (9) demonstrated the
speci-Figure 5. I, BrdU labeling of normal vascular smooth muscle cells (VSMC) as control (A), VSMCs transfected with ED5 (B), and VSMCs transfected with ED5SCR (C). DNA synthesis was significantly inhibited following ED5 transfection for 24 h. Bars: 10 μm. II,
Quantitative data are shown in the graph. Comparison to control and ED5SCR-transfected cells showed that the rate of BrdU incorpo
-ration in ED5-transfected cells was significantly decreased (*P < 0.01, one-way ANOVA).
Figure 4. MTT cell proliferation assay. ED5-transfected cell
pro-liferation was significantly inhibited following transfection for 24,
48, and 72 h. The cell inhibition ratio (IR) was expressed using the following equation: IR = (absorbance in control - absorbance
in treated groups / absorbance in control) x 100%. *P < 0.05, com -pared to control and ED5SCR (one-way ANOVA).
Table 2. Effects of ED5 transfection on the cell cycle of vascular smooth muscle cells (VSMC).
Group 24 h 48 h 72 h
G0/G1 S G2/M G0/G1 S G2/M G0/G1 S G2/M
Control 81.84 ± 1.20 13.16 ± 0.87 5.00 ± 0.44 81.2 ± 0.45 14.22 ± 0.73 4.58 ± 0.47 81.17 ± 1.68 16.70 ± 0.64 2.13 ± 0.05 ED5 91.14 ± 0.77* 4.19 ± 0.23* 4.80 ± 0.45 93.9 ± 0.08* 0.93 ± 0.05* 5.15 ± 0.14 96.85 ± 0.17* 0.28 ± 0.01* 2.54 ± 0.24 ED5SCR 81.80 ± 0.62 12.52 ± 0.38 5.67 ± 0.28 81.38 ± 1.08 13.86 ± 0.06 4.74 ± 0.12 81.25 ± 0.02 16.27 ± 0.18 2.48 ± 0.20
Data are reported as means ± SD of the percent of cells in each stage of the cell cycle. *P < 0.05 compared to control and
22 Y. Wu et al.
ficity and efficacy of synthetic ED5 for inhibiting Egr-1 and
reducing subsequent intimal hyperplasia. However, the exact mechanism of ED5 action and whether it is related to
cell apoptosis was unclear. In the present study, a specific
DNA enzyme targeting the mRNA of the transcription factor Egr-1 was synthesized to investigate a putative mechanism of rat VSMC proliferation and apoptosis.
MTT was first employed in our study to evaluate the transfection efficiency; we found that transfection with ED5 significantly inhibited cultured rat VSMC proliferation in vitro after 24, 48, and 72 h of serum stimulation. We also found that cells transfected with ED5 could effectively
in-hibit the uptake of BrdU by VSMC; specifically, the number
of cells in the DNA synthesis phase decreased, whereas the control transfection ED5SCR showed no such effects.
These results indicate that ED5 likely affects entry into the
cell cycle after specifically inhibiting Egr-1 expression. To
explore this hypothesis, we employed FACS analysis, which revealed that, following transfection with ED5, the ratio of cells in the S phase and the cell proliferation index were markedly decreased, whereas the ratio of cells in the G0/
G1 phase was increased. ED5 transfection prevented
FBS-induced progression to the S phase from the G0/G1 phase.
Control transfections did not show this pattern. Therefore, ED5 transfection not only affected cell cycle regulation, but
specifically influenced the G1/S phase transition.
To confirm this hypothesis, we further investigated the
expression of cyclin D1, the G1 phase apoptosis gene
product p53, a p53 downstream gene cyclin-dependent kinase inhibitor p21waf1/cip1, the apoptosis gene Bax and Figure 6. ED5 transfection induces G0/G1 arrest by down-regulating cyclin D1. ED5 (lane 2) treatment inhibited cyclin D1 mRNA (I)
and protein (II) expression levels relative to the control (lane 1) and ED5SCR-transfected (lane 3) cells. The vascular smooth muscle cell (VSMC) cycle was arrested at the G0/G1 phase and entry into the S phase was blocked 48 h after 10% FBS stimulation as deter
-mined by FACS (III). A, Normal VSMCs as control; B, VSMCs transfected with ED5; C, VSMCs transfected with ED5SCR. GADPH
and β-actin are internal controls.
Figure 7. I, FACS analysis indicated that there was no significant difference in the rate of apoptosis between control cells (A),
ED5-transfected cells (B) and ED5SCR-ED5-transfected cells (C) after transfection for 72 h. II, Under serum-free conditions (lane 0), only low levels of p53, p21, and Bax mRNA expression were observed. There was no significant difference in p53, p21, or Bax mRNA levels
has two GC-rich Egr-1 binding sites; activated Egr-1 may directly interact with these sites and thereby regulate gene
expression (24). In addition, TGF-β1 expression itself may
serve as a stimulus to activate Egr-1, forming a positive
feedback loop with an amplified cascade effect (25). These results may explain why ED5 down-regulates TGF-β1 and
Egr-1 expression.
Nair et al. (26) reported that Egr-1 inhibits cancer cell
growth and induces cell apoptosis by p53. However, San-tiago et al.(5) found that the intimal hyperplasia triggered by Egr-1 is not a result of decreased cell apoptosis. Therefore, whether Egr-1 is related to cell apoptosis remains unclear. Our FACS results suggested that ED5 transfection had no effect on VSMC apoptosis or necrosis. In addition, trans-fection with ED5 did not result in any alterations in p53, p21, or Bax expression levels, suggesting that ED5 did not induce cell cycle arrest in the G0/G1 phase or VSMC apoptosis through a p53 or p21 pathway. These findings are
consistent with those of Mnjoyan and colleagues (27) who demonstrated that serum-induced elevations of p53 have a negative-feedback regulatory effect on VSMC proliferation and division through regulation of p21 and Bax.
As a transcription factor, the protein product of the Egr-1 gene, either independently or by complexing with other nucleoproteins, can directly regulate the expression of target
genes and ultimately influence cell proliferation. Targeting
Egr-1 expression may be a novel therapeutic strategy to treat atherogenesis and secondary intimal hyperplasia.
Acknowledgments
The grant support from the Chinese National Natural Science Foundation (#30871074) is gratefully acknowl- acknowl- acknowl-edged.
References
1. Nobuyoshi M, Kimura T, Nosaka H, Mioka S, Ueno K, Yokoi
H, et al. Restenosis after successful percutaneous translu-Restenosis after successful percutaneous translu-minal coronary angioplasty: serial angiographic follow-up of 229 patients. J Am Coll Cardiol 1988; 12: 616-623.
2. Holmes DR Jr, Vlietstra RE, Smith HC, Vetrovec GW, Kent KM, Cowley MJ, et al. Restenosis after percutaneous transluminal coronary angioplasty (PTCA): a report from the PTCA Registry of the National Heart, Lung, and Blood Institute. Am J Cardiol 1984; 53: 77C-81C.
3. Kent KM. Restenosis after percutaneous transluminal coro-nary angioplasty. Am J Cardiol 1988; 61: 67G-70G.
4. Sarkar R, Meinberg EG, Stanley JC, Gordon D, Webb RC. Nitric oxide reversibly inhibits the migration of cultured vas-cular smooth muscle cells. Circ Res 1996; 78: 225-230.
5. Santiago FS, Lowe HC, Kavurma MM, Chesterman CN, Baker A, Atkins DG, et al. New DNA enzyme targeting Egr-1 mRNA inhibits vascular smooth muscle proliferation and regrowth after injury. Nat Med 1999; 5: 1264-1269.
6. Thiel G, Cibelli G. Regulation of life and death by the zinc finger transcription factor Egr-1. J Cell Physiol 2002; 193: 287-292.
7. Khachigian LM. Early growth response-1 in cardiovascular pathobiology. Circ Res 2006; 98: 186-191.
8. Takahashi Y, Fujioka Y, Takahashi T, Domoto K, Takahashi A, Taniguchi T, et al. Chylomicron remnants regulate early growth response factor-1 in vascular smooth muscle cells.
Life Sci 2005; 77: 670-682.
9. Liu GN, Teng YX, Yan W. Transfected synthetic DNA enzyme
gene specifically inhibits Egr-1 gene expression and reduces
neointimal hyperplasia following balloon injury in rats. Int J Cardiol 2008; 129: 118-124.
10. Curcio A, Torella D, Cuda G, Coppola C, Faniello MC, Achille F, et al. Effect of stent coating alone on in vitro vascular smooth muscle cell proliferation and apoptosis. Am J Physiol Heart Circ Physiol 2004; 286: H902-H908.
11. Yasumoto H, Kim S, Zhan Y, Miyazaki H, Hoshiga M, Kaneda
the proliferation-associated gene TGF-β1. Following treat
-ment with 0.1 μM ED5, there were no significant differences
in p53, p21, or Bax mRNA relative to controls. However,
cyclin D1 and TGF-β1 mRNA syntheses were significantly inhibited by ED5 treatment. Our findings are consistent with those of Fu et al. (16) using gene chip analysis of human
vascular endothelial cells. Our results are also consistent with those of McCaffrey et al. (17) who performed a cDNA chip analysis on human carotid atherosclerotic plaques, and concluded that cyclin D1 is regulated by Egr-1. The
cyclin D1 expression study reported here not only confirms the specific effect of ED5 on Egr-1, but also demonstrates
that ED5 down-regulates cyclin D1 expression by inhibiting Egr-1 expression, resulting in cell cycle arrest at the G0/G1
phase, which therefore decreases the S + G2/M ratio and
further inhibits VSMC proliferation.
Previous studies have suggested that the enhancement
of TGF-β1 activity is observed not only following stenosis
lesions in animal models (18,19) but also in human vessels (20). A study of blood vessels following rat balloon injury
demonstrated that the elevated expression levels of TGF-β1
could last for at least 2 weeks; importantly, administration of
an antibody against TGF-β1 inhibited neointimal formation (21,22), suggesting that TGF-β1 plays an essential role in
restenosis. The present results demonstrate that 1) Egr-1
and TGF-β1 have low expression levels under serum-free
conditions, 2) expression of Egr-1 increases earlier than
that of TGF-β1 following stimulation with 10% serum, and 3) levels of TGF-β1 decrease later than do Egr-1 levels
following transfection with ED5. Taken together, these
24 Y. Wu et al.
Y, et al. Dominant negative c-jun gene transfer inhibits vascular smooth muscle cell proliferation and neointimal hyperplasia in rats. Gene Ther 2001; 8: 1682-1689.
12. Kume M, Komori K, Matsumoto T, Onohara T, Takeuchi K, Yonemitsu Y, et al. Administration of a decoy against the ac-tivator protein-1 binding site suppresses neointimal thicken-ing in rabbit balloon-injured arteries. Circulation 2002; 105:
1226-1232.
13. Ohtani K, Egashira K, Usui M, Ishibashi M, Hiasa KI, Zhao Q,
et al. Inhibition of neointimal hyperplasia after balloon injury by cis-element ‘decoy’ of early growth response gene-1 in hypercholesterolemic rabbits. Gene Ther 2004; 11:
126-132.
14. Lowe HC, Fahmy RG, Kavurma MM, Baker A, Chesterman
CN, Khachigian LM. Catalytic oligodeoxynucleotides define
a key regulatory role for early growth response factor-1 in the porcine model of coronary in-stent restenosis. Circ Res
2001; 89: 670-677.
15. Santoro SW, Joyce GF. A general purpose RNA-cleaving DNA enzyme. Proc Natl Acad Sci U S A 1997; 94:
4262-4266.
16. Fu M, Zhu X, Zhang J, Liang J, Lin Y, Zhao L, et al. Egr-1 target genes in human endothelial cells identified by microar -ray analysis. Gene 2003; 315: 33-41.
17. McCaffrey TA, Fu C, Du B, Eksinar S, Kent KC, Bush H Jr, et al. High-level expression of Egr-1 and Egr-1-inducible genes in mouse and human atherosclerosis. J Clin Invest
2000; 105: 653-662.
18. Chamberlain J, Gunn J, Francis SE, Holt CM, Arnold ND, Cumberland DC, et al. TGFbeta is active, and correlates with activators of TGFbeta, following porcine coronary an-gioplasty. Cardiovasc Res 2001; 50: 125-136.
19. Majesky MW, Lindner V, Twardzik DR, Schwartz SM, Reidy MA. Production of transforming growth factor beta 1 during
repair of arterial injury. J Clin Invest 1991; 88: 904-910. 20. Nikol S, Isner JM, Pickering JG, Kearney M, Leclerc G,
Weir L. Expression of transforming growth factor-beta 1 is increased in human vascular restenosis lesions. J Clin Invest 1992; 90: 1582-1592.
21. Wolf YG, Rasmussen LM, Ruoslahti E. Antibodies against transforming growth factor-beta 1 suppress intimal hyperpla-sia in a rat model. J Clin Invest 1994; 93: 1172-1178. 22. Smith JD, Bryant SR, Couper LL, Vary CP, Gotwals PJ,
Koteliansky VE, et al. Soluble transforming growth
factor-beta type II receptor inhibits negative remodeling, fibroblast
transdifferentiation, and intimal lesion formation but not endothelial growth. Circ Res 1999; 84: 1212-1222. 23. Khachigian LM, Lindner V, Williams AJ, Collins T.
Egr-1-induced endothelial gene expression: a common theme in vascular injury. Science 1996; 271: 1427-1431.
24. Kim SJ, Park K, Rudkin BB, Dey BR, Sporn MB, Roberts AB. Nerve growth factor induces transcription of transforming
growth factor-beta 1 through a specific promoter element in
PC12 cells. J Biol Chem 1994; 269: 3739-3744.
25. Goetze S, Kintscher U, Kaneshiro K, Meehan WP, Collins A,
Fleck E, et al. TNFalpha induces expression of transcription factors c-fos, Egr-1, and Ets-1 in vascular lesions through extracellular signal-regulated kinases 1/2. Atherosclerosis
2001; 159: 93-101.
26. Nair P, Muthukkumar S, Sells SF, Han SS, Sukhatme VP,
Rangnekar VM. Early growth response-1-dependent apop-tosis is mediated by p53. J Biol Chem 1997; 272: 20131-20138.
27. Mnjoyan ZH, Dutta R, Zhang D, Teng BB, Fujise K. Para-doxical upregulation of tumor suppressor protein p53 in serum-stimulated vascular smooth muscle cells: a novel negative-feedback regulatory mechanism. Circulation 2003;