Thalamic metabolic abnormalities in patients
with Huntington’s disease measured by
magnetic resonance spectroscopy
R.F. Casseb
1,4, A. D’Abreu
2,4, H.H. Ruocco
2, I. Lopes-Cendes
3,4, F. Cendes
2,4and G. Castellano
1,4 1Departamento de Raios Co´smicos e Cronologia, Instituto de Fı´sica ‘‘Gleb Wataghin’’, Universidade Estadual de Campinas,Campinas, SP, Brasil 2Laborato´rio de Neuroimagem, Departamento de Neurologia, Faculdade de Cieˆncias Me´dicas,
Universidade Estadual de Campinas, Campinas, SP, Brasil 3
Departamento de Gene´tica Me´dica, Faculdade de Cieˆncias Me´dicas, Universidade Estadual de Campinas, Campinas, SP, Brasil 4
Programa CInAPCe (Cooperac¸a˜o Interinstitucional de Apoio a Pesquisas sobre o Ce´rebro), SP, Brasil
Abstract
Huntington’s disease (HD) is a neurologic disorder that is not completely understood; its fundamental physiological mechanisms and chemical effects remain somewhat unclear. Among these uncertainties, we can highlight information about the concentrations of brain metabolites, which have been widely discussed. Concentration differences in affected, compared to healthy, individuals could lead to the development of useful tools for evaluating the progression of disease, or to the advance of investigations of different/alternative treatments. The aim of this study was to compare the thalamic concentration of metabolites in HD patients and healthy individuals using magnetic resonance spectroscopy. We used a 2.0-Tesla magnetic field, repetition time of 1500 ms, and echo time of 135 ms. Spectra from 40 adult HD patients and 26 control subjects were compared. Quantitative analysis was performed using the LCModel method. There were statistically significant differences between HD patients and controls in the concentrations ofN-acetylaspartate++N-acetylaspartylglutamate (NAA++NAAG;t-test, P,0.001), and glycerophosphocholine++phosphocholine (GPC++PCh;t-test, P=0.001) relative to creatine++phosphocreatine (Cr++PCr). The NAA++NAAG/Cr++PCr ratio was decreased by 9% and GPC++PCh/Cr++PCr increased by 17% in patients compared with controls. There were no correlations between the concentration ratios and clinical features. Although these results could be caused by T1 and T2 changes, rather than variations in metabolite concentrations given the short repetition time and long echo time values used, our findings point to thalamic dysfunction, corroborating prior evidence.
Key words: Magnetic resonance spectroscopy; Huntington’s disease; Quantification; Thalamus; LCModel
Introduction
Huntington’s disease (HD) is a neurodegenerative disorder with autosomal dominant inheritance and age-dependent penetrance, caused by a CAG trinucleotide expansion in the short arm of chromosome 4 (4p16.3) (1,2). Normal CAG repeats range from 9 to 36, while in patients with HD the repeats exceed 37 (3). HD is clinically characterized as a neuropsychiatric syndrome with move-ment disorders (chorea, dystonia, and other involuntary movements), cognitive, and psychiatric symptoms (psychomotor agitation, depressive symptoms, delusions, and hallucinations). The CAG repeat size is inversely correlated to age of onset, and directly correlated to clinical severity (1). The diagnosis is confirmed by molecular testing. Neuropathological alterations consist of prominent
cellular loss, especially of the medium spiny neurons in the striatum, and atrophy of the caudate nucleus and putamen. Other areas, such as the hippocampus, angular gyrus, substantia nigra, cerebellum, the tuberal lateral nuclei of the hypothalamus and the central medial-parafascicular complex of the thalamus, are also affected (1).
The magnetic resonance spectroscopy (MRS) technique is based on the interaction of the nuclear spin of the atoms analyzed, subjected to an external magnetic field, with radiofrequency pulses. These atoms emit a measurable response signal, which can be Fourier transformed to originate a spectrum. The spectrum profile is directly related to the metabolite concentrations in the sample.
Correspondence: G. Castellano, Departamento de Raios Co´smicos e Cronologia, Instituto de Fı´sica ‘‘Gleb Wataghin’’, Universidade Estadual de Campinas, Rua Sergio Buarque de Holanda, 777, 13083-859 Campinas, SP, Brasil. E-mail: gabriela@ifi.unicamp.br
Previous MRS studies of HD evaluated various brain regions, notably the basal ganglia (4-9), frontal lobe (4,10), occipital lobe (5,9,11), and the thalamus (6,12). Increases in lactate and myoinositol seem to be present in the early stages of the disease (8,10,11), while decreased N-acetyl aspartate (NAA) levels are consistently reported in multiple areas of the brain (7,10,12).
The objective of this research was to assess thalamic metabolite concentrations in patients with HD via MRS, and to verify whether these concentrations were altered when compared to healthy individuals. We also attempted to correlate these findings with clinical markers of the disease.
Material and Methods
This project was approved by the Internal Review Board of Universidade Estadual de Campinas, SP, Brazil, and all participants signed a written informed consent. [1H]-MR spectra were obtained from 40 patients with HD (13-73 years of age, mean=43±13 years, 19 women) and from 26 healthy subjects (15-69 years of age, mean=33±12 years, 16 women).
The control group had no history of neurological and/or psychiatric illness. All patients had a clinical and molecular diagnosis of HD. The HD diagnosis was made according to established criteria, including a positive family history; presence of a neuropsychiatric syndrome characterized by chorea, dystonia or impaired voluntary motor function; and cognitive or psychiatric symptoms. Exclusion criteria were history of stroke, hypertension, diabetes mellitus, alcohol and drug abuse, and malig-nancy. An experienced neurologist reviewed each clinical history and performed a neurological examination in addition to the Unified Huntington’s Disease Rating Scale (UHDRS) motor evaluation. Additional clinical information is presented in Table 1. Disease onset was characterized by the onset of any neuropsychiatric manifestation typically found in the disease, most com-monly chorea; however, other symptoms such as depres-sion, change in mood or personality, and cognitive symptoms were also taken into consideration.
Data acquisition was made using a 2.0-Tesla (T) scanner (Elscint Prestige, Israel). A standard MRI proto-col as described by Ruocco et al. (12) was used followed by the MRS acquisition for all subjects. The MRS protocol consisted of a single-voxel acquisition using PRESS (point resolved spectroscopy sequence) with repetition time (TR)=1500 ms, echo time (TE)=135 ms, spectral bandwidth=1000 Hz, and 1024 complex data points. The voxel was placed in the right thalamus, with a volume of 26262 cm3(Figure 1).
Spectral analysis was performed, and data quantified, using the Linear Combination of Model spectra (LCModel) method and software (13,14). The metabolite groups quantified with good signal-to-noise ratio (SNR) are shown in Table 2, which correspond to the groups with the most intense signal in the spectra. The LCModel software allows little to no user interaction, which is an advantage for minimizing subjective inputs, thus favoring data exchanges and comparisons between different research groups. Another interesting aspect of this method is that the spectral-fitting uses characteristic spectra from every metabolite of interest (composed of one or more peaks), instead of individual resonance peaks from specific chemical groups. An example of a typical spectrum from a control subject is shown in Figure 2 (black noisy lines). Spectra from patients were similar. Figure 2 also shows the Table 1. Huntington’s disease (HD) patient clinical information.
Information
Number of CAG repeats 47 ± 6
Age at HD onset (years) 35 ± 12
Age at MRS scan (years) 43 ± 13
Duration of the disease (years) 8 ± 4 UHDRS motor score (points) 68 ± 32
Data are reported as means±SD. MRS: magnetic resonance spectroscopy; UHDRS: Unified Huntington’s Disease Rating Scale.
Figure 1.Voxel placement in the thalamus.
Table 2. Abbreviations and names of the metabolites evaluated in this study.
Abbreviation Metabolite
GPC++PCh Glycerophosphocholine ++ phosphocholine NAA++NAAG N-acetylaspartate ++ N-acetylaspartylglutamate Cr++PCr* Creatine ++ phosphocreatine
baseline (smoother black line) and the fitted spectrum (red line) as calculated by LCModel.
After data analysis and processing, a two-sample t-test was performed to compare both groups, using the Systat software (Systat Software, Inc., USA). The Pearson correlation coefficient between metabolite con-centrations and other important clinical features (CAG repeats, age, age at onset, disease duration, and UHDRS score) was also calculated using the Systat software (15). Both the t-test and correlation analyses were corrected with the Bonferroni test for multiple comparisons.
Results
Given that an inherent difficulty of the in vivo MRS technique is to obtain absolute concentration values that may be compared reliably with values obtained using different equipment, or under different conditions (16), we decided to use total creatine, that is, creatine+ +pho-sphocreatine (Cr++PCr) as an internal reference. Although water spectra were available, we chose not to use water as reference because we did not have image data from which we could reliably estimate the water content of the voxel. Therefore, metabolite ratios were computed with reference to Cr++PCr.
To calculate the ratios, only metabolites whose absolute quantification presented Cramer-Rao lower bounds smaller than 20% (17) were used. There were 26 control individuals
and 39 patients in each metabolite group whose data respected this criterion. Therefore, only one patient among all participants had to be excluded from the analysis.
In addition, mean values and respective standard deviations for the full width at half maximum (FWHM) and the SNR parameters were determined for both patients (FWHM=0.104±0.032 and SNR=5.9±2.4) and controls (FWHM=0.086±0.023 and SNR=6.3±1.8). There was no significant difference in SNR (P=0.857) between the two groups; however, there was for FWHM (P=0.018), which was higher for the patients than for the controls. This was probably due to the higher incidence of motion artifacts during scanning of the patient group, resulting from their pathology.
Table 3 presents the mean value, standard deviation, and respective P value (t-test, 5% significance level) of the metabolites evaluated for both the control and patient groups. We observed that the glycerophosphocholine++ phosphocholine (GPC++PCh)/Cr++PCr ratio increased in patients (P=0.001) when compared with the control group, whileN-acetylaspartate++N-acetylaspartylglutamate (NAA++NAAG)/Cr++PCr decreased (P,0.001).
The Pearson correlation coefficient was used to verify any direct or indirect linear dependency between metabolite concentrations and the other aforementioned clinical features. We did not find any significant correlation among these variables. We only found a correlation between the number of CAG repeats and age at onset (r=-0.579; P,0.001).
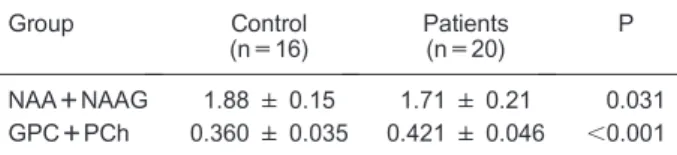
Considering that our spectra were relatively noisy, which can be inferred from the mean FWHM and SNR, a second data analysis was performed in a subgroup of patients and controls. We only included spectra with SNR.5 and FWHM,0.108 in the secondary analysis. The patient group was reduced to 20 individuals, and the control group to 16. This improved the mean FWHM and SNR values for both the patient (FWHM=0.081±0.014, SNR=7.9±1.4) and the control (FWHM=0.079±0.020, SNR=7.4±1.3) groups. This second comparison of metabolite contents between groups, and correlation of metabolite content and clinical variables for the patient group gave qualitatively the same results as those from the whole cohort, as shown in Table 4.
Figure 2.Example spectrum from a healthy subject.A, Residual fit.B, The black noisy line corresponds to the original spectrum while the red line corresponds to the fitted LCModel spectrum. Substance abbreviations are identified in Table 2.
Table 3. Metabolite concentrations relative to the Cr++PCr concentration for the original groups (26 control subjects and 39 Huntington’s disease patients).
Group Control
(n=26)
Patients (n=39)
P
NAA++NAAG 1.85 ± 0.21 1.59 ± 0.25 ,0.001 GPC++PCh 0.361 ± 0.046 0.411 ± 0.054 0.001
Discussion
Although in vitro MRS has been in use for some decades and has, therefore, become a well-established technique, its in vivo application has several intrinsic problems. It has markedly low sensitivity and low SNR, as well as a high susceptibility to motion artifacts, which is of practical relevance in HD patients. These are the reasons why its clinical application is still limited. However, an increasing amount of research in the medical field, notably in neurology, has demonstrated its potential to help diagnose several pathologies, such as cancer (e.g., 18-20) and epilepsy (e.g., 21,22).
In this study, we found differences in the metabolic patterns of 39 HD patients and 26 healthy individuals. A previous study by Ruocco et al. (12), which used the same MRS acquisition, but with a less robust spectrum quantification analysis, and included only 22 HD patients and 25 controls, only found a decrease in relative concentration (NAA++NAAG)/(Cr++PCr), which was attrib-uted to neuronal loss or dysfunction in the thalamic region. In the present study, with almost twice as many HD patients and a similar number of control subjects, we found differences in both NAA++NAAG/Cr++PCr and GPC++PCh/Cr++PCr ratios. These results may be explained by a number of factors.
On the one hand, the groups were not appropriately matched for age. There was a 10 year mean age difference between groups (P=0.003, t-test). However, the use of metabolite ratios instead of absolute metabolite concentrations should decrease possible age effects. Indeed, there were no significant correlations between age and metabolite concentration ratios in either the control or the patient group (P.0.2 for all correlations of metabolite ratios with age in both groups).
Another possible explanation for these results is the T1 and T2 weighting, given that relatively short TR and long TE were used. The weightings for the measured metabolite ratios can be estimated by using the following
expressions: 1{expð{TR=T1MetÞ 1{expð{TR=T1CrzPCrÞ
for T1 weighting
and expð{TE=T2MetÞ expð{TE=T2CrzPCrÞ
for T2 weighting, where
TR=1500 ms, TE=135 ms, and Met=NAA++NAAG or GPC++PCh. To estimate these weightings, we searched the literature for T1 and T2 values for NAA++NAAG, GPC++PCh and Cr++PCr. There were no values for either a 2.0-T field, or for the thalamus. Instead, we used values for 1.5- and 3.0-T fields, measured for different gray matter regions, or sometimes for a combination of both gray and white matter (23-25). In the worst-case scenario, we found that T1 weighting could underestimate NAA++NAAG/Cr++PCr by 9% (1.5 T, parietal white/gray matter), and overestimate GPC++PCh/Cr++PCr by 18% (1.5 T, occipital lobe). However, in the best-case scenario, NAA++NAAG/Cr++PCr remained unchanged and GPC++PCh/Cr++PCr was overestimated by 1%. For T2 weighting, in the worst-case scenario, NAA++NAAG/ Cr++PCr could be overestimated by 41% (3.0 T, occipital gray matter) and GPC++PCh/Cr++PCr by 39% (3.0 T, cingulate gyrus gray matter). In the best-case scenario, these ratios could be overestimated by 25% (1.5 T, motor cortex gray matter) and 17% (1.5 T, occipital lobe), respectively. In this study, we found a 9% decrease in the NAA++NAAG/Cr++PCr ratio and a 17% increase in GPC++PCh/Cr++PCr for the patient group compared with the control group. Given the above T1 and T2 weighting estimates, we cannot exclude T1 and/or T2 changes in tissue altered by HD as responsible for these results, rather than actual metabolite concentration changes. On the other hand, both T1 and T2 vary a lot within brain regions, and this is especially so in pathologies (23-25). Moreover, we could not find T1 and T2 values for the specific field strength used in this study, nor for the specific brain region we evaluated. Therefore, we could not provide a true estimate for the amount of weighting in our data. By keeping the TE and TR fixed we established norms for ‘‘institutional units’’, particularly using concen-tration ratios, which are less sensitive than absolute concentrations to relaxation effects (26).
Therefore, not excluding possible T1 and T2 changes, which would be the same here as reported by Ruocco et al. (12), another explanation for our results is that they indeed demonstrate changes in metabolite concentration (i.e., decreased NAA++NAAG/Cr++PCr and increased GPC++PCh/Cr++PCr) in HD patients. The difference in our results and those of Ruocco et al. (12) can be explained by the larger sample size and the use of the more precise LCModel quantification method. Ruocco et al. based their research on the manual choice of peak boundaries in the spectra followed by computation of the area below the corresponding curve.
The HD clinical manifestations clearly imply a dys-function of the basal ganglia-thalamocortical circuitry (27). In a study using voxel-based morphometry, a symmetrical atrophy of the thalamus (in particular the dorsomedial nucleus, centromedian nucleus, parafascicular nucleus, and ventrolateral nuclear complex) correlated with cogni-tive performance in early onset of HD (28).
Table 4.Metabolite concentrations relative to the Cr++PCr concentration for the reduced groups (16 control subjects and 20 Huntington’s disease patients) with higher quality spectra.
Group Control
(n=16)
Patients (n=20)
P
NAA++NAAG 1.88 ± 0.15 1.71 ± 0.21 0.031 GPC++PCh 0.360 ± 0.035 0.421 ± 0.046 ,0.001
Choline compounds (GPC++PCh) are among the lipids comprising the cell membrane; therefore, GPC++PCh abnormalities may reflect changes in cell synthesis or destruction (29). Results including measure-ment of choline compounds in HD are conflicting. Here we found an increase in the thalamic GPC++PCh/Cr++PCr ratio in HD patients. A previous study in preclinical HD patients showed decreased choline-containing com-pounds in the frontal lobe, which correlated with slowing in visuomotor tasks (4). Another study found increased choline levels in the striatum of asymptomatic HD patients compared with controls; however, no changes were found in symptomatic HD patients compared with controls (11). Yet another study found a decrease in choline levels in the striatum of akinetic HD patients compared with controls (30). A previous study with our HD group did not find any difference in choline levels between patients and controls (12), but another study found increased choline levels in the basal ganglia of HD patients compared with controls (5). These differences are probably related to the data acquisition and analysis methodology that was used, the stage of disease progression in the patients studied, and the area of the
brain (region of interest) chosen for the MRS [i.e., white matter (4)vsdeep gray matter (5,11,12,30)].
We found a reduction in the NAA++NAAG/Cr++PCr ratio in the patient group. Prior studies showed decreased NAA levels in the frontal lobe (10), putamen (7,8), and thalamus (12) of HD patients. It has also been pointed out that decreased putaminal NAA and myoinositol can potentially be used as biomarkers for HD onset and progression (8). Decreased NAA concentration reflects a combination of neuronal and axonal loss as well as a reduction in mitochondrial metabolism (31). Indeed, mitochondrial dysfunction seems to play a key role in HD (32). Animal models having a blockage of mitochon-drial complex II present a neurodegenerative disease similar to HD (33). There is also evidence that a mechanism dependent on NMDA receptors may trigger the medium-sized spiny neuron susceptibility to complex II dysfunction (33).
Acknowledgments
Research supported by FAPESP (#2005/56578-4 and#2009/02138-4).
References
1. Walker FO. Huntington’s disease.Lancet2007; 369: 218-228, doi: 10.1016/S0140-6736(07)60111-1.
2. Cardoso F, Seppi K, Mair KJ, Wenning GK, Poewe W. Seminar on choreas.Lancet Neurol2006; 5: 589-602, doi: 10.1016/S1474-4422(06)70494-X.
3. Duyao M, Ambrose C, Myers R, Novelletto A, Persichetti F, Frontali M, et al. Trinucleotide repeat length instability and age of onset in Huntington’s disease.Nat Genet1993; 4: 387-392, doi: 10.1038/ng0893-387.
4. Gomez-Anson B, Alegret M, Munoz E, Sainz A, Monte GC, Tolosa E. Decreased frontal choline and neuropsychological performance in preclinical Huntington disease. Neurology 2007; 68: 906-910, doi: 10.1212/01.wnl.0000257090.01107.2f. 5. Hoang TQ, Bluml S, Dubowitz DJ, Moats R, Kopyov O, Jacques D, et al. Quantitative proton-decoupled 31P MRS and 1H MRS in the evaluation of Huntington’s and Parkinson’s diseases. Neurology 1998; 50: 1033-1040, doi: 10.1212/WNL.50.4.1033.
6. van Oostrom JC, Sijens PE, Roos RA, Leenders KL. 1H magnetic resonance spectroscopy in preclinical Huntington disease. Brain Res 2007; 1168: 67-71, doi: 10.1016/ j.brainres.2007.05.082.
7. Reynolds NC Jr, Prost RW, Mark LP. Heterogeneity in 1H-MRS profiles of presymptomatic and early manifest Huntington’s disease. Brain Res 2005; 1031: 82-89, doi: 10.1016/j.brainres.2004.10.030.
8. Sturrock A, Laule C, Decolongon J, Dar Santos R, Coleman AJ, Creighton S, et al. Magnetic resonance spectroscopy biomarkers in premanifest and early Huntington disease. Neurology 2010; 75: 1702-1710, doi: 10.1212/WNL. 0b013e3181fc27e4.
9. Taylor-Robinson SD, Weeks RA, Bryant DJ, Sargentoni J,
Marcus CD, Harding AE, et al. Proton magnetic resonance spectroscopy in Huntington’s disease: evidence in favour of the glutamate excitotoxic theory.Mov Disord1996; 11: 167-173, doi: 10.1002/mds.870110209.
10. Harms L, Meierkord H, Timm G, Pfeiffer L, Ludolph AC. Decreased N-acetyl-aspartate/choline ratio and increased lactate in the frontal lobe of patients with Huntington’s disease: a proton magnetic resonance spectroscopy study. J Neurol Neurosurg Psychiatry 1997; 62: 27-30, doi: 10.1136/jnnp.62.1.27.
11. Jenkins BG, Rosas HD, Chen YC, Makabe T, Myers R, MacDonald M, et al. 1H NMR spectroscopy studies of Huntington’s disease: correlations with CAG repeat num-bers. Neurology 1998; 50: 1357-1365, doi: 10.1212/ WNL.50.5.1357.
12. Ruocco HH, Lopes-Cendes I, Li LM, Cendes F. Evidence of thalamic dysfunction in Huntington disease by proton magnetic resonance spectroscopy.Mov Disord 2007; 22: 2052-2056, doi: 10.1002/mds.21601.
13. Provencher SW. LCModel. Version 6.2-1. [Computer program]. http://s-provencher.com/pages/lcmodel.shtml; 2008.
14. Provencher SW. Estimation of metabolite concentrations from localizedin vivo proton NMR spectra.Magn Reson Med1993; 30: 672-679, doi: 10.1002/mrm.1910300604. 15. Systat 12 for Windows. Version 12.00.08. [Computer
program]. Chicago: SYSTAT Software, Inc.; 2007. 16. Graaf RA. In vivo NMR spectroscopy: Principles and
techniques. 2nd edn. West Sussex: John Wiley & Sons; 2007.
tool for quantitation.NMR Biomed2001; 14: 278-283, doi: 10.1002/nbm.701.
18. Lukas L, Devos A, Suykens JA, Vanhamme L, Howe FA, Majos C, et al. Brain tumor classification based on long echo proton MRS signals.Artif Intell Med 2004; 31: 73-89, doi: 10.1016/j.artmed.2004.01.001.
19. Lehnhardt FG, Bock C, Rohn G, Ernestus RI, Hoehn M. Metabolic differences between primary and recurrent human brain tumors: a 1H NMR spectroscopic investigation. NMR Biomed2005; 18: 371-382, doi: 10.1002/nbm.968. 20. Sjobakk TE, Johansen R, Bathen TF, Sonnewald U, Kvistad
KA, Lundgren S, et al. Metabolic profiling of human brain metastases usingin vivo proton MR spectroscopy at 3T. BMC Cancer2007; 7: 141, doi: 10.1186/1471-2407-7-141. 21. Li LM, Cendes F, Andermann F, Dubeau F, Arnold DL. Spatial extent of neuronal metabolic dysfunction measured by proton MR spectroscopic imaging in patients with localization-related epilepsy.Epilepsia 2000; 41: 666-674, doi: 10.1111/j.1528-1157.2000.tb00226.x.
22. Campos BA, Yasuda CL, Castellano G, Bilevicius E, Li LM, Cendes F. Proton MRS may predict AED response in patients with TLE. Epilepsia 2010; 51: 783-788, doi: 10.1111/j.1528-1167.2009.02379.x.
23. Mlynarik V, Gruber S, Moser E. Proton T (1) and T (2) relaxation times of human brain metabolites at 3 Tesla. NMR Biomed2001; 14: 325-331, doi: 10.1002/nbm.713. 24. Traber F, Block W, Lamerichs R, Gieseke J, Schild HH. 1H
metabolite relaxation times at 3.0 tesla: Measurements of T1 and T2 values in normal brain and determination of regional differences in transverse relaxation.J Magn Reson Imaging2004; 19: 537-545, doi: 10.1002/jmri.20053. 25. Li Y, Xu D, Ozturk-Isik E, Lupo JM, Chen AP, Vigneron DB,
et al. T1 and T2 metabolite relaxation times in normal brain
at 3T and 7T.J Mol Imaging Dynam2012; S1: 002. 26. Provencher S. LCModel & LCMgui user’s manual. [http://
lcmodel.CA] 2012.
27. Joel D. Open interconnected model of basal ganglia-thalamocortical circuitry and its relevance to the clinical syndrome of Huntington’s disease.Mov Disord2001; 16: 407-423, doi: 10.1002/mds.1096.
28. Kassubek J, Juengling FD, Ecker D, Landwehrmeyer GB. Thalamic atrophy in Huntington’s disease co-varies with cognitive performance: a morphometric MRI analysis.Cereb Cortex2005; 15: 846-853, doi: 10.1093/cercor/bhh185. 29. Govindaraju V, Young K, Maudsley AA. Proton NMR
chemical shifts and coupling constants for brain metabo-lites.NMR Biomed2000; 13: 129-153, doi: 10.1002/1099-1492(200005)13:3,129::AID-NBM619.3.0.CO;2-V. 30. Sanchez-Pernaute R, Garcia-Segura JM, del Barrio AA,
Viano J, de Yebenes JG. Clinical correlation of striatal 1H MRS changes in Huntington’s disease.Neurology1999; 53: 806-812, doi: 10.1212/WNL.53.4.806.
31. Signoretti S, Marmarou A, Tavazzi B, Lazzarino G, Beaumont A, Vagnozzi R. N-Acetylaspartate reduction as a measure of injury severity and mitochondrial dysfunction following diffuse traumatic brain injury.J Neurotrauma2001; 18: 977-991, doi: 10.1089/08977150152693683.
32. Oliveira JM. Mitochondrial bioenergetics and dynamics in Huntington’s disease: tripartite synapses and selective striatal degeneration.J Bioenerg Biomembr2010; 42: 227-234, doi: 10.1007/s10863-010-9287-6.