A
rti
g
o
*e-mail: [email protected]
OBTAINING ZnO IMMOBILIZED OVER DIFFERENT SUBSTRATES BY HYDROTHERMAL TREATMENT FOR PHOTOCATALYSIS APPLICATION
Mônica Bagnara*, Jéssica Farias and Marla Azário Lansarin
Departamento de Engenharia Química, Universidade Federal do Rio Grande do Sul, 90040-040 Porto Alegre – RS, Brasil
Recebido em 11/08/2015; aceito em 20/11/2015; publicado na web em 19/02/2016
The aim of this work is to systematically explore the effect of the synthesis conditions of ZnO structures, immobilized on different substrates by hydrothermal treatment, in its photocatalytic activity. A circumscribed central composite design of experiments was used to analyze the effects of reagents stoichiometry, reaction time and temperature, covering a wide range of these variables. The substrates used were etched glass, copper and zinc foils. The photocatalytic activity of the as-obtained ZnO samples was evaluated through photocatalytic degradation of rhodamine B (RhB) in aqueous solution under UV irradiation. Zinc foils presented the best immobilized film quality and the maximum dye removal was 80% in one hour of UV exposure.
Keywords: hydrothermal crystal growth; nanostructures; zinc oxide; photocatalysis; design of experiments.
INTRODUCTION
Due to the ability of transforming pollutants into nontoxic mo-lecules without forming any kind of sludge, photocatalysis has been used in many decontamination situations. Semiconductors such as TiO2 and ZnO have been widely used for this purpose, not only for
dye and organic pollutants degradation, but also for water sterilization, eliminating pernicious bacteria and viruses.1,2
Over the past years, ZnO has attracted great attention, mostly due to the variety of morphological structures (nanowires, flower--like structures, discs) and their applications. Atomic arrangements and coordination can play an important role in the photocatalytic process, and materials with special morphology and large specific surface area-to-volume ratio may exhibit higher efficiency in the degradation of organic pollutants than bulk ones.3,4
Considerable efforts have been made to grow high quality ZnO nanoarrays through different techniques and on specific substrates with ideal geometry, array density, and length-to-diameter ratio to optimize their potential applications. Some of the substrates used for ZnO immobilization are aluminum foils,5 copper foils,6 zinc metal,7
glass,8,9 fluorine doped tin oxide (FTO),10 indium tin oxide (ITO)11
and quartz.12 However, the studies found in the literature generally
present only one set of variables, neglecting the synergistic effect among synthesis variables. Therefore, the effect of the synthesis conditions on photocatalytic activity of the prepared samples is not sufficiently discussed, due to a lack of systematic studies.
The aim of this work is to systematically explore the effect of synthesis conditions on the photocatalytic activity of the immobilized ZnO, by applying a circumscribed central composite design of experi-ments. The catalysts were prepared by hydrothermal treatment, the studied variables were NaOH/Zn(NO3)2 molar ratio, time, temperature
and Zn(NO3)2/fructose molar ratio. The substrates used were etched
glass, copper and zinc foils. EXPERIMENTAL
Materials
All reagents were of analytical grade and used as purchased. Zinc
nitrite Zn(NO3)2.6H2O and D-fructose used were from Synth with a
purity of 98%, NaOH was from Nuclear with a purity of 97% and the Ethanol, 2-propanol and acetone were from Dinâmica.
Preparation of ZnO immobilized structures
The route for the synthesis of the ZnO immobilized was adapted from Ma et al.6 The substrates (etched glass, zinc and copper foils,
2.5 × 2.5 cm) were previously ultrasonically cleaned in a succession of acetone, ethanol and 2-propanol. To obtain ZnO immobilized on different substrates, a suspension of Zn(NO3)2.6H2O 0.5 mol L
-1 and
NaOH (from 0 to 4 mol L-1) was initially prepared and stirred for five
minutes. D-fructose was then added and stirred for thirty minutes (con-centration from 0 to 0.25 mol L-1). The suspension was transferred into
Teflon-lined autoclaves with the substrate inclined at the bottom. The samples were submitted to hydrothermal treatment for 1 to 48 hours at 55-115 °C. At the end of the reaction, the plates with the semiconduc-tor were washed with deionized water and dried at 60 °C overnight. Photocatalytic activity evaluation
Photocatalytic activity of the ZnO products was evaluated by decomposition of rhodamine B (RhB) under UV radiation. First, the plates with immobilized ZnO were immersed in 40 mL of RhB solu-tion 10 mg L-1, and maintained in the dark for one hour to establish the
adsorption equilibrium. Next, the system was irradiated with a 125 W medium-pressure mercury lamp for 60 minutes. The irradiation from the lamp was measured and adjusted to approximately 3.5 mW cm-2
(λ = 365 nm) at the beginning of each trial using a radiometer (Cole-Parmer Instrument, Series 9811 Radiometer). The system temperature was kept constant at 30 °C. The dye absorption was determined with a UV/Vis spectrophotometer at λ = 553 nm.
Design of experiments
For each substrate, a circumscribed central composite experi-mental design (CCD) was used to evaluate the variables, NaOH/ Zn(NO3)2 molar ratio, time, temperature and Zn(NO3)2/fructose
molar ratio. This model consists of a factorial design with 2n (n = 4)
Statistica 8 software, which provided the polynomial associated with the photocatalytic reaction system and the response surfaces. The model was statistically validated with the same software using ANOVA (confidence interval 90%).
Sample characterization
The morphology of the products was analyzed by Scan Electron Microscopy (SEM) using a JOEL JSM 5800 microscope. The crystal structure of the ZnO was determined by X-ray diffraction (XRD) on the residual solid at the bottom of the autoclaves, using a Bruker diffractometer with CuKα radiation.
RESULTS AND DISCUSSION
The arrangements of the experimental design can be seen in Table 1, as well as the percentage of rhodamine B degradation obtained for each sample. These results and the SEM analysis are going to be discussed individually for each substrate. The center point replicates of CCD were used to calculate experimental error. Direct photolysis was also investigated, corresponding to a maxi-mum degradation of 10%. All the results expressed here consider the total degradation.
Glass plates results
Despite being the most widely used substrate for catalyst im-mobilization, mainly because of its availability and low cost, glass did not present good results immobilizing ZnO, using the technique adopted here.
Data analysis by ANOVA shows that none of the variables were significant and that the model does not fit the experimental data. Despite the low correlation with the model, the results indicated a tendency to obtain a good response in certain synthesis conditions. The experimental conditions that allowed the highest photocatalytic degradation of rhodamine were those of Experiment 5 with a dye removal of 30%.
Overall, when comparing all the substrates, the glass plates pres-ent the smallest quantity of solid on the surface. The images shown in Figure 1 compare the ZnO microstructures on the glass substrate under different experimental conditions.
Table 1. Values of the variables used in the experimental design and the response of rhodamine degradation for each substrate
Experiment NaOH/Zn(NO3)2 Time Temperature Zn(NO3)2/fructose Glass Zinc Copper
1 2 (-1) 12h (-1) 75 ºC (-1) 4 (-1) 17% 16% 14%
2 6 (+1) 12h (-1) 75 ºC (-1) 4 (-1) 3% 54% 58%
3 2 (-1) 36h (+1) 75 ºC (-1) 4 (-1) 16% 20% 19%
4 6 (+1) 36h (+1) 75 ºC (-1) 4 (-1) 21% 60% 44%
5 2 (-1) 12h (-1) 115 ºC (+1) 4 (-1) 30% 13% 15%
6 6 (+1) 12h (-1) 115 ºC (+1) 4 (-1) 17% 80% 44%
7 2 (-1) 36h (+1) 115 ºC (+1) 4 (-1) 20% 32% 13%
8 6 (+1) 36h (+1) 115 ºC (+1) 4 (-1) 17% 79% 63%
9 2 (-1) 12h (-1) 75 ºC (-1) 14 (+1) 13% 25% 8%
10 6 (+1) 12h (-1) 75 ºC (-1) 14 (+1) 19% 53% 44%
11 2 (-1) 36h (+1) 75 ºC (-1) 14 (+1) 11% 8% 12%
12 6 (+1) 36h (+1) 75 ºC (-1) 14 (+1) 0% 61% 39%
13 2 (-1) 12h (-1) 115 ºC (+1) 14 (+1) 23% 11% 6%
14 6 (+1) 12h (-1) 115 ºC (+1) 14 (+1) 16% 49% 29%
15 2 (-1) 36h (+1) 115 ºC (+1) 14 (+1) 17% 18% 7%
16 6 (+1) 36h (+1) 115 ºC (+1) 14 (+1) 4% 58% 34%
17 0 (-2) 24h (0) 95 ºC (0) 9 (0) 5% 20% 23%
18 8 (+2) 24h (0) 95 ºC (0) 9 (0) 16% 57% 46%
19 4 (0) 1h (-2) 95 ºC (0) 9 (0) 9% 30% 5%
20 4 (0) 48h (+2) 95 ºC (0) 9 (0) 19% 68% 35%
21 4 (0) 24h (0) 55 ºC (-2) 9 (0) 16% 35% 10%
22 4 (0) 24h (0) 135 ºC (+2) 9 (0) 25% 59% 19%
23 4 (0) 24h (0) 95 ºC (0) 0 (-2) 10% 28% 32%
24 4 (0) 24h (0) 95 ºC (0) 18 (+2) 16% 56% 30%
25 4 (0) 24h (0) 95 ºC (0) 9 (0) 20% 62% 32%
26 4 (0) 24h (0) 95 ºC (0) 9 (0) 18% 68% 13%
27 4 (0) 24h (0) 95 ºC (0) 9 (0) 12% 68% 20%
Under the same magnification, Figures 1a and 1c show the differ-ence in the amount of solid deposited in samples 17 (5% degradation achieved) and 22 (25% degradation achieved), respectively. At higher magnifications, Figures 1b and 1c, different morphologies of the samples can be observed. For experimental condition 17, there are small agglomerates of spheres composed by rods, whereas experiment 22 presents a larger amount of irregular formations. When compar-ing the photocatalytic activity of the above-mentioned samples, an increase in the amount of solid and the rod structures can be associated with higher RhB degradation.
Zinc plates results
By analyzing the zinc plates results obtained by Statistica software using ANOVA, a relatively low correlation coefficient of around 0.8 was observed, indicating that the model is not predictive of the experimental data, and a pure error of 12 was obtained. The analysis indicated no interactions between the variables, and the most significant variable was the molar ratio NaOH / Zn, since it presents significant quadratic and linear coefficients.
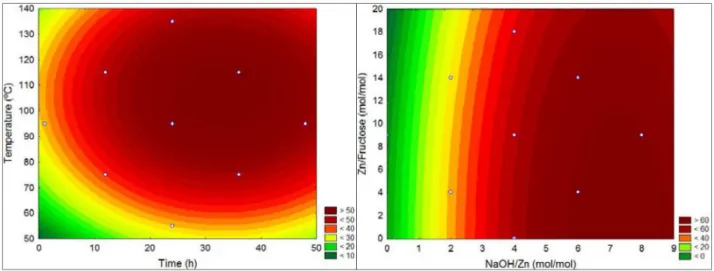
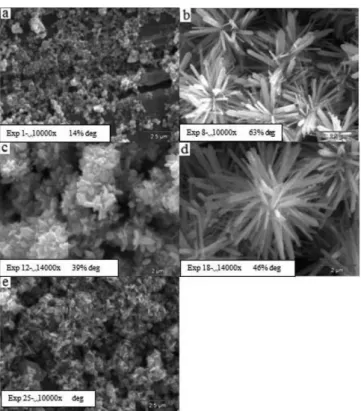
However, in Figure 2, the contour plots of the results for the zinc substrate indicated a tendency in the behavior of the variables. As the observation indicates, the higher the NaOH/Zn molar ratio the higher the dye degradation. This was the same behavior presented by the fructose. As the Zn/fructose molar ratio decreases, meaning an increase in the fructose concentration in the system, the degradation increases. The zinc plate is the substrate which showed the best film adhe-sion and stability after the photocatalytic degradation reaction. In the micrographs shown in Figure 3, different structure formations can be observed, some more ordered, as in experiment 18 (Figure 3d, 57% reduction achieved), and others less, as in experiment 7 (Figure 3b, 32% reduction achieved). Considering the synthesis variables, higher NaOH/Zn molar ratio leads to the formation of the better ordered hexagons.
Time and temperature presented a maximum response region. The effect of these variables becomes apparent when experiments 20 and 22 are compared (see Table 1). In the longest synthesis time, the RhB degradation was higher than the highest temperature in 9%. Generally speaking, high temperatures might cause sintering of the structure. Copper plates results
The analysis of the response values obtained for copper substrate indicates that the model is poorly predictive, yielding a correlation
coefficient of 0.74. No interaction between the variables was observed, and the effect of the NaOH/Zn molar ratio is the most important, due to its linear and quadratic interactions. Time has linear interactions, as can be seen in Figure 4. One important observation relative to the copper substrate is that the experimental conditions used in this research were not in the best area of the experimental design. Only one experiment had degradation above 60%, as illustrated in Figure 4.
The copper plates, as well as the zinc plates, presented the formation of different morphologies and good film stability. The micrographs relating to the samples immobilized on copper sheets can be seen in Figure 5. The samples in Figure 5b and 5d are com-posed of many flower-like structures, formed by nanorods. These nanorods with micro-scale length and nano-scale diameter grow radially outward from the center of the flower. Although the sizes of these nanorods are different, they have a similar appearance, with a sharp tip directing away from the flower.
For the copper plate substrate, better ordination of the structures provides higher dye degradation. Experiments 8 and 18, figures 5b and 5d respectively, presented an ordered array, while experiment 1, figure 5a, presented poor ordination and low dye degradation. XRD characterization
To better understand the samples’ composition, the phase purity and crystallographic structure of the white powder deposited at the Figure 2. Contour plots of the rhodamine B degradation for the zinc substrate
bottom of the autoclaves after the hydrothermal reaction were de-termined by XRD analysis. All peaks can be indexed to hexagonal wurtzite-structured ZnO, consistent with the standard data (JCPDS Card No. 65-3411). Some of the results of the experimental design of zinc plate substrates are shown in Figure 6.
Samples 8 and 16 were both synthesized at a NaOH/Zn molar ratio of 6, a synthesis time of 36 hours and a temperature of 115 °C, differing only in the fructose/Zn molar ratio (4 for experiment 8 and 14 for experiment 16). When the diffractograms of these samples were compared, the intensity of the crystalline peaks presented a significant difference. Under these experimental conditions, fructose
may act by inhibiting the formation of the wurtzite crystalline phase in experiment 8, which has a higher concentration of fructose and presents less intense peaks in comparison to experiment 16.
Regarding the synthesis time, we observed the formation of peaks attributed to crystalline wurtzite phase even within short periods of time, such as 3 hours (data not shown).
The wurtzite ZnO lacks an inversion plane perpendicular to the c-axis, in which Zn2+ and O2- ion pile-up alternatively resulting in the
polarized planes (001) and (00), respectively. The {100} planes are composed of equivalent positive and negative charges at the same plane; therefore they are nonpolar planes with lowest surface energy. In establishing a relation between planes (100) and (002), as shown in Table 2, samples 20 and 24 exhibited preferential growth along the c-axis plane (002), all the other samples demonstrated a preferred orientation towards plane (100).
In an attempt to correlate the prevalence of the polar planes to the photocatalytic activity of the sample, we constructed the chart in Figure 7. From the data obtained, no correlation between Figure 4. Contour plots of the rhodamine degradation for the copper substrate
Figure 5. SEM images of prepared samples immobilized over copper plates
Figure 6. XRD patterns of the obtained samples (powder at the bottom of the autoclave for zinc substrates). The numbers in the Figure refer to the experiments
Table 2. Ratio between the growth axis for different experimental conditions
Sample/ratio 6 8 14 16 20 23 24 25
(100)/(002) 1.49 1.01 1.20 1.13 0.97 1.10 0.98 1.21
(002) preferential growth and enhanced photocatalytic activity was observed.
The present research provides increased comprehension of the effect of synthesis condition on the sample morphology. Different substrates presented different response for ZnO immobilization and photocatalytic activity. For the copper substrate, the plates contain-ing material where orderly growth was predominant — as with the copper plates in experiments 8 and 18 — showed higher values of rhodamine degradation, approximately 63% and 57%, respectively. However, analysis of the zinc plates provides important information about the effect of morphology on the photocatalytic activity of the material. When comparing the zinc samples in experiments 6 and 18 of the experimental design, it was not the perfectly ordered morphology, but rather the intermediate one that revealed the highest photocatalytic activity. Sample 18, consisting of zinc plates with a perfect pattern of hexagonal rods arranged in the form of flowers, presented a significantly lower degradation percentage than sample 6, with 57% removal in comparison to the 80% of the less ordered sample. However, apart from morphology, other factors can affect the photocatalytic activity, for example, mass diffusion. The zinc sample in experiment 18, which demonstrates good order of the synthesized structures, also features a thick solid layer, which can act as a physi-cal barrier to the diffusion of dye molecules into the adsorption sites of the semiconductor.
ZnO growth is a two steps process: nucleation and crystal growth. Most papers on ZnO growth report the need of a seed layer for the nucleation step.13-15 The methodology proposed here does not require
a seed layer and the nucleation took place in the colloidal solution on the substrate. It is important to note the positioning of the plates. When placed on the bottom of autoclaves (no inclination), no film was formed on the plates. The inclination seems to affect the ten-dency to form films, probably duo to the concentration gradient in the suspension. The crystal orientation of substrate is one of the main factors determining the surface morphologies of nanostructures. The interface energy between ZnO/substrate is usually smaller than that of ZnO/solution. As a result, nuclei tend to form on the substrate at a lower saturation ratio than in the solution. The substrate concentration and NaOH used in the present research provided the supersaturated solution required for ZnO growth.
The NaOH/Zn molar ratio was the most significant variable in this study. The alkaline role has been discussed by different authors. With alkaline [HO-]/[Zn2+] ratios lower than 2, Conde et al.16 reported the
Figure 7. Relation between the growth plan orientation and the photocatalytic degradation of rhodamine B
formation of Zn(OH)2. For ratios higher than 2, the particles crystallize
in pure ZnO wurtzite structure. Yamabi and Imai17 studied the pH of
the aqueous solutions. At pH 6.0 – 9.0, Zn(OH)2 was predominantly
formed, while wurtzite ZnO was mainly obtained at pH 9.0 – 13. In the present study, however, only wurtzite was formed, and the higher the NaOH/Zn ratio, the higher the response. The role of fructose is to improve the film adhesion on the substrate, as reported by Ma et al.6 The use of different organic compounds for this purpose, or to
modify the crystal morphology, can be found in literature. Jia et al.18
reported the role of citrate ions on the Zn2+ hydrolysis inhibition and
ZnO growth orientation towards the (0001) plane.
The hydrothermal growth of ZnO has been reported to be aniso-tropic. Furthermore, high crystal quality is made available because the material experiences no thermal stress during growth. Associating the XRD results with the photocatalytic degradation of RhB, it is pos-sible to conclude that the growth increase along the c-axis does not provide better photocatalytic activity, contrary to what some authors claim,2,8,14,19,20 no correlation between these parameters was observed.
In analyzing the morphology of the samples and the photocata-lytic activity response, it is apparent that a perfect formation of the microstructures composed by nanorods does not necessarily have the highest photocatalytic activity. The ZnO covered zinc plate sample that showed the highest dye removal among the experimental designs presented irregular morphology. This irregular morphology may be responsible for the formation of active sites, which there is the trap-ping of photogenerated species, increasing the photocatalytic activity. CONCLUSIONS
A circumscribed central composite experimental design was used for evaluation of the synthesis variables in the preparation of ZnO im-mobilized on three different substrates. Among the substrates tested, zinc plates showed better film adhesion, the highest photocatalytic activity for rhodamine B degradation and better representation of the statistical model, whereas glass showed the worst results. For the zinc and copper substrates, the most important variable was the NaOH/Zn molar ratio, achieving higher values of degradation with higher values of NaOH/Zn. In the case of the zinc substrate, time and temperature showed linear and quadratic coefficients, whereas for the copper substrate, only the temperature showed quadratic coefficient. The SEM images of the ZnO immobilized on zinc foils showed a shorter and wider formation of rods when compared to copper sub-strate. The morphology of the samples provides valuable information. While perfectly ordered hexagonal structures are very important for photocatalytic activity, the best results were derived from the samples that contained a combination of ordered and disordered structures, indicating a synergic effect. By analyzing the powder at the bottom of the autoclaves, wurtzite structure formation can be observed. ACKNOWLEDGMENTS
The authors would like to acknowledge the financial support pro-vided by CAPES (Coordination of Improvement of Higher Education Personnel, Brazilian Government).
REFERENCES
1. Zhang, D.; Liu, X.; Wang, X.; J. Alloy. Compd. 2011, 509, 4972. 2. Yang, J.; Wang, J.; Li, X.; Lang, J.; Liu, F.; Yang, L.; Zhai, H.; Gao, M.;
Zhao, X.; J. Alloy. Compd. 2012, 528, 28.
4. Li, Q.; Chen, Y.; Luo, L.; Wang, L.; Yu, Y.; Zhai, L.;J. Alloy. Compd.
2013, 560, 156.
5. Kaneva, N.; Stambolova, I.; Blaskov, V.; Dimitriev, Y.; Bojinova, A.; Dushkin, C.; Surf. Coat. Technol. 2012, 207, 5.
6. Ma, S.; Li, R.; Lv, C.; Xu, W.; Gou, X.; J. Hazard. Mater. 2011, 192, 730.
7. Hou, X.; Zhou, F.; Yu, B.; Liu, W.; Mater. Sci. Eng. A 2007, 452-453, 732.
8. Tian, Z. R.; Voigt, J. A.; Liu, J.; McKenzie, B.; Mcdermott, M. J.; Ro-driguez, M. A.; Konishi, H.; Xu, H.; Nat. Mater. 2003, 2, 821. 9. Kenanakis, G.; Vernardou, D.; Koudoumas, E.; Katsarakis, N.; J. Cryst.
Growth. 2009, 311, 4799.
10. Wang, L.; Liu, G.; Zou, L.; Xue, D.; J. Alloys Compd. 2010, 493, 471. 11. Guo, M.; Diao, P.; Cai, S.; Thin Solid Mater. 2007, 515, 7162.
12. Xie, J.; Wang, H.; Duan, M.; Zhang, L.; Appl. Surf. Sci 2011, 257, 6358. 13. Chu, D.; Masuda, Y.; Ohji, T.; Kato, K.; Langmuir 2009, 26, 2811. 14. Kenanakis, G.; Vernardou, D.; Koudoumas, E.; Katsarakis, N.; J. Cryst.
Growth 2009, 311, 4799.
15. Peterson, R.; Fields, C.; Gregg, B.; Langmuir 2004, 20, 5114. 16. Conde, M.; Dakhsi, K.; Zouihri, H.; Abdelouahdi, K.; Laanab, L.;
Benaissa, M.; Jaber, B.; J. Mater. Sci. Eng. A 2011, 1, 985. 17. Yamabi, S.; Iami, H.; J. Mater. Chem. 2002, 12, 3773.
18. Jia, L.; Cai, W.; Wang, H.; Zeng, H.; Cryst. Growth Des. 2008, 8, 4367. 19. Han, X. G.; He, H. Z.; Kuang, Q.; Zhou, X.; Zhang, X. H.; Xu, T.; Xie,
Z. X.; Zheng, J. S.; J. Phys. Chem. C 2009, 113, 584.