Article
0103 - 5053 $6.00+0.00*e-mail: [email protected]
Inluence of Intensive Agriculture on Dry Deposition of Aerosol Nutrients
Andrew G. Allen,*,a Arnaldo A. Cardoso,a Antony G. Wiatr,b Cristine M. D. Machado,a
Willian C. Paterlinia and Jacob Bakerb
aInstituto de Química, Universidade Estadual Paulista, CP 355, 14801-970 Araraquara-SP, Brazil
bUniversity of Birmingham, School of Geography, Earth and Environmental Sciences, Edgbaston,
Birmingham, B15 2TT, UK
É apresentado um modelo para quantiicação de fontes e deposição de espécies nutrientes que contribuem com a formação e concentração do aerossol atmosférico. Para este procedimento foram utilizadas ferramentas estatísticas como: a análise de componentes principais (PCA) e análise de regressão linear múltipla (MLRA) associadas a modelos de deposição de partículas segregadas por tamanho. Em região rural do sudeste do Brasil, a queima de biomassa, produtos de reações secundárias, e re-suspensão de poeira do solo possibilitaram explicar 43%, 31% e 21% da massa do MP2.5, respectivamente. A re-suspensão de poeira e a queima de biomassa contribuíram com 22% e 19%, respectivamente, da massa do MP10. A re-suspensão possibilitou explicar cerca da metade da massa das partículas grossas. Cerca de 40% de NO3−−N, 20% de fósforo e 55% de potássio
depositados tem origem nas emissões relacionadas com a agricultura. Atualmente a deposição sobre a loresta tropical é aumentada pelos fatores de 12.2 (N), 6.2 (P) e 2.6 (K) com relação a aqueles que existiam nas condições naturais do passado.
A procedure is presented for quantiication of sources contributing to atmospheric aerosol chemical nutrient concentrations and dry deposition luxes. Source apportionment using principal component analysis (PCA) and multiple linear regression analysis (MLRA) was followed by application of a size-segregated particle dry deposition model. In a rural region of southeast Brazil, biomass burning, products of secondary reactions, and soil dust re-suspension explained 43%, 31% and 21% of PM2.5 mass, respectively. Re-suspension and biomass burning contributed 22% and 19%, respectively, to PM10 mass, and re-suspension accounted for approximately half of the mass of coarse particles. At least 40% of NO3−−N, 20% of phosphorus and 55% of potassium
deposited originated from agriculture-related emissions. Deposition to tropical forest is currently higher than the minimum under natural conditions by factors of 12.2 (N), 6.2 (P) and 2.6 (K).
Keywords: aerosols, pollution, deposition, nutrients, source apportionment
Introduction
On a global scale, the atmosphere is the main source of nutrient inputs to terrestrial and aquatic biomes, with dry and wet deposition contributing roughly equal proportions. Although there are numerically few gaseous nutrient species in the atmosphere (the most important are forms of nitrogen, sulphur and chlorine), all of the nutrients required for plant growth can be found within atmospheric aerosols. However, unlike many trace gases, which are quickly removed from the atmosphere by reaction and deposition, aerosols may be transported over greater distances, allowing for wider geographical dispersal of nutrients prior to
deposition.1 The mix and chemical state of nutrients within
these particles relects the mechanisms by which particles are released into, or formed within, the atmosphere. For example, re-suspension of surface dusts and soils generates coarse mineral particles, combustion processes emit ine aerosols composed of a complex mixture of inorganic and organic components, and particulate sulphates are produced by oxidation of sulphur dioxide. Scavenging of gases by pre-existing particles, followed by reactions in the liquid phase or on surfaces, is a source of nitrates, while reduced nitrogen in aerosols is produced by neutralization of acid species by reaction with ammonia or amines.
major and minor nutrients. Of especial signiicance is the increased contribution of deposition, relative to biological ixation, as a source of bio-available nitrogen.5 Although
deposition is an integral component of the biogeochemical cycling of elements, increased nutrient inputs in polluted regions can cause ecosystem acidiication, eutrophication and reduced species diversity.2 Although some studies have
suggested that stimulation of more rapid plant growth could increase removal of carbon dioxide from the atmosphere,3
potentially partially offsetting increased anthropogenic emissions of the gas, results are not consistent and the opposite effect (increased carbon dioxide emissions from soils, given higher nutrient inputs) has also been reported.4
Information is scarce concerning the role of the atmosphere in nutrient transport in the tropics and subtropics, especially concerning aerosols. The present work was conducted in a rural region of southeast Brazil, where economic activity is largely based on sugar cane production and its associated industries, seasonally responsible for widespread atmospheric pollution. Brazil is the global leader in sugar cane cultivation, with a (2005) production of 420 Mt, equating to 34% of the global harvest, from a planted area of 60,000 km2.6 São Paulo State´s planted area of 29,000 km2
accounts for ca. 60% of Brazil’s total production.7
Experimental
Sampling and analysis
Measurements were made in the municipality of Araraquara, which is centrally located within the main sugar cane growing region of São Paulo State (Figure 1). Equipment was positioned on a well-ventilated rooftop,
ca. 25 m a.g.l., on the Araraquara campus of the State
University of São Paulo (48º 10’ W, 21º 47’ S, 664 m a.s.l.). Between June 2003 and May 2004, particles smaller than 2.5 μm diameter (PM2.5), as well as those in the size interval between 2.5 μm and ca. 15 μm, were collected on
a daily basis (24 h samples) using a stacked ilter unit, and particles smaller than 10 μm (PM10) were collected onto Telon ilters in separate samplers itted with a small inlet impactor to eliminate particles larger than 10 µm. Aerosols were also collected onto Teflon filters in twelve size fractions, using a Micro-Oriice Uniform Deposit Impactor (MSP Corporation, USA). The impactor was operated once per month, for a continuous period of 7 days, during the last week of each month.
Particulate mass concentrations were determined by weighing ilters before and after sample collection, using a Mettler Toledo AX26 microbalance accurate to 1 μg, in accordance with international protocol ISO/CD
15767. The soluble ions NO3−, NH
4+, PO43−, SO42−, Cl−,
C2O42−, HCOO−, CH
3COO−, K+, Na+, Mg2+ and Ca2+ were
analyzed in aqueous extracts of the impactor substrates and ilters, using ion chromatography.8 Determination of
carbonaceous species was based on a relectance method,9
which assumed elemental carbon (EC) to be the principal light-absorbing particulate species present in ambient air.10 A Sunset Laboratory Carbon Analyzer (Model 4L)
was used to determine the relative concentrations of elemental and organic carbon (OC). The mass and chemical composition of coarse particles (PM>10) were determined as the difference between values for PM10 and the sum of the two size fractions collected by the stacked ilter sampler.
Source apportionment procedure
Identiication and quantiication of aerosol sources was achieved using principal component analysis (PCA) followed by multiple linear regression analysis (MLRA) of the 24 h sample data (n = 266). All statistical procedures were performed using SPSS for Windows v. 12.0. The data were initially screened, with any concentrations below detection limit being replaced by zero values, and extreme outliers removed (fewer than 5% replacements in all cases). The principal component extraction method employed orthogonal (Varimax) rotational transformation.
Dry deposition lux estimates
to the material collected on each impactor stage, with a mean modeled dry deposition velocity (Vd) for each size fraction. The dependence of Vd on surface roughness length, according to particle size and atmospheric stability conditions, has been described previously,11,12 and mean
values from the earlier work, corresponding to a mixed crops land use category (LUC) and assuming equal periods of stable and unstable conditions, were used here. Recalculation of Vd to adjust for other LUCs was performed by incorporating the sensitivity to roughness length (z0).13
The selected surface types were typical of southeastern Brazil, and included crops, forest, pasture and water.
Anthropogenic component of aerosol dry deposition
The magnitude of the increase in aerosol nutrient deposition due to current human activity was determined by considering the difference between the measured atmospheric concentrations, and estimated minimum background concentrations. The latter were based on wet season data reported for Serra do Navio, a remote location in northeastern Brazil.14 It is not possible to determine
natural background aerosol concentrations in Brazil during the dry season, due to the extensive anthropogenic emissions at this time, especially from biomass burning. Comparisons considered particles smaller than 2.0 μm diameter (PM2.0) since this was the size fraction measured at Serra do Navio. PM2.0 values for the São Paulo aerosol components were therefore calculated from the chemical component size distribution curves, and used to generate ratios between background and current concentrations. This ratio was then applied to all size fractions.
Meteorological parameters
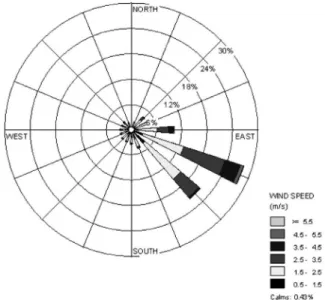
Meteorological data were obtained from the São Paulo State University Meteorological Institute (IPMet) station in Bauru (49º 03’ W, 22º 19’ S). The predominant wind directions recorded between June 2003 and May 2004 were southeasterly and east southeasterly (Figure 2). The highest monthly average temperature was 23.9 oC in December
2003 (summer), with minima of 18.4 oC in August 2003 and
17.8 oC in May 2004 (winter). The lowest monthly mean
wind speed (1.7 m s-1) was measured in June 2003, and the
highest (2.7 m s-1) in March 2004. Monthly mean relative
humidities and precipitation depths relected the existence of dry and wet seasons. The dry season ran from June through September, with monthly precipitation < 60 mm, and the wet season from November through February, with peak monthly precipitation of ca. 190 mm in December
and January (other months were considered transitional).
5-Day air mass back-trajectories, arriving at 00:00 UTC on each sampling day, 50 m a.g.l. at the Araraquara site, were calculated using the NOAA HYSPLIT ((HYbrid Single-Particle Lagrangian Integrated Trajectory) model.15
The model used the GDAS meteorological dataset, which has a grid resolution of ca. 1 degree, and vertical motion
calculation employed omega ield (the HYSPLIT default).
Detection of ires
Biomass burning is widely used as a management practice during the sugar cane harvest, between May and November. Two sources of biomass burning statistics for São Paulo State were used. The irst employed the Moderate Resolution Imaging Spectroradiometers (MODIS) onboard NASA’s Aqua and Terra satellites. Fire detection was based on the emission of mid-infrared radiation.16 Each ire
detection represented the centre of a 1 km pixel lagged as containing one or more actively burning ires within that pixel. The minimum ire size detectable by these satellite-borne sensors is inluenced by many different variables (such as scan angle, biome, sun position, land surface temperature, cloud cover, amount of smoke and wind direction), but is normally ca. 1000 m2.
A separate biomass burning dataset was obtained from the natural resources protection divison (CPRN-Coordenadoria de Proteção de Recursos Naturais) of the São Paulo State Environmental Agency (CETESB-Companhia de Tecnologia de Saneamento Ambiental). Prior permission for every sugar cane burning event in São Paulo State is a legal requirement, which results in a record of the time and location of every sugar cane ire.
Results and Discussion
Inluence of air mass origin on aerosol composition
Results of trajectory analysis showed that, 5 days prior to arrival at the sampling site, air masses had originated over central and southern regions of the South American continent on 42%, and over the South and Mid-Atlantic Ocean on 22% of all measurement days. Approximately 25% of all air masses were classiied as mixed, due to roughly equal residence times over the ocean and continent, and 10% had passed over the São Paulo metropolitan region before arrival. In order to identify any inluence of air mass origin on aerosol concentrations, the dataset was divided into subgroups, with allocation to subgroup (i.e. oceanic,
continental etc.) being determined by observation of the back trajectory of the air mass arriving at the site on each sample collection day.
For both dry and wet seasons, there were no statistically signiicant (ANOVA test, p >> 0.05) differences found between mean particle mass or chemical species concentrations calculated for data grouped according to air mass type, for either PM2.5 or PM10. Particulate mass concentrations were higher during the dry (winter) season, irrespective of air mass origin, with dry / wet season concentration ratios in the range 1.6-3.4 (PM2.5), 1.5-2.3 (PM10), and 2.6-18.1 (coarse fraction). This can be explained by strong seasonality of biomass burning (relected in high K+ concentrations) and soil dust
re-suspension (high Ca2+). During the dry season, mean
concentrations of carbonaceous species and K+ (both
associated with biomass burning) were similar for all air mass types, and therefore were indicative of an even spatial distribution of biomass burning aerosol sources. Atmospheric aerosol concentrations were therefore governed mainly by regional factors.
Annual biomass burning cycle
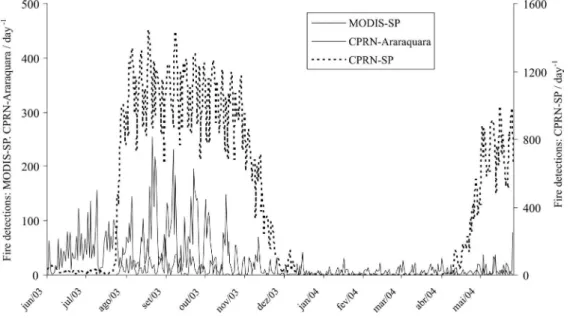
Daily MODIS ire detection frequency for São Paulo State between June 2003 and May 2004 is shown in Figure 3, together with data from the CPRN database for the municipality of Araraquara and for all of São Paulo State. Fires detected by MODIS increased from ca. 25 per day
at the start of the sampling period, reaching a peak of
ca. 250 per day in August and September, followed by a
progressive decrease until mid-November, after which the daily ire frequency remained at ca.10-25 for the remainder
of the measurement period.
The daily number of sugar cane ires in São Paulo State, as recorded by CPRN, remained at ca. 20 per day through
June and into July, then increased to peak in August and September at ca. 1400 per day, followed by a decline in
November and early December. No ires were recorded from late December 2003 through March 2004. Recorded ires then increased during April, reaching peaks of around 800 events per day during May 2004. The daily frequency
of sugar cane ires recorded by CPRN for the municipality of Araraquara followed a similar trend as that obtained for São Paulo State. Differences between the two sources (MODIS or CPRN) can be explained by the insensitivity of the satellite-borne sensor to smaller ires, ires occurring
between satellite overpasses or under cloud cover, and by its ability to detect all types of ire, including scrub burning and ires on waste ground.
Aerosol source apportionment
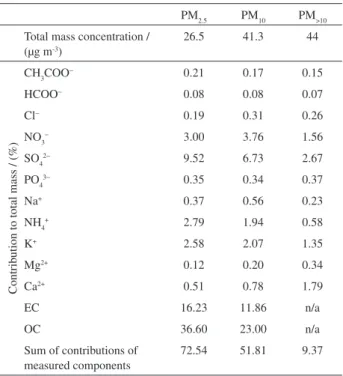
The combined masses of the measured chemical species accounted for 72.5%, 51.8% and 9.4% of the total masses of PM2.5, PM10 and PM>10, respectively (Table 1). The unexplained portions of the masses contained material that was not measured, including silicates, carbonates, water and
(PM>10 only) elemental and organic carbon. PCA analysis
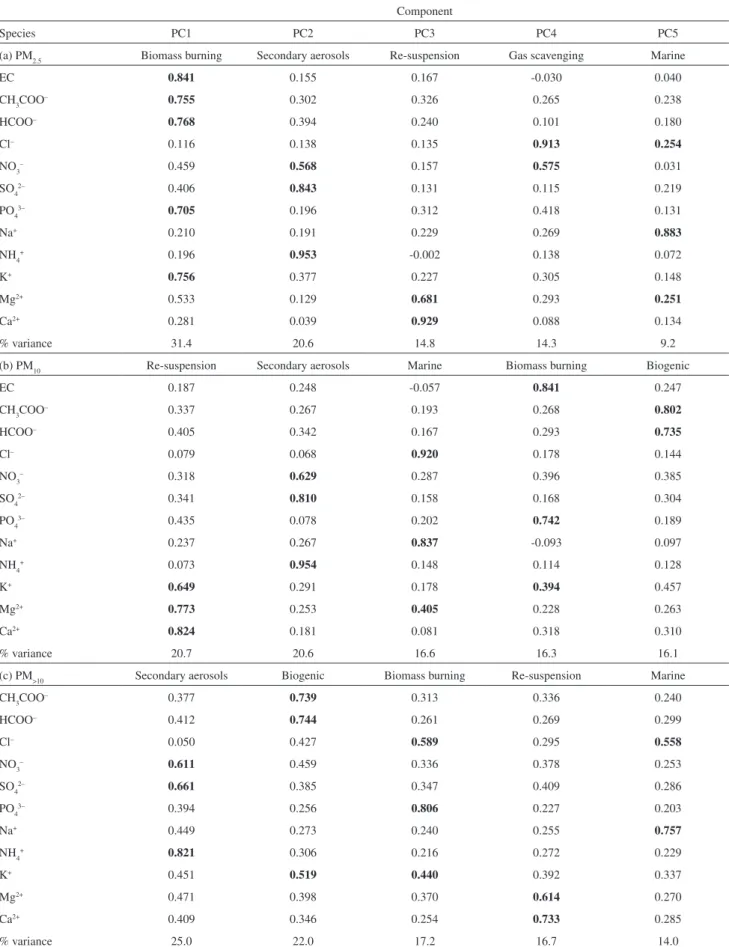
identiied ive components for all size fractions, which explained 90%, 90% and 95% of the total variance for PM2.5, PM10 and PM>10, respectively. Rotated component matrices are presented in Table 2, together with source categories identiied from the loadings for the chemical species. For PM2.5 the irst principal component (PC1-biomass burning) shows high loadings for EC, PO43−, K+, CH
3COO− and
HCOO−. PC2 (secondary aerosols) has a major loading
for NH4+, and high loadings for SO
42− and NO3−. PC3
(re-suspended soils and dusts) has major loadings for Ca2+ and
Mg2+. PC4 (scavenging of gaseous hydrochloric and nitric
acids) has high loadings for Cl− and NO
3−. PC5 shows high
loadings for Na+, Mg2+ and Cl−, indicating the presence of
marine aerosols. For PM10 and PM>10 size fractions, gas scavenging (PC4 for PM2.5) did not appear as a separate
component, but may have been concealed within the re-suspension component. High loadings for CH3COO− and
HCOO− in a separate component indicate the presence of
biogenic material.
All ive of the source components identiied by the PCA procedure were retained for MLRA. Rather than using component score variables, chemical components were selected as source indicators from the component loadings obtained by the PCA process.17 EC was used as
indicator for biomass burning, substituted by PO43− for
PM>10 since EC was not measured in coarse aerosols. For
the secondary aerosol source category, the high loadings for NH4+ indicated its suitability as a source indicator, in all
size fractions. Ca2+ was used as a marker for re-suspended
materials. Cl− was selected for the gas scavenging source
category (PM2.5 fraction only), and Na+ for the marine
aerosol category. CH3COO− represented the biogenic
category. MLRA with stepwise regression was then performed based on the resultant models describing the aerosol mass:
PM2.5 = a (EC) + b (NH4+) + c (Ca2+) + d (Cl-) + e (Na+) + C
PM10 = a (Ca2+) + b (NH
4+) + c (Na+) + d (EC) +
e (CH3COO−) + C
PM>10 = a (NH4+) + b (CH3COO-) + c (PO43-) + d (Ca2+) + e (Na+) + C.
Regression coeficients are denoted by a, b, c, d and e; C
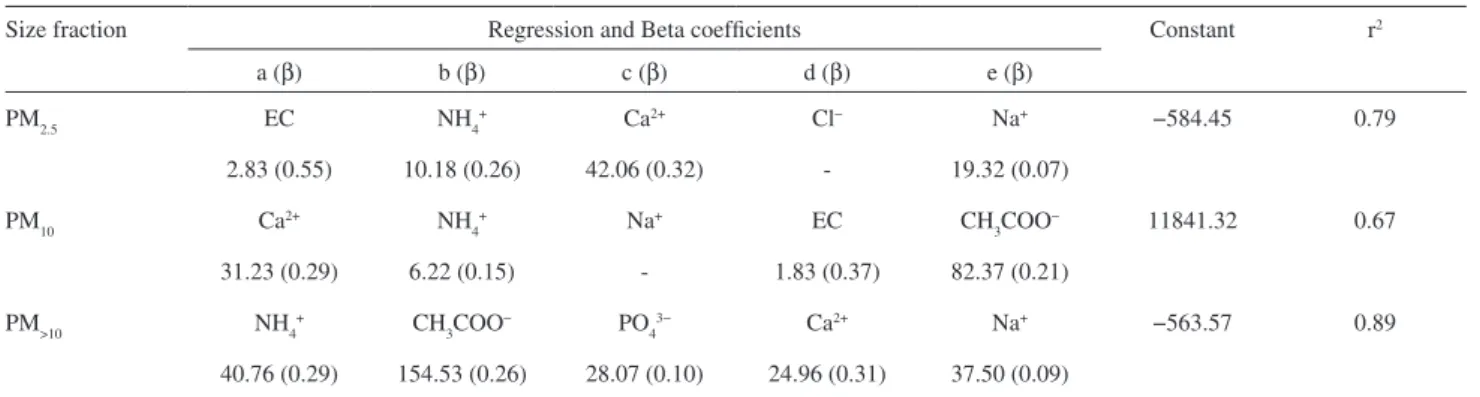
represents the unexplained portion of the mass. Table 3 lists the regression coeficients, standardized beta coeficients (β), constants, and the adjusted r2 values that indicate the
it of the model. The signiicance values of the t-statistics
were below 0.05 for all regression coeficients, except for the gas scavenging component (Cl−) of the PM
2.5 regression
model, for which a signiicance of 0.199 was obtained, and for the marine component (Na+) of the PM
10 regression
model, for which a signiicance of 0.069 was obtained. These components were therefore judged not signiicant, and were excluded from the model.
For the PM2.5 size fraction, primary biomass burning material contributed 43%, secondary aerosols 31%, and re-suspended material 21% of the aerosol mass (Table 4). Re-suspension and biomass burning contributed 22% and 19%, respectively, to the PM10 mass. Re-suspension accounted for approximately half of the mass of PM>10. Masses of PM2.5 and PM>10 were slightly over-estimated, and the model could not account for approximately a third of the total PM10 mass. Overall, these results showed that biomass burning and re-suspension of surface soils, both Table 1. Mean PM2.5, PM10 and PM>10 mass concentrations, and
contributions of measured components (n = 266)
PM2.5 PM10 PM>10
Total mass concentration / (μg m-3)
26.5 41.3 44
Contrib
ution to total mass / (%)
CH3COO− 0.21 0.17 0.15
HCOO− 0.08 0.08 0.07
Cl− 0.19 0.31 0.26
NO3− 3.00 3.76 1.56
SO42− 9.52 6.73 2.67
PO43− 0.35 0.34 0.37
Na+ 0.37 0.56 0.23
NH4+ 2.79 1.94 0.58
K+ 2.58 2.07 1.35
Mg2+ 0.12 0.20 0.34
Ca2+ 0.51 0.78 1.79
EC 16.23 11.86 n/a
OC 36.60 23.00 n/a
Sum of contributions of measured components
72.54 51.81 9.37
Table 2. Varimax rotated component matrices for (a) PM2.5, (b) PM10 and (c) PM>10 fractions, with proposed aerosol sources
Component
Species PC1 PC2 PC3 PC4 PC5
(a) PM2.5 Biomass burning Secondary aerosols Re-suspension Gas scavenging Marine
EC 0.841 0.155 0.167 -0.030 0.040
CH3COO– 0.755 0.302 0.326 0.265 0.238
HCOO– 0.768 0.394 0.240 0.101 0.180
Cl– 0.116 0.138 0.135 0.913 0.254
NO3– 0.459 0.568 0.157 0.575 0.031
SO42– 0.406 0.843 0.131 0.115 0.219
PO43– 0.705 0.196 0.312 0.418 0.131
Na+ 0.210 0.191 0.229 0.269 0.883
NH4+ 0.196 0.953 -0.002 0.138 0.072
K+ 0.756 0.377 0.227 0.305 0.148
Mg2+ 0.533 0.129 0.681 0.293 0.251
Ca2+ 0.281 0.039 0.929 0.088 0.134
% variance 31.4 20.6 14.8 14.3 9.2
(b) PM10 Re-suspension Secondary aerosols Marine Biomass burning Biogenic
EC 0.187 0.248 -0.057 0.841 0.247
CH3COO– 0.337 0.267 0.193 0.268 0.802
HCOO– 0.405 0.342 0.167 0.293 0.735
Cl– 0.079 0.068 0.920 0.178 0.144
NO3– 0.318 0.629 0.287 0.396 0.385
SO42– 0.341 0.810 0.158 0.168 0.304
PO43– 0.435 0.078 0.202 0.742 0.189
Na+ 0.237 0.267 0.837 -0.093 0.097
NH4+ 0.073 0.954 0.148 0.114 0.128
K+ 0.649 0.291 0.178 0.394 0.457
Mg2+ 0.773 0.253 0.405 0.228 0.263
Ca2+ 0.824 0.181 0.081 0.318 0.310
% variance 20.7 20.6 16.6 16.3 16.1
(c) PM>10 Secondary aerosols Biogenic Biomass burning Re-suspension Marine
CH3COO– 0.377 0.739 0.313 0.336 0.240
HCOO– 0.412 0.744 0.261 0.269 0.299
Cl– 0.050 0.427 0.589 0.295 0.558
NO3– 0.611 0.459 0.336 0.378 0.253
SO42– 0.661 0.385 0.347 0.409 0.286
PO43– 0.394 0.256 0.806 0.227 0.203
Na+ 0.449 0.273 0.240 0.255 0.757
NH4+ 0.821 0.306 0.216 0.272 0.229
K+ 0.451 0.519 0.440 0.392 0.337
Mg2+ 0.471 0.398 0.370 0.614 0.270
Ca2+ 0.409 0.346 0.254 0.733 0.285
associated with large-scale agriculture, were the largest sources of aerosols in the study region.
Aerosol dry deposition luxes
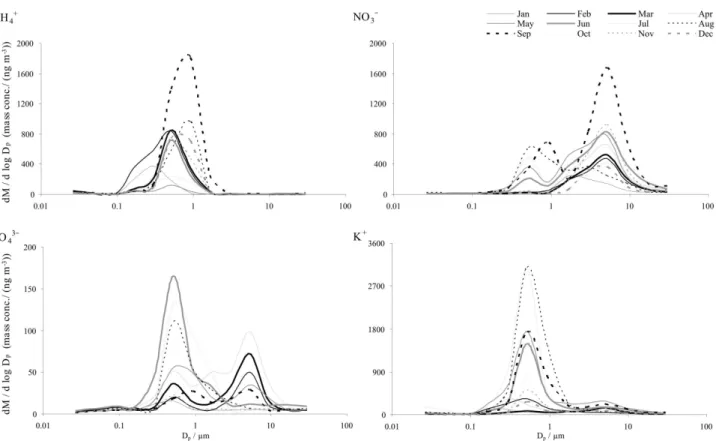
Dry deposition velocities of atmospheric aerosols are governed by the size of the particles as well as the nature of the surface onto which they are depositing, and are higher for very small particles, which diffuse rapidly to surfaces, and for large particles, which are removed by sedimentation. Both diffusion and sedimentation are inefficient for particles in an intermediate size range (around 0.1-1.0 μm). Hence, knowledge of the size-distributed concentrations of aerosol chemical components
is an essential prerequisite for deposition lux calculations. The size distributions of potassium, chloride, nitrate, sulphate and phosphate showed submicron and coarse mode peaks (Figure 4). The submicron peaks relect either emissions during biomass burning (potassium, chloride, phosphate) or secondary production (sulphate). The coarse mode peaks are either indicative of direct emissions of large particles (the only source of coarse mode phosphate), or of scavenging of gases such as NOx, HNO3, HCl and SO2 onto existing particles. Sodium, magnesium and calcium were mainly present within large particles generated by physical processes. Ammonium and oxalate showed submicron peaks only, due to their formation as secondary aerosols within the atmosphere.
Table 3. Results of multiple linear regression analyses for ine, intermediate and coarse particle size fractions
Size fraction Regression and Beta coeficients Constant r2
a (β) b (β) c (β) d (β) e (β)
PM2.5 EC NH4+ Ca2+ Cl− Na+ −584.45 0.79
2.83 (0.55) 10.18 (0.26) 42.06 (0.32) - 19.32 (0.07)
PM10 Ca2+ NH
4+ Na+ EC CH3COO− 11841.32 0.67
31.23 (0.29) 6.22 (0.15) - 1.83 (0.37) 82.37 (0.21)
PM>10 NH4+ CH
3COO− PO43− Ca2+ Na+ −563.57 0.89
40.76 (0.29) 154.53 (0.26) 28.07 (0.10) 24.96 (0.31) 37.50 (0.09)
Table 4. Mean modeled component mass concentrations (μg m-3) and their percentage contributions to PM mass (in parentheses)
Size fraction Biomass burning Secondary aerosols Re-suspension Marine Biogenic Other
PM2.5 12.0 (43) 7.5 (31) 5.5 (21) 1.9 (9) - −0.6 (−4)
PM10 8.9 (19) 5.0 (12) 10.0 (22) - 5.8 (13) 11.8 (35)
PM>10 5.4 (10) 12.4 (17) 22.5 (49) 4.5 (8) 12.1 (17) −0.6 (−1)
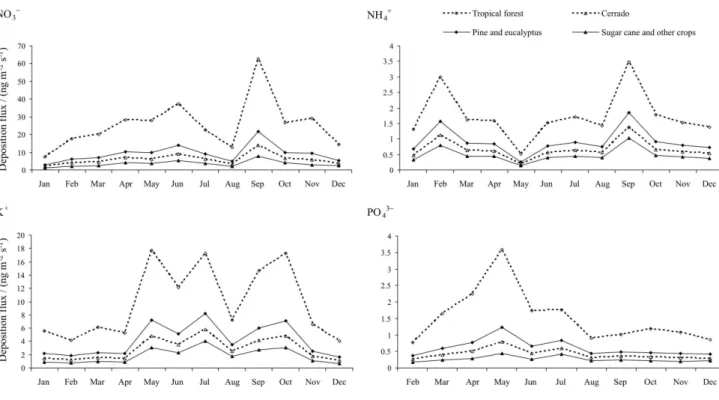
Figure 5. Monthly mean deposition luxes of nitrate, ammonium, potassium and phosphate, according to surface type. For most of the measured species, calculated deposition
rates were higher during the May to October dry season, than the November to April wet season. Although deposition luxes of nitrate, potassium and phosphate were higher during the drier winter months (Figure 5), seasonal trends were not identical for all species. The relationship between deposition rate and biomass burning (Table 5) was most evident for potassium (r = 0.76, p < 0.01), which is directly emitted, and oxalate (r = 0.77, p < 0.01), which is generated by oxidation of hydrocarbons released during ires, with both species showing higher deposition rates during May-October. Nitrate showed a weaker relationship with ire frequency, suggesting the existence of sources additional to biomass burning (such as road transport). Phosphate deposition showed a winter peak in May, and consistently lower luxes between August and December. Sub-micron and coarse modes in the phosphate size distribution could be explained by biomass combustion and re-suspension of fertilized soils, respectively. In contrast to other species, lack of seasonal trends in ammonium concentrations, and no correlation with ire frequency, can be explained by the existence of different sources of gaseous ammonia, having similar magnitudes during either winter or summer periods. During winter in this region, the main source of ammonia is biomass burning, while emissions from soils and wastes are predominant during summer.18 Moderate correlations,
with ire frequency, of sulphate (r = 0.55, p < 0.1), calcium (r = 0.59, p < 0.05) and magnesium (r = 0.58, p < 0.05) can be explained by the emission of SO2 during combustion,
and release of the mineral elements from soils and foliage during ires and vehicle movements in ields.
Deposition luxes were highest to tropical forest and lowest to water and pasture surfaces, reflecting their different roughness lengths (Table 6). Trends in deposition to the different surfaces were similar, but not identical, for all species, due to their different size distributions. The existence of ammonium within sub-micron aerosols is relected in a smaller ratio (3.9) between deposition luxes to tropical forest and water, than obtained for nitrate (ratio of 8.2), a greater fraction of which is present within more rapidly deposited coarse aerosols. The combined dry deposition lux of particulate nitrate-N and ammonium-N to sugar cane plantations (0.37 kg N ha-1 yr-1) is equivalent
to approximately 0.41% of fertilizer N applied annually to plantations (ca. 90 kg N ha-1 yr-1). The luxes of phosphate-P
and K (0.029 and 0.59 kg ha-1 yr-1) are equivalent to 0.1%
and 0.49% of fertilizer applications (ca. 30 kg P ha-1 yr-1
and ca.120 kg K ha-1 yr-1, respectively).
Figure 6. Ratio of aerosol dry deposition luxes (current / natural background) for three surface types.
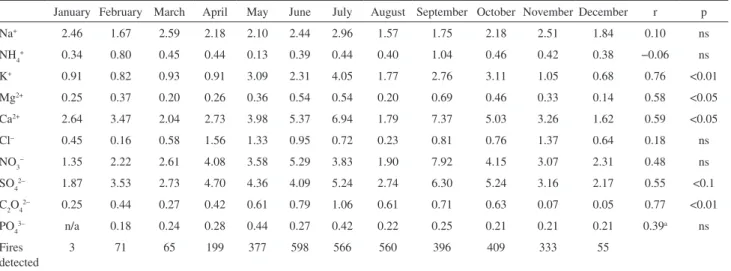
Table 5. Average monthly deposition rates to sugar cane (ng m-2 s-1), number of ires detected (by MODIS) in São Paulo State, and Pearson correlation
coeficients (r) obtained between ires detected and deposition rates (p = level of signiicance)
January February March April May June July August September October November December r p
Na+ 2.46 1.67 2.59 2.18 2.10 2.44 2.96 1.57 1.75 2.18 2.51 1.84 0.10 ns
NH4+ 0.34 0.80 0.45 0.44 0.13 0.39 0.44 0.40 1.04 0.46 0.42 0.38 −0.06 ns
K+ 0.91 0.82 0.93 0.91 3.09 2.31 4.05 1.77 2.76 3.11 1.05 0.68 0.76 <0.01
Mg2+ 0.25 0.37 0.20 0.26 0.36 0.54 0.54 0.20 0.69 0.46 0.33 0.14 0.58 <0.05
Ca2+ 2.64 3.47 2.04 2.73 3.98 5.37 6.94 1.79 7.37 5.03 3.26 1.62 0.59 <0.05
Cl− 0.45 0.16 0.58 1.56 1.33 0.95 0.72 0.23 0.81 0.76 1.37 0.64 0.18 ns
NO3− 1.35 2.22 2.61 4.08 3.58 5.29 3.83 1.90 7.92 4.15 3.07 2.31 0.48 ns
SO42− 1.87 3.53 2.73 4.70 4.36 4.09 5.24 2.74 6.30 5.24 3.16 2.17 0.55 <0.1
C2O42− 0.25 0.44 0.27 0.42 0.61 0.79 1.06 0.61 0.71 0.63 0.07 0.05 0.77 <0.01
PO43− n/a 0.18 0.24 0.28 0.44 0.27 0.42 0.22 0.25 0.21 0.21 0.21 0.39a ns
Fires detected
3 71 65 199 377 598 566 560 396 409 333 55
ns = not signiicant; a Excludes January values, due to dust contamination.
Table 6. Annual dry deposition luxes (kg ha-1 yr-1)
Na+ NH
4+ K+ Mg2+ Ca2+ Cl− NO3− SO42− C2O42− PO43−
Tropical forest 3.73 0.54 3.11 0.67 6.26 1.67 8.04 6.15 0.75 0.61
Pine and eucalyptus 1.53 0.28 1.31 0.27 2.66 0.63 2.89 2.65 0.33 0.23
Savannah 1.06 0.21 0.90 0.18 1.84 0.42 1.89 1.83 0.23 0.15
Orange and coffee 0.78 0.17 0.67 0.13 1.36 0.29 1.29 1.39 0.18 0.11
Sugar cane and other crops 0.69 0.15 0.59 0.11 1.21 0.25 1.11 1.21 0.16 0.09
Pasture 0.65 0.14 0.56 0.11 1.14 0.23 1.04 1.16 0.15 0.09
Water 0.62 0.14 0.54 0.10 1.08 0.22 0.98 1.10 0.14 0.08
perturbed conditions reflect the different atmospheric concentrations of the aerosol species. The values obtained for individual species relect both differences in atmospheric concentrations and the size range of the particles within which they are found. Hence nitrate, which is mainly present in coarse particles, deposits at a much
faster rate than either sulphate or ammonium, both of which are found mainly in slowly depositing ine aerosols.
during the dry season, can be determined directly from monthly mean deposition rates, without need to correct for changes in size distribution. The mean deposition rates of ammonium, nitrate, phosphate and potassium during the period December through March (no sugar cane burning and diminished general activity) were subtracted from the means for all other months (April through November), during which burning occurred and the overall activity level increased. The resulting deposition rates (ng m-2 s-1)
were converted to an annual equivalent rate (kg ha-1 yr-1),
and compared with the total annual deposition luxes listed in Table 6. Expressed as a percentage of the total annual lux, the incremental deposition (irrespective of surface type) due to dry season activity was 40 % (NO3−−N), 20%
(PO43−−P) and 55% (K+). A small negative value (−4%)
was obtained for NH4+−N, which can be explained by the
existence of strong sources of NH3 during both wet and dry seasons. This contrasts with N, P and K, for which strong emissions during the winter dry season were superimposed on seasonally constant emissions from other sources. Since fertilized soils and biomass burning are strong sources of NH3, it can be concluded that agricultural activity was also the major contributor to deposited NH4+−N. Agricultural
practices were the principal source of potassium, and major sources of NO3−−N and phosphorus. Since agricultural
activity (including planting and fertilization) continued during the wet season, the above estimates for the dry
Figure 7. Monthly aerosol size distribution curves for nitrate, ammonium, phosphate and potassium.
season represent a conservative estimate of the annual contribution of agriculture to atmospheric nutrient loadings.
Conclusions
as combustion emissions (from machinery and transport vehicles). These changes will further affect aerosol chemical speciation, and hence nutrient deposition luxes.
Acknowledgments
Financial support was provided by CNPq, Brazil (Process no. 150547/2007-2), FAPESP, Brazil (Process no. 05/53001-8), and NERC, UK.
References
1. Vitousek, P. M.; Sanford, R. L.; Annu. Rev. Ecol. Syst. 1986, 17, 137; Avila, A.; Alarcón, M.; Queralt, I.; Atmos. Environ. 1998, 32, 179; Garstang, M.; Ellery, W. N.; McCarthy, T. S.; Scholes, M. C.; Scholes, R. J.; Swap, R. J.; Tyson, P. D.; S. Afr. J. Sci. 1998, 94, 223; Chadwick, O. A.; Derry, L. A.; Vitousek, P. M.; Huebert, B. J.; Hedin, L. O.; Nature 1999, 397, 491; Balestrini, R.; Galli, L.; Tartari, G.; Atmos. Environ. 2000, 34, 1455; Tyson, P. D.; Gatebe, C. K.; S. Afr. J. Sci. 2001, 97, 106.
2. Bobbink, R.; Heil, G. W.; Raessen, M. B.; J. Ecol. 1998, 86, 717. Henry, R.; Ecologia de Reservatórios: Estrutura, Função e Aspectos Sociais; UNESP: Botucatu, Brazil, 1999; Chen, L.; Driscoll, C. T.; Atmos. Environ. 2004, 38, 4099; Galloway, J. N.; Townsend, A. R.; Erisman, J. W.; Bekunda, M.; Cai, Z.; Freney, J. R.; Martinelli, L. A.; Seitzinger, S. P.; Sutton, M. A.; Science 2008, 320, 889; Davis, S. M. In Everglades: The Ecosystem and Its Restoration; Davis, S. M.; Ogden, J. C., eds.; St. Lucie Press: Florida, 1994; Ahn, H.; James, R. T.; Water, Air, Soil Pollut. 2000, 121, 43; Aidar, M. P. M.; Schmidt, S.; Moss, G.; Stewart, G. R.; Joly, C. A.; Plant Cell Environ. 2003, 26, 389; Oliveira, M. A.; Grillo, A. S.; Tabarelli, M.; Oryx 2004, 38, 389.
3. Reay, D. S.; Nature 2004, 427, 485.
4. Cleveland, C. C.; Townsend, A. R.; Proc. Natl. Acad. Sci. USA 2006, 103, 10316.
5. Fu, J. M.; Winchester, J. W.; Geochim. Cosmochim. Ac. 1994, 58, 1581; Vitousek, P. M.; Aber, J. D.; Howarth, R. W.; Likens, G. E.; Matson, P. A.; Schindler, D. W.; Schlesinger, W. H.; Tilman, D. G.; Ecol. Appl. 1997, 7, 737; Downing, J. A.; McClain, M.; Twilley, R.; Melack, J. M.; Elser, J.; Rabalais, N. N.; Lewis, W. M. Jr.; Turner, R. E.; Corredor, J.; Soto, D.;
Yanez-Arancibia, A.; Kopaska, J. A.; Howarth, R. W.; Biogeochemistry 1999, 46, 109; Holland, E. A.; Dentener, F. J.; Braswell, B. H.; Sulzman, J. M.; Biogeochemistry 1999, 46, 7.
6. http://www.fao.org/es/ess/, accessed in September 2008. 7. http://www.ibge.gov.br/home/estatistica/indicadores/
agropecuaria, accessed in June 2008; Rudorff, B. F. T.; Berka, L. M. S.; Moreira, M. A.; Duarte, V.; Rosa, V. G. C.; Report No. 11421-RPQ/762, Instituto Nacional de Pesquisas Espaciais, São José dos Campos, Brazil, 2004.
8. Da Rocha, G. O.; Franco, A.; Allen, A. G.; Cardoso, A. A.; J. Geophys. Res. 2003, 108(D7), 4207.
9. Yin, J.; Allen, A. G.; Harrison, R. M.; Jennings, S. G.; Wright, E.; Fitzpatrick, M.; Healy, T.; Barry, E.; Ceburnis, D.; McCusker, D.; Atmos. Res. 2005, 78, 149.
10. Horvath, H.; Atmos. Environ. 1993, 27, 292; Horvath, H.; J. Aerosol Sci. 1997, 28, 1149.
11. Nho-Kim, E. Y.; Michou, M.; Peuch, V. H.; Atmos. Environ. 2004, 38, 1933.
12. Zhang, L.; Gong, S.; Padro, J.; Barrie, L.; Atmos. Environ. 2001, 35, 549.
13. Zhang, L.; Brook, J. R.; Vet, R.; Atmos. Chem. Phys. 2003, 3, 2067.
14. Gerab, F.; Artaxo, P.; Gillett, R.; Ayers, G.; Nucl. Instrum. Methods Phys. Res., Sect. B 1998, 136, 955.
15. Draxler, R. R.; Rolph, G. D.; HYSPLIT (HYbrid Single-Particle Lagrangian Integrated Trajectory) Model, access via http://www.arl.noaa.gov/ready/hysplit4.html, NOAA Air Resources Laboratory, Silver Spring: MD, 2003.
16. Giglio, L.; Descloitres, J.; Justice, C. O.; Kaufman, Y. J.; Remote Sens. Environ. 2003, 87, 273.
17. Jennings, S. G.; Ceburnis, D.; Allen, A. G.; Yin, J.; Harrison, R. M.; Wright, E.; Fitzpatrick, M.; Wenger, J.; Moriarty, J.; Sodeau, J.R.; Barry, E.; Irish Environmental Protection Agency report, Project 2000-LS-6.1.M1, Dublin, Ireland, 2005.
18. Machado, C. M. D.; Cardoso, A. A.; Allen, A. G.; Environ. Sci. Technol. 2008, 42, 381.
Received: March 19, 2009
Web Release Date: October 16, 2009