MAJOR ELEMENT CONCENTRATIONS IN MANGROVE PORE WATER,
SEPETIBA BAY, BRAZIL
Christian J. Sanders*, Renato G. S. Barcellos and Emmanoel V. Silva-Filho
Universidade Federal Fluminense Instituto de Química - Departamento de Geoquímica
Rua Otávio João Baptista S/N, Morro do Valonginho Niterói-RJ, Brasil 24020-141
*Corresponding author: [email protected]
A
B S T R A C TConcentrations of cations and anions of major elements (Na+, Ca2+, Mg2+, K+, Cl-, SO 42-) were
analyzed in the pore water of a mangrove habitat. Site specific major element concentrations were identified along a four piezometric well transect, which were placed in distinct geobotanic facies. Evapotranspiration was evident in the apicum station, given the high salinity and major element concentrations. The station landward of an apicum was where major element/Cl− ratios standard
deviations are greatest, suggesting intense in situ diagenesis. Molar ratios in the most continental station (4) are significantly lower than the nearby freshwater source, indicating a strong influence of sea water flux into the outer reaches of the mangrove ecosystem and encroaching on the Atlantic rain forest. Indeed, the SO42-/Cl− and Ca2+/Cl− ratios suggest limited SO42- reduction and relatively high
Ca2+/Cl− ratios indicate a region of recent saltwater contact.
R
E S U M OAs concentrações dos elementos maiores (Na+, Ca2+, Mg2+, K+, Cl-, SO
42-) foram analisadas na água
intersticial de poços piezométricos localizados em diferentes fácies geobotânicas ao longo de um transecto num ecossistema de manguezal na Baía de Sepetiba – Rio de Janeiro. Maiores salinidades e concentrações dos íons maiores são evidencias de evapotranspiração no fácies apicum. Ainda no apicum foram observados os maiores desvios padrão da razão elemento/Cl− durante o período do
estudo, indicando intensa diagênese in situ. Razões molares no piezômetro, localizado na borda do manguezal foram consideravelmente menores do que a fonte de água doce, indicando forte influência do fluxo de água marinha. Os resultados das razões molares, SO42-/Cl− e Ca2+/Cl− na borda do
manguezal adjacente ao continente sugerem limitada redução de SO42- enquanto os valores
relativamente altos na razão Ca2+/Cl− indicam contacto recente com água marinha.
Descriptors: Evapotranspiration, Groundwater, Major element/Cl ratio, Diagenesis. Descritores: Evapotranspiração, Água intersticial, Razão elemento principal/Cl, Diagênese.
I
NTRODUCTIONFluid inclusions are used regularly to gain insight on composition of wetland pore water in a wide range of geological environments (SHEPHERD et al., 2000), including mangrove ecosystems (Ridd and Stieglitz, 2002). Elevated concentrations of major element (Cl−, SO
42−, Na+, K+, Mg2+, and Ca2+) may be
brought about by diagenetic reactions in mangrove ecosystems, where fresh water and sea water interact (SILVA-FILHO et al., 2009). Such geochemical reactions may be heightened in tropical coastal systems where mangrove forests may increase salinity of shallow pore water through extensive evapotranspiration, as salinity commonly increases beyond sea water values (MCGOWAN; MARTIN, 2007). The relationships between submarine groundwater discharge, relative sea level rise and
diagenetic reactions in coastal wetlands have been documented (MOORE, 1999; SILVA-FILHO et al., 2009; SOTO-JIMÉNEZ; PÁEZ-OSUNA, 2010). Major element concentrations of cations and anions may be used to indicate the mixing among water masses and water source.
As chloride is conservative in most diagenetic and biological reactions, the ratio of this element with other solutes, e.g., major element/Cl−
S
TUDYA
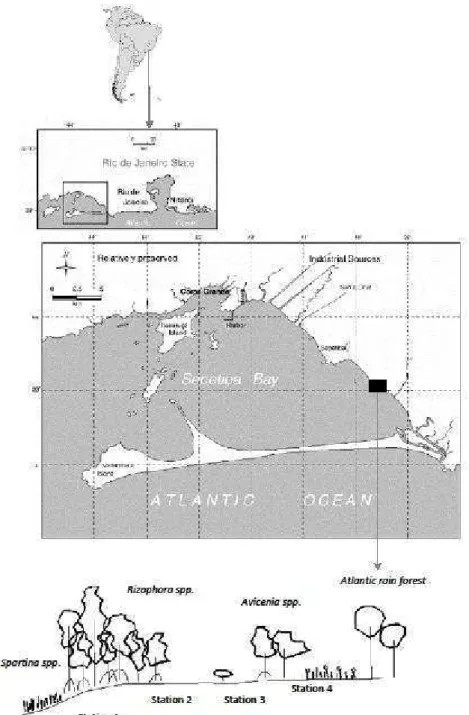
REASepetiba Bay is being located at longitude 44°W; latitude 23°S, near Rio de Janeiro, city (Fig. 1). The bay is approximately 305 km2 and extends 40 km
from east to west and 20 km from north to south. The drainage basin has catchments of 2617 km2 with 22
separate sub-watersheds. The region is under a hot-humid tropical limit with the mean annual precipitation ranging from 1400 mm to 2500 mm. The bay is surrounded by mangrove forests where environmental preservation and urban areas correspond to 20% and 9.2% of the catchments, respectively.
M
ATERIAL ANDM
ETHODSThe study area is located in Brisa Beach, Environmental Protected Area of Sepetiba Bay, Brazil (Fig. 1). To determine the processes associated with dissolved major element/Cl- ratios, yearlong sampling was undertaken in wells along a four station mangrove transect. The four sampling stations were across differing mangrove zones: (1) lower tidal flat, characterized by external mangrove vegetation (i.e. at the edge of the coast, lined with Spartina spp. and Rhizophora spp.) (2) upper tidal flat, characterized by
a hypersaline, unvegetaded apicum zone, (3) internal mangrove, mainly composed of Avicenia spp, near the
spring high tide limit and (4) inland zone, characterized by a grass plain followed by Avicenia spp. The horizontal distances between stations were 30
m. Fresh river water and sea water were also collected near the study site throughout the year and analyzed in the same batch as the samples taken from the wells.
Water samples were collected at each station from piezometers wells between January an December of 2003. The PVC piezometric wells were covered by the 63 m membrane, to prevent suspended material from entering the wells, and inserted to a two meter depth. The water samples were collected from the piezometric wells using 3 m long tubes and syringes to extract the pore water. The pH values were determined using a OAKTON probe. Salinity was determined during each field trip with hand-held YSI sensor. The samples were filtered in situ onto a 45 m filter (GFC glass fiber) and were stored in 60 ml polyethylene bottles, transported to the laboratory in a cool box and stored at fridge temperature (4°C) until analyses. The major element concentrations were determined by an ionic chromatography (SHIMADZU LC-10AD). Precision was determined by measuring a standard after every tenth sample and assessed by calculating the coefficient of variation (standard deviation divided by the average value). The coefficients of the variation were ~1% for Na+ and Mg2+ and ~2% for K+, and Ca2+
concentrations.
R
ESULTSTo define the study area of this work as a mixing zone, a fresh water endmember was established by taking river samples. As sea water values vary little, multiple sampling was deemed unnecessary. The endmember results represent the perspective extreme values of the water masses coming into contact within the region where fresh pore water and sea water meet. The endmember concentrations measured in this study were in agreement with local fresh water and sea water values (Tables 1 and 2). Major element concentrations (Na+, Ca2+, Mg2+, K+, Cl-, SO
42-), pH and salinity are
shown on Table 1. Both cation and anion concentrations are greatest in station 2 where salinity is greatest. In fact the major element concentrations (Na+, Ca2+, Mg2+, K+, Cl-, SO
42-) are significantly
controlled by salinity, the statistics related to the 12 month campaign are as follow: (Na1+, y = 16.0 + 3.7,
r² = 0.98, n= 31, p< 0.05) (Ca2+, y = 0.22x + 10.3, n=
31, r² = 0.66, p< 0.05) (Mg2+, y = 1.7x + 1.6, r² =
0.66, n= 31, p< 0.05) (K1+, y = 0.38x + 0.24, r² = 0.80,
n= 31, p< 0.05) (Cl- , y = 17.0x + 17.7, r² = 0.98, n=
31, p< 0.05) (SO42+, y = 1.0x + 0.17, r² = 0.91, n= 31,
p< 0.05). The average salinity varied greatly between stations 1, 2, 3, and 4 (42.80, 65.73, 5.25 and 6.66, respectively). When average elemental concentrations are normalized by Cl− (element/Cl−), results appear to
be generally conservative for specific elements (Na1+
Ca2+ K1+) along the four station (n=4) of the transect:
Na1+/Cl- (r² = 0.85); Ca2+/Cl-1 (r² = 0.80); Mg2+/Cl- (r²
= 0.23); K1+/Cl-, (r² = 0.69); SO
42+/Cl- (r² = 0.28).
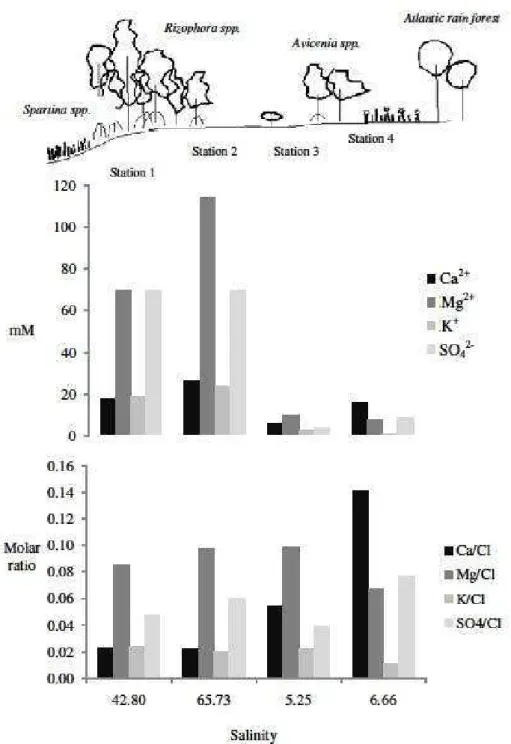
Specific spacial values worth noting are the Ca2+/Cl−
and SO42-+/Cl− ratios in station 4, being generally
higher than the other stations (Fig. 2). In terms of the year long sampling, the major element/Cl− ratio
averages varied greatest in station 3, excluding SO4
2-/Cl− in station 4 (Table 2). As mentioned above,
station 2 showed the highest salinities, increasing up to twice to that of sea water.
D
ISCUSSIONThe major element concentrations and element/Cl− ratios found along the intertidal gradient
are comparable to the values found in Silva-Filho et al., (2009) and McGowan and Martin (2007). Excluding Ca2+/Cl- and SO
42-+/Cl-, specific ratios along
the study area are distinctly similar. In contrast, major element concentrations (Na+, Ca2+, Mg2+, K+, Cl-,
SO42-) show differing distribution gradients, having
site specific elemental signatures significantly influenced by salinity (Fig. 2). The high salinities and major element concentrations found in station 2 correspond to the the open areas within the apicum, suggesting active evapotranspiration in this intertidal region of the mangrove ecosystem. From the molar ratios and concentrations measured in the four stations along the year, are for the most part, considerably lower than values found in nearby river water (Table 1 and 2). Considering the ocean water endmember, these values indicate a strong influence of sea water flux into the mangrove ecosystem pore water, even in the outer limits of the tidal flat where salinity is relatively low. The relatively high salinity in the pore water from within the intertidal region, specifically in station 2, and levels of major element concentrations of cations and anions (Na+, Ca2+, Mg2+, K+, Cl-, SO
42-),
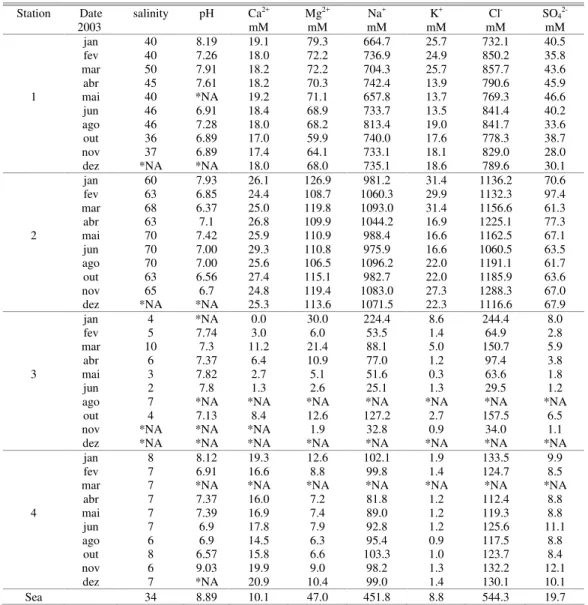
Table 1. The results obtained for salinity pH and the 6 major elements analyzed in the four stations through monthly samplings over a year. Sea water reference values are also presented.
Station Date salinity pH Ca2+ Mg2+ Na+ K+ Cl- SO
4
2003 mM mM mM mM mM mM
jan 40 8.19 19.1 79.3 664.7 25.7 732.1 40.5
fev 40 7.26 18.0 72.2 736.9 24.9 850.2 35.8
mar 50 7.91 18.2 72.2 704.3 25.7 857.7 43.6
abr 45 7.61 18.2 70.3 742.4 13.9 790.6 45.9
1 mai 40 *NA 19.2 71.1 657.8 13.7 769.3 46.6
jun 46 6.91 18.4 68.9 733.7 13.5 841.4 40.2
ago 46 7.28 18.0 68.2 813.4 19.0 841.7 33.6
out 36 6.89 17.0 59.9 740.0 17.6 778.3 38.7
nov 37 6.89 17.4 64.1 733.1 18.1 829.0 28.0
dez *NA *NA 18.0 68.0 735.1 18.6 789.6 30.1
jan 60 7.93 26.1 126.9 981.2 31.4 1136.2 70.6
fev 63 6.85 24.4 108.7 1060.3 29.9 1132.3 97.4
mar 68 6.37 25.0 119.8 1093.0 31.4 1156.6 61.3
abr 63 7.1 26.8 109.9 1044.2 16.9 1225.1 77.3
2 mai 70 7.42 25.9 110.9 988.4 16.6 1162.5 67.1
jun 70 7.00 29.3 110.8 975.9 16.6 1060.5 63.5
ago 70 7.00 25.6 106.5 1096.2 22.0 1191.1 61.7
out 63 6.56 27.4 115.1 982.7 22.0 1185.9 63.6
nov 65 6.7 24.8 119.4 1083.0 27.3 1288.3 67.0
dez *NA *NA 25.3 113.6 1071.5 22.3 1116.6 67.9
jan 4 *NA 0.0 30.0 224.4 8.6 244.4 8.0
fev 5 7.74 3.0 6.0 53.5 1.4 64.9 2.8
mar 10 7.3 11.2 21.4 88.1 5.0 150.7 5.9
abr 6 7.37 6.4 10.9 77.0 1.2 97.4 3.8
3 mai 3 7.82 2.7 5.1 51.6 0.3 63.6 1.8
jun 2 7.8 1.3 2.6 25.1 1.3 29.5 1.2
ago 7 *NA *NA *NA *NA *NA *NA *NA
out 4 7.13 8.4 12.6 127.2 2.7 157.5 6.5
nov *NA *NA *NA 1.9 32.8 0.9 34.0 1.1
dez *NA *NA *NA *NA *NA *NA *NA *NA
jan 8 8.12 19.3 12.6 102.1 1.9 133.5 9.9
fev 7 6.91 16.6 8.8 99.8 1.4 124.7 8.5
mar 7 *NA *NA *NA *NA *NA *NA *NA
abr 7 7.37 16.0 7.2 81.8 1.2 112.4 8.8
4 mai 7 7.39 16.9 7.4 89.0 1.2 119.3 8.8
jun 7 6.9 17.8 7.9 92.8 1.2 125.6 11.1
ago 6 6.9 14.5 6.3 95.4 0.9 117.5 8.8
out 8 6.57 15.8 6.6 103.3 1.0 123.7 8.4
nov 6 9.03 19.9 9.0 98.2 1.3 132.2 12.1
dez 7 *NA 20.9 10.4 99.0 1.4 130.1 10.1
Sea 34 8.89 10.1 47.0 451.8 8.8 544.3 19.7
*NA – data not available
Table 2. Average major element/Cl− ratios and the standard deviatiaons (N between 7 and 10) in the four study stations and in the
freshwater and ocean water endmember values. Ocean water chemical composition was consistant therefore standard deviations are not shown.
point Ca2+/ Cl
-Stdev Mg2+/ Cl
-stdev Na1+/ Cl
-stdev K1+/ Cl
-stdev SO42+/ Cl- stdev
1 0.022 0.002 0.086 0.009 0.899 0.045 0.024 0.006 0.047 0.009
2 0.022 0.002 0.098 0.007 0.891 0.049 0.020 0.005 0.060 0.010
3 0.054 0.013 0.099 0.024 0.779 0.097 0.022 0.014 0.039 0.005
4 0.141 0.011 0.068 0.013 0.770 0.037 0.010 0.002 0.077 0.008
river 0.278 0.070 0.160 0.022 1.180 0.221 0.057 0.037 0.070 0.024
Fig. 2. Average major element concentrations (excluding Cl and Na) against average salinity values from the four studied stations.
The site specific salinity variations indicate a differing sea water intensity within the pore water of each zone, likely triggering geochemical processes along this intertidal system. The high salinities in station 2 demonstrate that some of the saline water is stagnant and exposed to evapotranspiration. To
zone may alter the pore water composition (SANTOS et al., 2008), which is of interest, particularly because pore water discharge to Sepetiba Bay has been reported to be considerably high (SMOAK et al., 2006). Besides salinity, sea water pH may also play a role in the cation and anion concentrations in the stations of this study (Table 1) (MCGOWAN; MARTIN, 2007). Given the relationship between cation and anion concentrations, there appears to be no relation between major element/Cl− ratios and salinity
(Fig. 2). Plots of the major element/Cl− ratios indicate
that the four sites are directly influenced by the geochemical reactions of sea water intrusion, even beyond the outer limits of the tidal flat.
Station 3 is located in an area with the lowest mean saltwater concentration and is the site with the greatest major element/Cl− standard deviations, varying significantly throughout the year. The concentrations and molar ratios variations along the year probably reflect intense in situ diagenesis brought about through tidal pumping and/or local sea level rise, as station 3 is likely on the front where fresh pore water and sea water mix, as indicated by the oscillating low salinities. (Fig. 2)
Station 4, where the Ca2+/Cl− ratios show
relatively high values, resembling a possible stagnant region on the edge of the mangrove ecosystem, or an area of reduced groundwater inflow. As none of the stations exhibit SO42-/Cl− ratios below the average
ratio obtained for sea water values (Table 2), suggesting limited SO42- reduction in station 4
sediment. Some SO42- reduction should occur within
the sediment due to the sulfide present in the pore water (MCGOWAN; MARTIN, 2007). The high SO42-/Cl− ratios may reflect reducing conditions and
metal sulfides in solution. Indeed, in station 4 the SO42-/Cl− molar ratios are higher than both ocean and
river endmembers, strengthening the argument of stagnant pore water or reduced groundwater inflow at this site. Considering the salinity and average pore water molar ratios of Ca2+/Cl− and SO
42-/Cl−, station 4
may represent a region of recent saltwater contact. The assumptions made is this work are supported by studies indicating that Sepetiba Bay is influenced by large ground water discharge (SMOAK et al., 2006), deterimened from Ra mass balance calculations, as well undergoing a relative rising sea level (SANDERS et al., 2008; SMOAK ; PATCHINEELAM, 1999), as indicated through sediment accumulation rates in nearby mangrove forests. As mangrove forests are migrating inland near the study site of this work, studies have indicated sea water intrusion into mangrove forests during the previous decade (SOARES et al, 2000; SOARES, 2011). While mangrove forest migration indicates relative sea level rise in Sepetiba Bay, the data in this study demonstrates some of the bellow ground
geochemical processes associated to salt water intrusion in mangrove pore water. As there is a lack of studies dealing with pore water geochemistry in mangrove habitats, there is a limited amount of literature available for comparative purposes. The results of this study provide an outline for future studies on some of the geochemical processes controlling pore water chemistry in (sub) tropical coastal wetlands where mangroves are prevalent.
C
ONCLUSIONConsidering the river water and ocean water endmembers, the element/Cl− ratios are indicative of
sea water flow into the mangrove pore water, even beyond the outer limits of the tidal flat. From the station furthest inland (station 4), the SO42-/Cl− and
Ca2+/Cl− ratios suggest limited SO
42- reduction and
relatively high Ca2+/Cl− ratios which likely indicate
stagnant waters or reduced groundwater inflow in a region of recent saltwater contact. The oscillating low salinities in stations 3 and the SO42-/Cl− and Ca2+/Cl−
ratios in station 4 are likely caused by the relative sea level rise previously reported in the study area. The results of this study show some of the geochemical processes, such as evapotranspiration and diagenesis, control pore water chemistry in (sub)tropoical coastal wetlands where mangroves are prevalent. The processes that govern changes in the chemical composition of the pore water may be indicative of the sea water intrusion, as shown by the element/Cl−
geochemical tracers outlined in this study.
A
CKNOWLEDGEMENTSThis work is part of the Instituto do Milênio (CNPq/420050/2005-1) and INCT-TMCOcean (573- 601/2008-9). Christian J. Sanders thanks CAPES and FAPERJ, Grant (E-26/101.952/2009).
R
EFERENCESMCGOWAN, K. T.; MARTIN, J. B. Chemical composition of mangrove-generated brines in Bishop Harbor, Florida: Interactions with submarine groundwater discharge.
Mar. Chem., v. 104, p. 58-68, 2007.
MOORE, W. S. The subterranean estuary: a reaction zone of ground water and sea water. Mar. Chem., v. 65, p. 111– 125, 1999.
MOORE, W. S. Fifteen years experience in measuring 224Ra
and 223Ra by delayed-coincidence counting. Mar.
Chem., v. 109, p. 188–197, 2008.
RIDD, P.V.; STIEGLITZ, T. Dry season salinity changes in arid estuaries fringed by mangroves and saltflats. Estuar. coast Shelf Sci., v. 54, p. 1039-1049, 2002.
SANDERS, C. J.; SMOAK, J. M.; NAIDU, A. S.; PATCHINEELAM, S. R. Recent sediment accumulation in a mangrove forest and its relevance to local sea level rise (Ilha Grande, Brazil). J. coast. Res., v. 24, n. 2, p.
533-536, 2008.
SANTOS, I. R., et al. Nutrient biogeochemistry in a Gulf of Mexico subterranean estuary and groundwater derived fluxes to the coastal ocean. Limn. Ocean., v. 53 n.2, p.
705 – 718, 2008.
SHEPHERD, T. J.; NADEN, J.; CHENERY, S. R. ; MILODOWSKI, A. E. ; GILLESPIE, M. R. Chemical analysis of palaeogroundwaters: a new frontier for fluid inclusion research. J. geochem. Explor., v. 69–70 p.
415-418, 2000.
SILVA-FILHO, E. V. et al. Groundwater chemical characterization of a Rio de Janeiro coastal aquifer, SE – Brazil. J. South American Earth Sci., v. 27, p. 100– 108, 2009.
SMOAK, J.; SANDERS, C. J.; MOORE, W. S.; GODOY, J. M.; PATCHINEELAM, S. R. Large submarine groundwater inputs to Sepetiba Bay, Rio de Janeiro State, Brazil. In: AGU FALL MEETING, San Fransisco, Ca, 2006.
SMOAK, J. M.; PATCHINEELAM S. R. Mangroves Salt Marshes,v. 3, p. 17, 1999.
SOARES, M. L. G. Reflexos das alterações climáticas sobre o ecossistema manguezal. In: CONGRESSO LATINO-AMERICANO DE CIENCIAS DO MAR, 14. Balneario Camboriu, SC, Brazil, 2011.
SOARES, M. L. G.; SCHAEFFER-NOVELLI, Y.; CINTRON-MOLERO,G. The use of mangroves as indicators of sea-level changes. In: INTERNATIONAL WETLAND SYMPOSIUM, 6. INTERNATIONAL ASSOCIATION OF ECOLOGY. MILLENNIUM WETLAND EVENT, Quebec, Canada, 2000. p. 213. SOTO-JIMÉNEZ, M. F.; PÁEZ-OSUNA, F. A first
approach to study the mobility and behavior of lead in hypersaline salt marsh sediments: Diffusive and advective fluxes, geochemical partitioning and Pb isotopes. J. geochem. Explor., v. 104, p. 87–96, 2010.