www.scielo.br/rbg
COMPARING P-S CONVERSION POINT LOCATION IN ISOTROPIC AND ANISOTROPIC MEDIA
Fredy A.V. Artola
1, Sergio A.B. Fontoura
2, Ricardo Leiderman
3and Jorge F.F. Sobreira
4Recebido em 10 abril, 2006 / Aceito em 1 setembro, 2006 Received on April 10, 2006 / Accepted on September 1, 2006
ABSTRACT.The determination of the exact position of the P-S conversion point (CP) is an important issue in converted-wave seismology. Frequently, this issue is approached considering that the rock formation is isotropic. This simple approach may lead to significant errors due to the anisotropic features of the subsurface. This paper presents a comparison between the position of the CP obtained from the isotropic solution and the position of the CP considering two types of anisotropy: the transversely isotropic medium with vertical axis of symmetry, the so-called VTI, and an orthorhombic medium. In order to determine the location of the CP, the modeling program ANRAY, based on ray tracing method, was used. It is shown that for the VTI case the discrepancy between the true position of the CP and the one found by assuming isotropy can be in the order of hundreds of meters, even for offset/depth ratio, (X/Z), less than 2. On the other hand, for some particular values of Thomsen’s parametersǫandδ, it can be demonstrated that, the position of the CP practically coincides with the isotropic case. For orthorhombic symmetry (azimuthal anisotropy), the CP, in general, is no longer located in the vertical plane defined by the source-receiver positions, i.e., the discrepancy between CP locations is expressed by an inline and an offline components. The offline component value depends on the anisotropic nature of the medium. This observation is not valid only for orthorhombic models since similar discrepancies can also be observed in cases where the anisotropy is induced by cross-dipping structures or in models with lower anisotropic symmetries.
Keywords: Converted wave, Conversion point, Anisotropy.
RESUMO.A determinac¸˜ao exata do ponto de convers˜ao (PC) do modo convertido PS ´e um aspecto relevante da sismologia da onda convertida. Geralmente, este problema ´e abordado considerando-se modelos isotr´opicos. Mas esta simplificac¸˜ao pode induzir erros significativos devido `a desconsiderac¸˜ao das caracter´ısticas anisotr´opicas do subsolo. O presente artigo apresenta uma comparac¸˜ao no que diz respeito `a posic¸˜ao do PC nos casos isotr´opico e anisotr´opico. No caso anisotr´opico consideram-se as seguintes simetrias: transversalmente isotr´opica com eixo de simetria vertical (VTI) e ortorrˆombica. Os PC’s s˜ao calculados mediante a teoria do raio. Mostra-se que para a simetria VTI a discrepˆancia entre a verdadeira posic¸˜ao do PC e o calculado, supondo isotropia, pode ser da ordem de centenas de metros, mesmo para uma relac¸˜ao afastamento-profundidade menor que 2. Por outro lado, para alguns valores dos parˆametros de Thomsen (ǫeδ), demonstra-se que a posic¸˜ao do PC praticamente coincide com o caso isotr´opico. Para a simetria ortorrˆombica que ´e um caso de anisotropia azimutal, o PC, em geral, n˜ao se localiza no plano vertical definido pelas posic¸˜oes da fonte e do receptor, isto ´e, a discrepˆancia entre a locac¸˜ao do PC isotr´opico ou VTI com relac¸˜ao `a ortorrˆombica possui componentes paralelas e normais ao referido plano. A componente normal depende da intensidade da anisotropia do meio. Esta observac¸˜ao ´e v´alida n˜ao somente para modelos com simetria ortorrˆombica; discrepˆancias deste tipo podem ser observadas em casos onde a anisotropia ´e induzida por estruturas inclinadas ou, em geral, por arranjos el´asticos de mais baixa simetria.
Palavras-chave: Onda Convertida, Ponto de Convers˜ao, Anisotropia.
1Laborat´orio de Geof´ısica de Explorac¸˜ao de Petr´oleo LAGEP, CPGG. Instituto de Geociˆencias, Universidade Federal da Bahia, Rua Bar˜ao Geremoabo S/N, Federac¸˜ao, 40170-290 Salvador, BA. Tels: (71) 3203-8522; 3245-8530; 8117-2013 – E-mail: [email protected]
2Grupo de Tecnologia e Engenharia do Petr´oleo GTEP, PUC-Rio. Rua Marquˆes de S˜ao Vicente 225, Edif´ıcio Padre Leonel Franca, 6oandar – G´avea, 22453-900 Rio de
Janeiro, RJ. Tel: (21) 3114-1459 – E-mail: [email protected]
3Department of Mechanical Engineering, Boston University, Boston, MA, USA. E-mail: [email protected]
tool to classify or distinguish between rock types and fluid types and to help invert data for reservoir monitoring purposes (Davis, 2001). Recent review on the current stage of converted wave te-chnology have been presented by Stewart et al., 2002; 2003.
Assuming that the wave conversion occurs predominantly in subsurface reflectors (Yuan et al., 1998; Zhu et al., 1999), the precise evaluation of the P-S conversion point location is essen-tial for assembling the common conversion point gather for the purpose of velocity analysis. Exact solution exists only for sim-ple case of homogeneous, isotropic media (Schneider Jr, 2002). The experience with isotropic layers shows that the location of the conversion point with respect to either the source or the receiver depends upon the ratio between the P-wave and S-wave velocities and the offset/depth ratio. For a given offset, as the depth of the reflector increases, the locus of the conversion points defines a curve that has an asymptotic value.
The proper evaluation of the conversion point location de-pends mainly on the possibility of dealing realistically with the most relevant physical variables related to the media. The pro-cessed results, obtained after handling the data, depend on the theoretical assumptions used in the determination of these points. For this reason, a correct calculation of these points is necessary because, rather than the CMP binning used in pure-mode proces-sing that is generally based on geometrical criterion, common-conversion-point (CCP) binning techniques are usually applied, instead.
The strong dependence of the conversion point location on physical assumptions concerning rock velocities has been dis-cussed in the last few years (Tessmer & Behle, 1988; Thomsen, 1999). In general, the trend in searching for conversion point des-criptions, in relatively realistic media, was initiated with crude ap-proximations, but it is progressively moving towards a more ade-quate description. In the last few years, a considerable number of technical papers dealing with offset determination for conver-ted waves in anisotropic context have been published. Although these works are limited to VTI media, they constitute an important progress in converted wave seismology. One of these important references is the work of Yuan & Li (2001).
The relevance of anisotropic effect studies in aspects related to converted wave is not limited only to an academic research; it becomes extremely important when physical and processing rameters are estimated from real data. The recovery of these
pa-to estimate the location of P-S conversion points, the 3D, aniso-tropic, seismic modeling computer program ANRAY, based on the ray tracing theory, was used. The solution for isotropic cases is compared to the results obtained taking anisotropy onto conside-ration.
Recently, Yang & Lawton (2002) using Thomsen’s appro-ach, quantified the errors in conversion point determination when VTI media is approached with isotropic simplification, while Ar-tola et al. (2003) analyzed the error for conversion point de-termination when azimuthally anisotropic media are approached with the isotropic simplification. The latter authors showed that the exact conversion point is located outside the vertical plane (offline component of displacement of the exact conversion point). This offline displacement depends mainly on the anisotropic na-ture of the subsurface, the offset/depth ratio X/Z and source-receivers geometrical arrangement. This fact, besides the inline discrepancy between the exact CP and that corresponding to iso-tropic simplification, can affect significantly the spatial resolution of subsurface seismic images.
P-S CONVERSION POINT IN ANISOTROPIC MEDIA
The behavior of the P-S mode in anisotropic media is not a simple subject. Vavryˇcuk (1999) and J´ıleck (2001) have shown some of the inherent complexities of the propagation of this special type of wave. If we consider some of these aspects, it is possible to predict some relevant and “non-expected” properties of the P-S wave propagation in layered media, though, in a strict sense, the term “non-expected” only has meaning for people unfamiliar to seismic anisotropy or other seismic features of complex media.
S
R
M
Xc-ISO
Xc-ANI
∆Xc-inline
∆Xc-offline
Vertival Plane
Horizontal Plane
ϕ
azimuthFigure 1– Conversion point in isotropic and azimuthally anisotropic media.
C-W case, there is a significant distance between the exact loca-tion of the CP and the vertical plane and, the measurement of this distance depends on the anisotropic nature of the subsurface, the offset/depth ratioX/Z and the azimuth of the source-receivers line.
In this work, we show examples of the CP distribution in VTI and orthorhombic (azimuthal anisotropy) media and we compare those cases with the CP location in isotropic media. For this pur-pose, we built a VTI model using Thomsen’s (1986) parameters from an initial isotropic model. The orthorhombic model is built from the VTI model by introducing a system of synthetic vertical cracks in the medium. The compliance tensor associated with this orthorhombic model can be calculated with the aid of thelinear slip crack model, as described by Schoenberg & Helbig (1997) and Schoenberg & Douma (1988), or withpenny-shaped crack model according to Hudson (1981).
VTI model
The starting model consists of a single 1 km-thick isotropic ho-mogeneous layer withV p = 3km/s, V s = 1.5km/s and
ρ=2g/cm3. By usingV pas Vp0, and Vs as Vs0, instead, that
is the vertical velocities in a VTI model, one can determine a set of stiffness tensors for several combinations ofǫ,δandγ (Thom-sen’s parameters). The conversion points were determined using the ray tracing method available in the program ANRAYc, version
4-2.
The source and receivers array are composed of 40 inline re-ceivers equally spaced 50 meters apart, resulting in a minimum offset of 50 m and in a maximum offset of 2 km. For this special symmetry, the conversion point is located in the vertical plane (Figure 2) and the particle displacement of the converted wave P-SV is polarized in the incident plane. As a result of the latter, the discrepancy between X cV T I andX cI S Ois a distance
measu-red in the vertical (inline) plane. Hence, this discrepancy can be calculated subtracting the inline coordinate of X cI S O from the
inline coordinate ofX cV T I(X c=X cV T I−X cI S O).
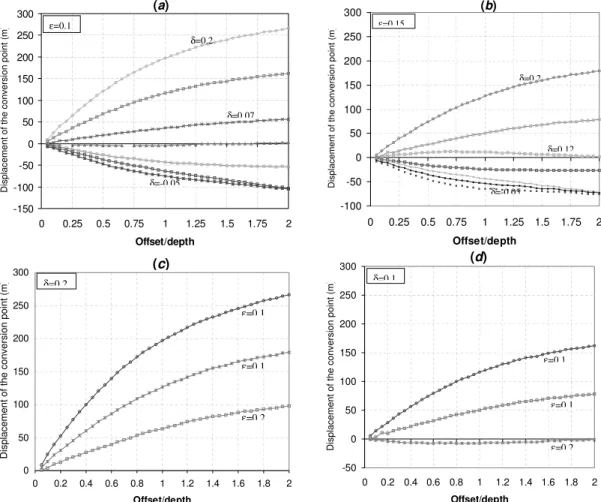
The discrepancy betweenX cV T IandX cI S Ofor several
va-lues ofǫandδis plotted in Figure 3 (a)-(d). In these figures, it can be seen that the discrepancy depends on values associated with the Thomsen parameters as well as on the offset-depth ratio. The value and direction of the conversion point displacement de-pends on the relationship betweenǫandδ. For a fixed value of
XcISO ? ? XM
P-wave S-wave
Figure 2– Conversion point in isotropic and VTI media.
-150 -100 -50 0 50 100 150 200 250 300
0 0.25 0.5 0.75 1 1.25 1.5 1.75 2
Offset/depth
Displacement of the conversion point (m
)
(a)
ε=0.1
δ=0.2
δ=0 07
δ=-0 05
-100 -50 0 50 100 150 200 250 300
0 0.25 0.5 0.75 1 1.25 1.5 1.75 2
Offset/depth
Displacement of the conversion point (m
)
(b)
δ=0 2
δ=0 12
δ=-0 05 ε=0 15
0 50 100 150 200 250 300
0 0.2 0.4 0.6 0.8 1 1.2 1.4 1.6 1.8 2
Offset/depth
Displacement of the conversion point (m
)
(c)
δ=0 2
ε=0 1
ε=0 1
ε=0 2
-50 0 50 100 150 200 250 300
0 0.2 0.4 0.6 0.8 1 1.2 1.4 1.6 1.8 2
Offset/depth
Displacement of the conversion point (m
)
(d)
δ=0 1
ε=0 1
ε=0 1
ε=0 2
0 4 00 8 00 12 00 16 00 20 00
0 400 800 1200 160 0 2000
X coo rdinat e of the conversion po int (m)
Y
c
o
o
rd
ina
te of
t
he
c
o
nv
e
rs
io
n po
in
t (
m
)
SV-VTI ISO
qS1-Ortho
qS2-Ortho
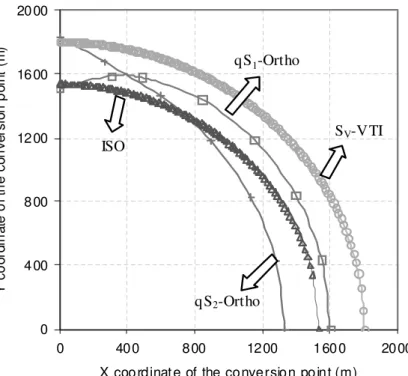
Figure 4– Multiazimuthal conversion point for orthorhombic, VTI and isotropic cases.
either the source or the receiver, when compared toX cI S O. On
the other hand, certain combinations ofǫandδresult inX cV T I
being next toX cI S O. It can be seen in Figures 3 (a) and (b), that
for the pairs(ǫ, δ)→(0.1,0.075);(0.15,0.12),X cV T Iis
very close toX cI S O. This shows that, in some special cases, the
VTI and isotropic CP‘s can be practically the same. It is possible that in some cases, the good results obtained in converted-wave processing, assuming isotropy, might be associated to this fact.
Orthorhombic Model
In order to evaluate the effect of anisotropy in the location of CP in more realistic cases, a new model was built by introducing, in the VTI model, a vertical crack system with crack density(η)=0.1
(weak anisotropy). Due to the presence of the cracks, the medium can be considered as being orthorhombic, i.e., it is no longer azi-muthally invariant. In this case, in general, the polarization vec-tors of the convertedq S1andq S2waves are rotated by an angle
θ, when compared to the corresponding convertedSVandS H waves. In addition to this, as we mentioned already, because of Snell’s Law, the conversion point is located outside the vertical plane. This way, the waves reaching the receivers were reflected from a point in the reflector away from this vertical plane. Conse-quently,X cO RT H Ois shifted fromX cV T IandX cI S Oby
in-line and offin-line components. The offin-line component depends on
the perturbation characteristics introduced to azimuthally invari-ant models. Figure 4 shows the azimuthal variation of the con-version point coordinates associated toq S1andq S2for a fixed
offset of 2 km and the ratio offset/depth = 2. The conversion point coordinates of the P-SV-mode in correspondent VTI and isotropic cases are also plotted.
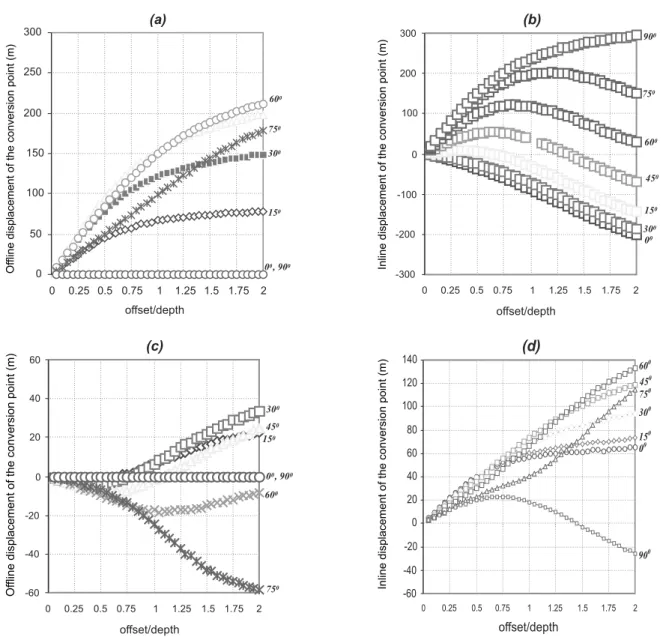
The inline and offline components of the displacement between X cO RT H O and XI S O are plotted in Figure 5. From
these results, it can be seen that the components displacement (inline and offline) of the two converted modes are different when measured with respect to the isotropic CP. If the processing were carried out by means of algorithms based on isotropic assumpti-ons, the error in the location of the CP for certain values of azimuth would be, for this example, in the order of hundreds of meters (up to 15% of the distance source-receiver). The impact of this error in the P-S acquisition design and in the spatial resolution of the images related to these modes can be considerable, affecting both converted modes to different extents.
CONCLUSIONS
com-Figure 5– Offline and inline displacements of the anisotropic conversion point from isotropic case. The curves correspond to several values of azimuth with respect to the direction normal to the cracks. The qS2 component is shown in (a) and (b), and qS2 in (c) and (d).
pared to the isotropic case, has a displacement in the vertical plane. When one considers orthorhombic models, CP‘s have a displacement composed by inline and offline components com-pared to the isotropic and VTI cases. It is important to highlight that there are combinations of Thomsen’s parametersǫ,δ, in VTI cases, for whichX cV T Iis very close toX cI S O.
For more realistic cases, orthorhombic models for instance, the offline component of displacement in CP location depends mainly on the anisotropic nature of the subsurface, the off-set/depth ratio X/Z and the source-receivers geometrical arran-gement. The values of offline displacement components of CP
can be much greater than the ones shown here, if more complex models are considered, in which the crack systems are oblique to the vertical axis. This fact can have important implications on P-S acquisition design. On the other hand, if simple isotropic assumptions were followed, the spatial resolution of subsurface seismic images can be considerably affected.
ACKNOWLEDGEMENTS
for helping with the software ANRAYc and to Vladimir Alvarado for the critical review of the manuscript.
REFERENCES
ARTOLA FAV, FONTOURA SAB, LEIDERMAN R & SILVA MBC. 2003. P-S conversion point in anisotropic media: errors due to isotropic conside-rations. 65thEAGE Conference, Expanded Abstracts.
DAVIS TL. 2001. Multicomponent seismology – The next wave. Geophy-sics, 66(1): 49.
GAJEWSKI D & PˇSEN ˇC´IK I. 1990. Vertical seismic profile synthetics by dynamic ray tracing in layered anisotropic structures. Journal of Geophy-sical Research, 95: 11301–11315.
HUDSON JA. 1981. Wave speeds and attenuation of elastic waves in ma-terial containing cracks. Geophys. J. R. Astr. Soc., 64: 133–150.
J´ILECK P. 2001. Modeling and inversion of converted-wave reflection coefficients in anisotropic media: A tool for quantitative AVO analysis, Ph.D. Thesis, CWP, Colorado School of Mines. 154 pp.
SCHOENBERG M & DOUMA J. 1988. Elastic wave propagation in media with parallel fractures and aligned cracks. Geophysical Prospecting, 36: 571–589.
SCHOENBERG M & HELBIG K. 1997. Orthorhombic media: Modeling elastic wave behavior in vertical fractured earth. Geophysics, 62: 1954– 1974.
SCHNEIDER Jr WA. 2002. A simple, exact solution for the P-SV wave conversion point via prestack migration, Geophysics, 67: 1634–1636.
STEWART RR, GAISER JE, BROWN JR & LAWTON DC. 2002. Converted-wave seismic exploration: Methods, Geophysics, 67: 1348–1363.
STEWART RR, GAISER JE, BROWN JR & LAWTON DC. 2003. Converted-wave seismic exploration: Applications, Geophysics, 68: 40–57.
TESSMER G & BEHLE A. 1988. Common reflection point data-stacking for converted-waves: Geophysical Prospecting, 36: 671–688.
THOMSEN L. 1986. Weak elastic anisotropy: Geophysics, 51: 1954– 1966.
THOMSEN L. 1999. Converted-wave reflection seismology over inho-mogeneous anisotropic media: Geophysics, 64: 678–690.
VAVRY ˇCUK V. 1999. Weak-contrast reflection/transmission coefficients in weakly anisotropic elastic media: P-wave incidence. Geophys. J. Int. 138: 553–562.
YANG J & LAWTON D. 2002. Mapping the P-S conversion point in verti-cal transversely isotropic (VTI) media, 72ndAnnual International Meeting, SEG Expanded Abstracts, 1006–1009.
YUAN J, LI XY, ZIOLKOWSKI A & STRIJBOS F. 1998. Processing 4C sea-floor seismic data: A case example from North Sea: 68thAnnual Internat. Mtg., Soc. Expl. Geophys., Expanded Abstracts, I: 714–717.
YUAN J & LI XY. 2001. PS-wave conversion point equations for laye-red anisotropic media: 71stAnnual Internat. Mtg., Soc. Expl. Geophys.,
Expanded Abstracts, 157–160.
ZHU X, ALTAN S & LI J. 1999. Recent advances in multicomponent processing. The Leading Edge, 18: 1283–1288.
NOTES ABOUT THE AUTHORS
Fredy Alex Villaordu˜na Artola.BSc Geological Engineering, 1992 (UNI-Peru); MSc Applied Geophysics, 1997 (UNB); PhD Applied Geophysics, 2000 (UNB). Visited CPGG/UBBA as a postdoc researcher in 2001. Areas of interest are seismic modeling, seismic anisotropy, ray theory, multicomponent seismology, rock physics and time-lapse seismic reservoir monitoring. Worked in various aspects of these subjects since 1995.
S´ergio Augusto Barreto da Fontoura.PhD Geomechanics,1980, University of Alberta. Areas of interest are rock mechanics and borehole stability.
Ricardo Leiderman.PhD Mechanical Engineering, 2002, PUC-Rio. Area of interest is wave propagation in poroelastic media.