AN ELECTRONIC SOLUTION FOR THE DIRECT CONNECTION OF A
THREE-PHASE INDUCTION GENERATOR TO A SINGLE-PHASE FEEDER
Ricardo Q. Machado
∗ [email protected]Simone Buso
†José A. Pomilio
‡Amílcar F. Q. Gonçalves
∗ [email protected]∗University of São Paulo
Department of Electrical Engineering Av. Trabalhador São-Carlense, 400
13566-590 São Carlos Brazil
†University of Padova
Department of Information Engineering Via Gradenigo 6/B
35131 Padova Italy
‡State University of Campinas
School of Electrical and computer Engineering P.O. Box 6101
13081-970 Campinas Brazil
RESUMO
Este artigo propõe uma solução para a conexão direta de ge-radores de indução trifásicos em uma rede monofásica com regulação de vazão o que faz com que, a velocidade do ge-rador de indução se mantenha acima de sua velocidade sín-crona. Para que a conexão entre gerador e rede monofásica seja satisfatória e para que os critérios de qualidade de ener-gia sejam preservados, o controle do fluxo de enerener-gia, entre a rede monofásica e o conversor PWM trifásico, é realizado empregando a idéia de sistema interligado ajustando a defa-sagem e amplitude da tensão sintetizada pelo conversor em relação a tensão da rede monofásica de forma que o fator de potência na rede monofásica seja unitário. Em relação ao conversor de potência, espera-se que o mesmo produza ten-sões senoidais, com freqüência e amplitude fixas para que o
Artigo submetido em 22/10/2008 (Id.: 00908) Revisado em 10/02/2009, 01/04/2009
Aceito sob recomendação do Editor Associado Prof. Enes Gonçalves Marra
gerador de indução opere balanceado. O artigo descreve a estratégia de controle do inversor, o critério de projeto dos controladores e apresenta alguns resultados experimentais.
PALAVRAS-CHAVE: Conversor PWM, Gerador de Indução, Controle Digital, Qualidade de Energia, Conversão Mono – Trifásica, Eletrificação Rural.
ABSTRACT
in-verter that additionally guarantees the local power quality. A system with good power quality must have sinusoidal and constant amplitude voltages, fixed frequency operation, bal-anced induction generator voltages and currents, harmonics and reactive power compensation. The paper describes the inverter control strategy, presents design criteria of the con-trollers, and shows experimental results.
KEYWORDS: PWM power converter, Asynchronous ma-chine, digital control, power quality, single-phase to three-phase conversion, rural electrification.
1
INTRODUCTION
The advantages of the three-phase induction machine have encouraged significant efforts in seeking approaches to over-come the Induction Generator (IG) poor voltage regulation and frequency variation (Simões and Farret, 2004; Marra and Pomílio, 2000). Some advantages of the induction machines are its robustness, simple construction, little maintenance re-quirements, wide availability, low cost, and higher power-weight ratio when compared with other electrical machines.
Customers in rural areas, that usually have a single-phase feeder, may request a three-phase system from the utility. However, it can be uneconomical with regard to the cus-tomers needed (Moncrief, 1996). On the other hand, there might be energy sources available in some of these areas to produce electric power. For this situation, some authors have proposed the direct connection of the induction generator to the single-phase feeder to obtain three-phase balanced volt-ages (Chan, 2007; Machado et alii, 1999). Some of these al-ternatives, based on the ‘Steinmetz’ connection, operate only under strict conditions and are affected by the AC load vari-ations. An alternative technique is based on current control (Machado et alii, 1999), but this is not able to guarantee the AC voltage controllability.
2
PROPOSED SYSTEM
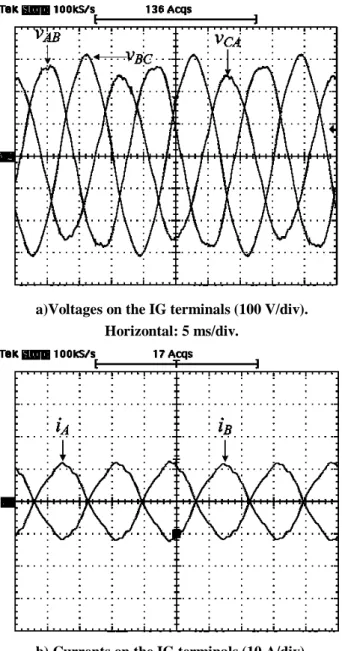
The proposed system comprises an IG directly connected to a single-phase feeder. As the direct connection of an IG to the single-phase feeder causes strongly unbalanced voltages and currents at the IG terminals as shown in Fig. 1, a three-phase inverter is connected to balance the IG voltages and, as a consequence, its currents.
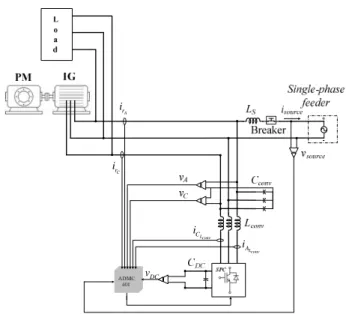
Fig. 2 shows the complete system. The role of the Static Power Converter (SPC) is to regulate the power flow and to guarantee the local power quality. Such converter is a three-phase voltage source PWM inverter. The inductorsLconvare used to connect the inverter output to the Point of Common Coupling (PCC) where the IG, the local load and the single-phase feeder are connected. The AC capacitors (Cconv),
to-a)Voltages on the IG terminals (100 V/div). Horizontal: 5 ms/div.
b) Currents on the IG terminals (10 A/div). Horizontal: 5 ms/div.
Figure 1: Three-phase induction generator connected to the single-phase feeder.
gether with the inductors, provide the necessary high fre-quency filtering, resulting an AC voltage free of switching noise. Part of the total capacitance (Cconv) is designed to al-low the IG self-excitation that could be necessary in case of islanding operation.
A
r
i
C
r
i
DC
v
Lconv
A
i
Lconv
C
i
Figure 2: Proposed system structure.
feeder. Otherwise, it is possible to absorb additional power from the feeder.
If a contingence forces the system to go to islanding condi-tion, i.e., to disconnect the feeder, and the local demand is higher than the generation, non-critical loads must be cut off. Otherwise, some strategy must be adopted to consume the excess of generated power as, for example, connecting addi-tional loads in order to adequate the generated power to the demand. When the islanding operation must be concluded, it is necessary to guarantee the voltage synchronism before reconnecting the feeder.
Since the inverter does not manage real power, it is not nec-essary to have a DC source in the DC link. Nevertheless, as will be shown afterwards, the system is also able to the man-age power provided by DC sources connected to the inverter DC side, as a battery bank or a photovoltaic panel.
3
SYSTEM OPERATION
The system operation imposes sinusoidal symmetric and bal-anced voltages on the AC bus. The stability of these voltages automatically provides the reactive power compensation, as-suring that the IG will continue to run normally without los-ing magnetization, even feedlos-ing a heavy inductive load.
On the hypothesis that the inverter is able to maintain si-nusoidal voltage for any kind of local load, and suppos-ing the internal IG voltage and the feeder voltage are si-nusoidal, their respective currents must also be sinusoidal. This means that the system also provides harmonic compen-sation, without any kind of current distortion measurement.
source
V
β
S
L
V
V
ABsource
V
source
I
Absorbing power Delivering power
AB
V
S
L
V
source
I
β
a) Delivering power to the feeder.
b) Absorbing power from the feeder.
Figure 3: Phasorial diagrams.
In fact, the filtering effectiveness depends on the inverter out-put impedance compared with the other system impedances (AC filter, IG and single-phase feeder impedances).
Another system feature is that the local voltage is adjusted in order to result in unity power factor (PF) to the single-phase feeder, maximizing the active power flow. The connection with such feeder is made with an inductor (LS). In order to control the power flow, it is necessary to adjust the local AC bus voltage amplitude (VAB) and theβ angle between pha-sorsVAB and the single-phase feeder voltage (Vsource). If the phasorsIsource(single-phase feeder current) andVsource have the same direction the system delivers power to the feeder. Otherwise, if they have opposite directions, the sys-tem consumes power, as shown in Fig. 3.
To determine theβangle it is necessary to know the differ-ence between the generated and the locally consumed power (Pr), the connection reactance (XLS) and to measure the rms
voltage of the single-phase feeder (Vsource) according to (1).
The voltage amplitudeVAB is calculated according to (2). Obviously, any variation on this voltage affectsPr. However, designing the coupling inductor for a small voltage drop, the variation in the AC local voltage can be small enough not to significantly affect the power calculation and theβangle. As the single-phase feeder voltage can vary, the local voltage has to follow such variation in order to maintain the unity power factor.
β =arctan
PrXLS
V2
source
(1)
VAB=
Vsource
cosβ (2)
3.1
L
SDesign criteria
mH -S
L
kW
-source
P
- % 100 .
source
source ✁ ✂
✄
☎ ✆
n V V
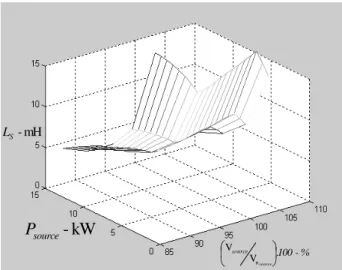
Figure 4: Coupling inductance value (LS) for different power levels and PCC voltage.
voltage can vary from –7.5 % to +5 % around the rated value
(Vnsource). In the worst case, the voltage variation can be –
10 % to +5 %. As shown in Fig. 3, the voltage produced by the inverter must be higher than Vsource. A 5 % increment is sufficient to allow a reasonableβangle resolution. Thus, the local voltage range is –5 % to +10 % around the rated value of the single-phase feeder voltage.
The inductance value can be determined considering that the rated power must flow through the feeder for any voltage in the given range. The induction value for voltage variation in different power levels can be found solving (3), and its result is shown in Fig. 4. Whereωiis the fundamental frequency of the feeder in rad/s and the selected inductance must be the minimum value for a given power
LS=
tan(β)V2
source
ωiPr
(3)
3.2
Comparative efficiency between of
the line-interactive and double
con-version systems
The efficiency of the solution discussed in this paper can be compared to that of the conventional three-phase inverter + single-phase rectifier arrangement (double-conversion sys-tem).
It is important to underline that the percentage of load power flowing through the inverter stage of the proposed solution is always lower than unity, depending on the load configura-tion. Because of that, even if it was neglected the losses that, in a conventional double conversion solution, take place in
the rectifier stage, the proposed solution offers an efficiency improvement. To quantify that, it is possible to define a rela-tionship between double-conversion and line-interactive effi-ciencies:
ηdouble−conversion= 1−
Plossesdouble−conversion
P =ηconv
(4)
ηline−interactive= 1−
Plossesline−interactive
P (5)
Now, if it was assumed the inverter stage has a given effi-ciency (ηconv), assumed to be constant for the two solutions, it can be said that:
Plossesdouble−conversion =
Plossesline−interactive
x (6)
where,Plossesrepresents the power lost in the inverter stage,
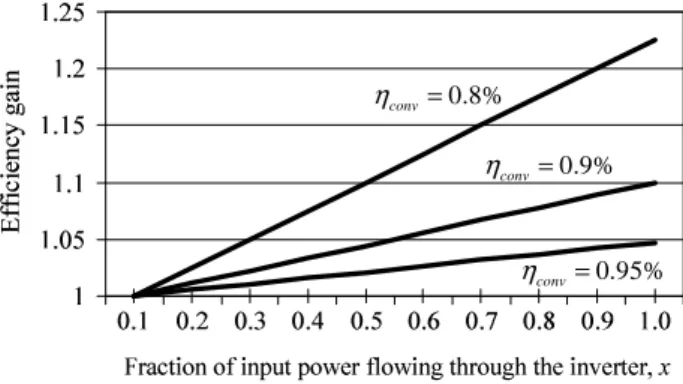
P is the input power (assumed to be the same in both cases) and “x” is the percentage of input power that flows through the three-phase inverter in the line-interactive solution (de-pending on the load arrangement). In (6) basically is said that the power lost in the inverter stage is directly related to the power flowing through it, being the inherent inverter effi-ciency the same. This is a worst case assumption because, of-ten, the converter processing lower power will have a higher efficiency. Nevertheless, substituting (6) into (4) and (5), the “efficiency gain” can be obtained as follows:
ef f iciency gain= ηline−interactive
ηdouble−conversion
=x+1−x
ηconv (7)
Fig. 5 represents the efficiency gain between the proposed solution (line-interactive system) and a double-conversion system. As can be seen, in all cases when the inverter of the line-interactive solution processes a fraction of the input power, there is an efficiency improvement, which can be par-ticularly significant if the adopted inverter happens to have a relatively low inherent efficiencyηconv.
4
CONTROL STRATEGIES
4.1
Inverter Output Voltage Control
✝ ✝ ✞ ✟✠ ✝ ✞ ✝ ✝ ✞ ✝✠ ✝ ✞ ✡ ✞ ☛ ☞✌✍ ✎✏ ✑✒✑ ✓ ✏ ✒✔✕ ✎ ✔✑✖✗☞ ✓✘ ✑✖ ✏ ✒✙ ✎✚ ☞✑✕✙ ✚✎✚ ✗ ✏ ✒✛✗☞ ✎ ✗☞ ✜✢ ✣ ✤ ✤ ✥ ✦ ✥ ✧ ★ ✦ ✩ ✪ ✫ ✥ ★ ✬ ✭ ✮ ✬ ✭ ✯ ✬ ✭ ✰ ✬ ✭ ✱ ✬ ✭ ✲ ✬ ✭ ✳ ✬ ✭ ✴ ✬ ✭ ✵ ✬ ✭ ✶ ✮✭ ✬ 0.8% conv η = 0.9% conv η = 0.95% conv η =
Figure 5: Efficiency gain as a function ofxandηconv.
i PI conv L i αβ v PI * Cconv v αβ conv C v αβ 2 G 1 G * L conv i αβ conv sC SVM 1 conv sL 1 conv sC vCconvαβ
1 L Z volt k cur k
Figure 6: Overall model of the system.
flow conditions. This can be obtained since the inverter out-put impedance is substantially lower than the source and IG impedances. In this way, the inverter will be able to impose the three-phase voltage, as well as to conduct the greater part of the load current harmonics.
Such low output impedance is obtained not only by properly designing the output low-pass filter, but also using adequate control strategies. As shown in Fig. 6, selective filters are used to increase the gain at some selected frequencies in or-der to minimize the respective errors, thus improving the out-put voltage waveform quality (Buso et alii, 2001; Mattavelli, 2001). An additional feed-forward branch allows reducing the delay on the voltage correction due to the output filter capacitor. To have a faster response, the input of the space vector modulator block (SVM) receives a direct signal from the voltage reference.
The proportional-integral controller (PI) was chosen as the control technique. The current and voltage controls are im-plemented in theαβ reference frame. Thekcur andkvolt gains represent the respective sensor scaling factors. The feed-forward gains G1 and G2 are always lower than one. The SVM block is the gain between space-vector routine and the output voltage produced by the inverter, including the in-verter DC voltage value.
The desired closed loop cut-off frequency (ωCLi) is 6.28 krad/s (1 kHz) and the respective phase margin (mfi) is 70˚. For these calculations the inverter output voltage is supposed
to be applied to a simple inductive load (Lconv = 1.8mH), what is not exactly the case, but is an acceptable simplifica-tion. The uncontrolled system open loop gain (GOLi) at the cut-off frequency, together with the performance parameters, defines the proportional and integral constants (kpropiand
kinti) according to (8) and (9) (Machado et alii, 2006; Machado et alii, 2005).
kpropi
GOLi
ωCLi
= 1 (8)
kinti=kpropi
ωCLi
tan(mfi)
(9)
The closed loop cut-off frequency was chosen about one decade below the sampling frequency so that the current reg-ulator still has a good compensation capability in the fre-quency range of interest.
Fig. 7a presents the closed loop frequency response of the current controller. Two situations are considered: the first one considers the load connected to the SPC terminalsZL = 0whereas, the other usesZL = ∞. There is a small error in the gain due to the output filter model simplification but it does not affect significantly the overall response. However the phase error is significant at the feeder frequency (60 Hz, 377 rd/s). A feed-forward of the voltage reference is used to guarantee a minimal error between current reference and the output current produced by the inverter.
The voltage loop guarantees a low error between the refer-ence voltage, as calculated by (1) and (2), and the output voltages produced by the inverter. For the PI voltage com-pensator, the desired closed loop cut-off frequency (ωCLv) is 628 rd/s (100 Hz) and the phase margin (mfv) is 70˚. These values, together with the system open loop gain (GOLv), al-low defining the proportional and integral constantskpropv (10) andkintv(11).
kpropv
GOLv
ωCLv
= 1 (10)
kintv=kpropv
ωCLv
tan(mfv)
(11)
Fig. 7b presents the closed loop response of the voltage PI showing a good agreement between no load (ZL=∞) situ-ation and rated loading in the frequency range of interest.
0
L
Z
=
0
L
Z
=
L
Z
= ∞
L
Z
= ∞
a) Close loop response of the current controller.
-10 -5 0 5 10
M
a
g
n
itu
d
e
(
d
B
)
101 102 103 104
-45 0
P
h
a
s
e
(
d
e
g
)
Frequency (rad/sec)
L
Z
= ∞
rated load
L
Z =
L
Z
= ∞
rated load
L
Z
=
b) Close loop response of the voltage controller.
Figure 7: Bode diagram.
and provide good control of the output voltage, a tuned reso-nant filter at the fundamental frequency, 3rd and 5th harmon-ics and a feed-forward of the capacitive current are put in parallel to the conventional voltage regulator, so as to boost the loop gain at the fundamental frequency. Thus, in the fre-quency range of interest both amplitude error and phase er-ror are negligible, as can be seen in Fig. 7b (phase response) (Machado et alii , 2006; Machado et alii, 2005).
4.2
Inverter DC Link Voltage Control
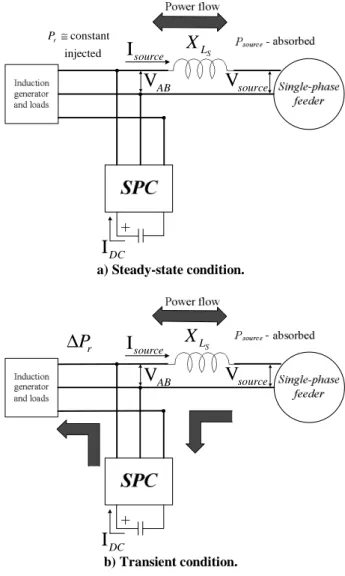
When the power balance is disturbed due to: a load vari-ation, a generated power fluctuation or to any single-phase feeder disturbance, the control system acts adjusting the volt-ageVAB in order to alter the power flow in the single-phase feeder. During such transient, the power unbalance flows through the inverter, changing the DC voltage.
For example, in steady state the IG supplies the load and the remaining power is sent to the feeder. No active power flows
injected constant
Pr≅
S
L
X
V
ABV
sourceI
sourceI
DCa) Steady-state condition.
r
P
∆
I
X
LSsource
I
DCV
ABV
sourceb) Transient condition.
Figure 8: DC voltage correction.
through the inverter. A sudden load increase will disturb such equilibrium until the new steady state pair (VAB, β) is reached. The inverter provides the additional active power, consuming the energy stored in the DC link capacitor.
In order to maintain constant the DC bus voltage, the specific control circuit adjusts only theβangle, based on the DC link voltage deviation, as illustrated in Fig. 8. During the tran-sient, the unity power factor restriction is relaxed; even so it is always close to unity.
For a perturbation in the DC voltage, while the new operation point is not established and considering the DC voltage is almost constant due to a high capacitance value.
∆Pr= ∆PDC = ∆IDCVDC (12)
DC
PI
1DC
sC
β
∆
V VV
S
AB source
DCXL
V
DC* IDCV
DCV
DCvolt
k
Figure 9: DC link voltage control.
the single-phase source. The variation ofPsource(∆Psource) can be expressed as in (13). Assuming smallβvalues, (13) can be linearized as in (14).
∆Psource=
VABVsource
XLS
sinβ (13)
∆Psource=
VABVsource
XLS
∆β (14)
Substituting (14) into (12), the relation between a smallβ
angle variation and the DC link current variation (∆IDC) can be found (15).
∆IDC=
VABVsource
VDCXLS
∆β (15)
Based on this model, it is possible to derive the block dia-gram of Fig. 9, which represents a linear approximation of the system that allows designing the DC link PI controller.
Similarly to the current and voltage control, the parame-ters for the PI controller are calculated for a closed loop crossover angular frequency (ωCLDC) of 10.68 rad/s (1.7 Hz) and a phase margin (mfDC) of 75˚. For the open loop gain (GOLDC) it is possible to calculate the proportional (16) and integral (17) constants kpropDC andkintDC. The DC capacitance (CDC) is 2820µF and its design criterion can e found in Appendix A.
kpropDC
GOLDC
ωCLDC
= 1 (16)
kintDC =kpropDC
ωCLDC
tan(mfDC)
(17)
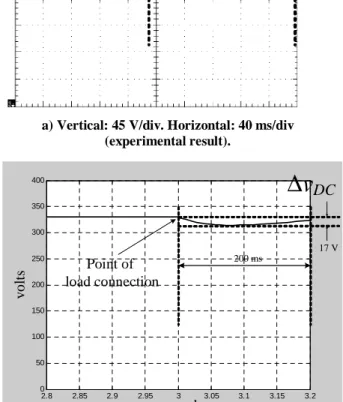
Figs. 10a and 10b represent a comparative dynamic response to experimentally verify the control algorithm presented in Fig. 9. Both tests take into account a 500 W single-phase resistive load step, imposed at the AC bus. As can be seen
∆
v
DC
205 ms 18 V
Point of
load connection
a) Vertical: 45 V/div. Horizontal: 40 ms/div (experimental result).
2.8 2.85 2.9 2.95 3 3.05 3.1 3.15 3.2 0
50 100 150 200 250 300 350
400
∆
v
DC
200 ms
Point of load connection
17 V
seconds
v
o
lt
s
b) Vertical: 50 V/div. Horizontal: 50 ms/div (simulation result).
Figure 10: DC link voltage under load step.
the system behaves as expected, according to the design pro-cedure. The simulated and measured time responses are very close (±200 ms each other) whereas the DC link voltage sag
reaches 17 V (simulation) and 18 V (experimental), respec-tively.
5
EXPERIMENTAL RESULTS
5.1
Steady-State Analysis
Fig. 11a presents two of the three-phase voltages produced by the inverter, after filtering. As desired, such voltages are balanced and the voltage displacement is around 120˚. As expected, also the IG currents are also sinusoidal.
As a first test, the system feeds a balanced resistive load. Fig. 11b shows one inverter phase voltage (vA) and the respective reference (v∗
A). The power that is not consumed by the load,
Prequal to 1800 W, is sent to the feeder. The inverter volt-age THD is only 0.9 %. The PF betweenVsourceandIsource is higher than 0.99. The local voltage THD is 2.2 % and the resulting current THD is 2.28 % respectively. Since the load voltage is sinusoidal, the feeder current will be distorted ac-cording to the voltage distortion and the coupling reactance.
As the feeder voltage is used to generate the internal refer-ences, the line voltage is filtered before the calculation of the inverter reference in order to avoid harmonic contamination.
Fig. 11c shows a situation in which the load power is higher than the IG power. The power deficit comes from the feeder. The feeder voltage leads the output inverter voltage, which results in the negativeβ angle. Also in this case the power factor is close to 1.
Fig. 11d shows the harmonic compensation provided by the inverter. The load is a 1200 W three-phase rectifier with ca-pacitive filter (capacitance equal to 1mF). In spite of the non-linear load, both the IG and the feeder current are almost si-nusoidal. The load and feeder current THD are, respectively 60 %, 6.8 %. The THD of the AC bus voltage is 3.2 % while the source voltage THD is 2.5 %.
5.2
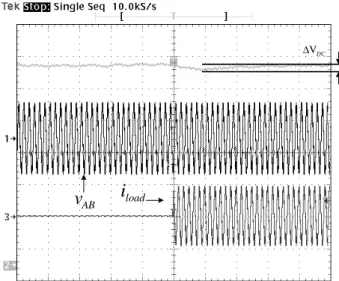
Dynamic Analysis
Fig. 12 shows the system response to a single-phase load transient. The load is connected between B and C phases. At the connection, a very small reduction in the AC voltage takes place, according to the AC voltage control strategy, be-cause it becomes necessary to absorb additional power from the feeder. Additionally, there is a DC link voltage sag, be-cause that capacitor instantaneously has to deliver the addi-tional power required by the load. As explained, the PI DC-link controller adjusts only theVAB phase, so as the three-phase voltage amplitude is not affected due to the method employed to design theLS.
6
CONCLUSIONS
This paper proposes a new strategy to compensate for the unbalanced operation of an induction generator connected to a single-phase feeder. A PWM inverter generates the
con-A
i
B
i
B
v
A
v
a) Voltages on the IG terminals (100 V/div) and respective currents (10 A/div) Horizontal: 5 ms/div.
*
A A
v
=
v
source
i
sourcev
b) Top traces: reference and load voltage (180 V/div). Bottom traces: single-phase feeder voltage (100 V/div) and current (10
A/div). Horizontal: 5 ms/div.
AB
v
source
v
source
i
−
β
-16o
d) From top to bottom: load current (10 A/div), single-phase feeder voltage (100 V/div), current (10 A/div), and AC bus
voltage (250 V/div). Horizontal: 10 ms/div.
Figure 11: Steady-state analysis.
DC
V
∆
load
i
AB
v
Figure 12: Top trace: DC voltage (50 V/div). Middle trace: AC bus voltage (250 V/div). Bottom trace: load current (2 A/div). Horizontal: 50 ms/div.
trolled sinusoidal voltages necessary to equalize the IG cur-rents and to control the single-phase feeder power flow.
By controlling the AC voltages phase and amplitude, it is possible to regulate the power flow through the single-phase feeder. If the locally generated power is higher than the load demand, the excess is delivered to the system. Otherwise, the power deficit is absorbed from the feeder. The system operation automatically compensates for load distortion, re-active power and unbalance, and guarantees low-distortion and unity displacement factor to the feeder current. The con-trol system is implemented in a DSP, using PI regulators for both the inner current and the outer voltage loop. Additional feed-forward signals are used to improve the system dynamic
response and power quality. The experimental results con-firm the expectations.
ACKNOWLEDGMENT
The authors would like to acknowledge CAPES and FAPESP (proc. BEX0277/02-9 and 00/11038-9) for supporting this project, and Mr. Marcio M. Kubo and Dr. Edson Adriano Vendrusculo for their technical assistance.
APPENDIX A
To design the passive components of the step-up converter, it is necessary to consider at least the maximum current rip-ple (∆I′
DC), the double frequency of the fundamental (fD), and DC bus voltage variation (18) (Machado et alii, 2006; McLandrich, 2003).
CDC = ∆I′
DC 8fD∆VDC
(18)
REFERENCES
Buso, S, S. Fasolo and P. Mattavelli, (Nov.-Dec. 2001): Un-interruptible power supply multiloop control employ-ing digital predictive voltage and current regulators,
IEEE Transactions on Industry Applications, 37, (6),
pp 1846 – 1854.
Chan, T. F. (1997). Effect of rotational direction on the performance of a three-phase induction generator con-nected to a single-phase power system. Proc. IEEE
IEMDC. pp. MB1-6.1 - MB1-6.3.
Durham, M. O. and R. Ramakuma (Nov. 1987). Power sys-tem balancers for an induction generator. IEEE
Transactions on Industry Applications, IA23, (6), pp. 1067
-1072.
Machado, R. Q., S. Buso and J. A Pomilio (Jun. 2005). Sistema de geração distribuída utilizando gerador de indução trifásico e fontes CC conectado a rede monofásica. Revista Eletrônica de Potências, 10, (1), pp. 51 – 58.
Machado, R. Q., S. Buso and J. A. Pomilio (Nov. 2006). A Line-interactive single-phase to three-phase system.
IEEE Transactions on Power Electronics, 21, (6), pp.
1628 – 1636.
Machado, R. Q; E. G. Marra and J. A. Pomilio (1999). Bal-anced operation of three-phase cage induction genera-tor directly connected to single-phase utility grid. Proc.
Marra, E. G. and J. A. Pomilio (Aug. 2000). Induction gener-ator based system providing regulated voltage with con-stant frequency, IEEE Transactions on Industrial
Elec-tronics, 47, (4), pp. 908 – 914.
Mattavelli, P. (Jan-Feb 2001). A closed-loop selective har-monic compensation for active filters. IEEE
Transac-tions on Industry ApplicaTransac-tions, 37, (1), pp. 81 – 89.
McLandrich, A. M. (2003). Sensorless Control of a bidi-rectional boost converter for a fuel cell energy man-agement system. Master thesis, Faculty of the Virginia Polytechnic Institute and State University.
Moncrief, W. A. (1996). Practical application and selec-tion of single-phase to three-phase converters. Proc.
IEEE/IAS Rural Electric Power Conference, pp.
D3-1/D3-9.
NE 08. CELPE (1978). Standard for power delivery using the single wire earth return system – Cia. de Eletricidade do Pernambuco. (in Portuguese)
RER 03 - Portaria no 47/DNAEE/78 (2001). Load studies for single wire earth return system. (in Portuguese)
Simões, M. G., and F. A. Farret (2004). Renewable energy systems: design and analysis with induction generators. CRC Press, ISBN: 0849320313.
Smith, O. J. M. (Sep. 1987). Three-phase induction genera-tor for single-phase line. IEEE Transactions on Energy
Conversion, 2.
Wang, L. and S. Jina-Yi (Dec. 1997). Effects of long-shunt and short-shunt connections on voltage variations of a self-excited induction generator. IEEE Transactions on
Energy Conversion, 12, (4), pp. 368 - 374.