A vibrational spectroscopic study of the arsenate minerals
cobaltkoritnigite and koritnigite
Ray L. Frost
a,⇑, Andrés López
a, Yunfei Xi
a, Cristiano Lana
b, Larissa Souza
c, Ricardo Scholz
b, Jirˇí Sejkora
d,
Jirˇí Cˇejka
a,daSchool of Chemistry, Physics and Mechanical Engineering, Science and Engineering Faculty, Queensland University of Technology, GPO Box 2434, Brisbane, Queensland 4001, Australia bGeology Department, School of Mines, Federal University of Ouro Preto, Campus Morro do Cruzeiro, Ouro Preto, MG 35400-00, Brazil
c
Mining Engineering Department, School of Mines, Federal University of Ouro Preto, Campus Morro do Cruzeiro, Ouro Preto, MG 35400-00, Brazil d
Department of Mineralogy and Petrology, National Museum, Cirkusová 1740, CZ-193 00, Praha 9, Czech Republic
h i g h l i g h t s
Raman and infrared spectra of
cobaltkoritnigite were obtained and interpreted.
A comparison is made with
koritnigite.
Some phosphate substitution is
observed.
Raman bands were attributed to the
(AsO3OH)2 stretching and bending vibrations.
g r a p h i c a l
a b s t r a c t
a r t i c l e
i n f o
Article history:
Received 27 November 2013
Received in revised form 19 January 2014 Accepted 22 January 2014
Available online 6 February 2014
Keywords:
Cobaltkoritnigite Koritnigite Hydrogen-arsenate Raman spectroscopy Molecular water Hydrogen bonds
a b s t r a c t
Raman spectra of two well-defined types of cobaltkoritnigite and koritnigite crystals were recorded and interpreted. Significant differences in the Raman spectra of cobaltkoritnigite and koritnigite were observed. Observed Raman bands were attributed to the (AsO3OH)2 stretching and bending vibrations, stretching and bending vibrations of water molecules and hydroxyl ions. Both Raman and infrared spec-tra of cobaltkoritnigite identify bands which are attributable to phosphate and hydrogen phosphate anions proving some substitution of phosphate for arsenate in the structure of cobaltkoritnigite. The OAH O hydrogen bond lengths in the crystal structure of koritnigite were inferred from the Raman spectra and compared with those derived from the X-ray single crystal refinement. The presence of (AsO 3-OH)2 units in the crystal structure of cobaltkoritnigite and koritnigite was proved from the Raman spec-tra which supports the conclusions of the X-ray structure analysis.
Ó2014 Elsevier B.V. All rights reserved.
Introduction
Cobaltkoritnigite is the Co member of the koritnigite group that also includes magnesiokoritnigite, the Mg member. Cobaltkoritnig-ite was first described from Schwarzenberg District, Saxony,
Ger-many[1]. The mineral crystallizes with triclinic symmetry, space groupP-1, unit cell paramethersa= 7.95 Å,b= 15.83 Å,c= 6.67 Å,
a
= 90.9°,b= 96.6°,c
= 90.0°. Despite the type locality, a number of occurrences are reported in the literature[2–4]. A recent study of the structure of the mineral koritnigite has been published[5]. In this work we make a comparison between the Raman spectra of cobaltkoritnigite and koritnigite and an assessment of their molecular structures.http://dx.doi.org/10.1016/j.saa.2014.01.106
1386-1425/Ó2014 Elsevier B.V. All rights reserved.
⇑ Corresponding author. Tel.: +61 7 3138 2407; fax: +61 7 3138 1804.
E-mail address:[email protected](R.L. Frost).
Contents lists available atScienceDirect
Spectrochimica Acta Part A: Molecular and
Biomolecular Spectroscopy
The Raman spectra of the tetrahedral anions in aqueous sys-tems are well known. The symmetric stretching vibration of the arsenate anion (
m
1) is observed at 810 cm 1 and coincides with the position of the asymmetric stretching mode (m
3) [6–8]. The symmetric bending mode (m
2) is observed at 342 cm 1 and the out-of-plane bending modes (m
4) is observed at 398 cm 1. Of all the tetrahedral oxyanions spectra, the positions of the arsenate vibrations occur at lower wavenumbers than any of the other nat-urally occurring mineral oxyanions spectra. Farmer lists a number of spectra of arsenates including the basic copper arsenates oliven-ite and euchrooliven-ite[9]. The effect of the arsenate ion in a crystal will be to remove the degeneracy and allow splitting of the bands according to factor group analysis. Them
1andm
3bands of olivenite and euchroite were observed at 860, 828, 790 cm 1and 830 and 770 cm 1 respectively. The bending modes were found at 493 and 452 cm 1for olivenite and at 475 and 410 cm 1for euchroite. Complex solution chemistry involving mixtures of the cations of lead, zinc, and ferric iron results in the formation of the koritnigite group of minerals, including cobaltkoritnigite. The type of mineral formed is a function of concentration, pH, temperature and the available anion present in the mother solution. The complex set of variable requires a multidimensional phase diagram[10]. Raman spectroscopy has proven an excellent technique for the study of oxyanions in both solution and in secondary mineral formation. In this work we extend our studies to the arsenates of the koritnig-ite mineral group. The aim of this paper is to report the Raman spectra of cobaltkoritnigite, and to relate the spectra to the molec-ular structure of this hydrogen-arsenate mineral. A comparison is made with the spectra of koritnigite. The paper follows the system-atic research of the large group of supergene minerals and espe-cially molecular structure of minerals containing oxyanions using IR and Raman spectroscopy.Experimental
Samples description and preparation
The cobaltkoritnigite sample studied in this work forms part of the collection of the Geology Department of the Federal University of Ouro Preto, Minas Gerais, Brazil, with sample code SAC-120. The sample is from Richelsdorf District, Hessen, Germany and occurs as spheric to radiating aggregates up to 1 mm. The studied sample of the mineral koritnigite was found in the Jáchymov ore district, the Krušné hory Mountains, Western Bohemia, Czech Republic and is characterized by strawberry pink to pale purple individual crystals formed radiating aggregates up to 1 mm across. Details of the chemical analysis of this mineral have been published[5].
The sample was gently crushed and the associated minerals were removed under a stereomicroscope Leica MZ4. Scanning elec-tron microscopy (SEM) in the EDS mode was applied to support the mineral characterization.
Scanning electron microscopy (SEM)
Experiments and analyses involving electron microscopy were performed in the Center of Microscopy of the Universidade Federal de Minas Gerais, Belo Horizonte, Minas Gerais, Brazil (http:// www.microscopia.ufmg.br). Cobaltkoritnigite crystals were ana-lysed with 5
l
m coating of carbon. Secondary Electron and Back-scattering Electron images were obtained using a JEOL JSM-6360LV equipment. Qualitative and semi-quantitative chemical analyses in the EDS mode were performed with a ThermoNORAN spectrometer model Quest and were applied to support the min-eral characterization.Raman microprobe spectroscopy
Crystals of cobaltkoritnigite or koritnigite were placed on a pol-ished metal surface on the stage of an Olympus BHSM microscope, which is equipped with 10, 20, and 50objectives. The micro-scope is part of a Renishaw 1000 Raman micromicro-scope system, which also includes a monochromator, a filter system and a CCD detector (1024 pixels). The Raman spectra were excited by a Spectra-Phys-ics model 127 HeANe laser producing highly polarised light at 633 nm and collected at a nominal resolution of 2 cm 1and a pre-cision of ±1 cm 1in the range between 200 and 4000 cm 1. Re-peated acquisitions on the crystals using the highest magnification (50) were accumulated to improve the signal to noise ratio of the spectra. Raman spectra were calibrated using the 520.5 cm 1line of a silicon wafer.
Infrared spectroscopy
Infrared spectra were obtained using a Nicolet Nexus 870 FTIR spectrometer with a smart endurance single bounce diamond ATR cell. Spectra over the 4000–525 cm 1 range were obtained by the co-addition of 128 scans with a resolution of 4 cm 1and a mirror velocity of 0.6329 cm/s. Spectra were co-added to improve the signal to noise ratio.
Spectral manipulation such as baseline correction/adjustment and smoothing were performed using the Spectracalc software package GRAMS (Galactic Industries Corporation, NH, USA). Band component analysis was undertaken using the Jandel ‘Peakfit’ soft-ware package that enabled the type of fitting function to be se-lected and allows specific parameters to be fixed or varied accordingly. Band fitting was done using a Lorentzian–Gaussian cross-product function with the minimum number of component bands used for the fitting process. The Gaussian–Lorentzian ratio was maintained at values greater than 0.7 and fitting was under-taken until reproducible results were obtained with squared corre-lations ofr2greater than 0.995.
Results and discussion
Chemical characterization
The BSI image of cobaltkoritnigite sample studied in this work is shown in Fig. S1. The image shows a 50
l
m aggregate of platy crys-tals. Fragments up to 2l
m of an unidentified Al sulphate occur in association. Qualitative and semi-quantitative chemical composi-tion shows a Co arsenate with minor amounts of Al. The chemical analysis is reported in Fig. S2.Vibrational spectroscopy background
The basis of the interpretation of the spectra of both Raman and infrared spectroscopy are given in detail in Ref.[5]and is in part repeated here. Farmer[9]presented and interpreted the mainly infrared spectra of many arsenate minerals (chapter 17). In this chapter discussion of the vibrational spectra of phosphates and arsenates is provided. The spectra of koritnigite and cobaltkoritnig-ite was not found. According to Myneni et al.[11,12]and Nakam-oto [13], (AsO4)3 is a tetrahedral unit, which exhibits four fundamental vibrations: the Raman active
m
1symmetric stretching vibration (A1) at 818 cm 1; the Raman active doubly degeneratem
on a mineral surface will cause the change in (AsO4)3 symmetry fromTdto lower symmetries, such as C3v, C2vor even C1. This loss
of degeneracy causes splitting of degenerate vibrations of AsO3 4 and the shifting of the AsAOH stretching vibrations to different wavenumbers. Such information is not given in Farmer’s treatise [9]. These fundamentals of the spectra of the arsenate anion are used to interpret the Raman and infrared spectra of cobaltkoritnigite.
Such chemical interactions reduce AsO3
4 tetrahedral symmetry, as mentioned above, to either C3v/C3 (corner-sharing), C2v/C2 (edge-sharing, bidentate binuclear), or C1/Cs (corner-sharing, edge-sharing, bidentate binuclear, multidentate)[11,12]. In associ-ation with AsO3
4 symmetry and coordination changes, theA1band may shift to different wavenumbers and the doubly degenerateE and triply degenerateFmodes may give rise to several newA1, B1, and/orEvibrations[11,12]. In the absence of symmetry devia-tions, AsO3OH2 in C3vsymmetry exhibit the
m
sAsAOH and
m
asandm
sAsO3OH2 vibrations together with corresponding thedAsAOH in-plane bending vibration,dAsAOH out-of-plane bending vibra-tion,m
sAsO3OH2 stretching vibration anddas(AsO3OH)2 bending vibration [14–16]. Keller [14] assigned observed the following infrared bands in Na2(AsO3OH)7H2O 450 and 360 cm 1to thedas (m
4) (AsO3OH)2 bend (E), 580 cm 1to thedAsAOH out-of-plane bend, 715 cm 1to the
m
AsAOH stretch (A1), 830 cm 1to the
m
as AsO3OH2 stretch (E), and 1165 cm 1 to thed AsAOH in plane bend. In the Raman spectrum of Na2(AsO3OH)7H2O, Vansant and Veken [15] attributed observed Raman bands to the following vibrations 55, 94, 116 and 155 cm 1 to lattice modes, 210 cm 1 to
m
(OH O) stretch, 315 cm 1to (AsO3OH)2 rocking, 338 cm 1 to the ds (AsO3)2 bend, 381 cm 1 to the das (AsO3OH)2 bend, 737 cm 1to them
sAsAOH stretch (A1), 866 cm 1to the
m
as (AsO3-OH)2 stretch (E). The elucidation of these bands is of importance for the study of the arsenate containing minerals and especially those minerals containing hydrogen arsenate anions.Vibrational spectroscopy
The Raman spectrum of cobaltkoritnigite and koritnigite in the 100–4000 cm 1 spectral range are illustrated in Fig. 1a and b. These spectra show the position of the Raman bands and their rel-ative intensities. It is obvious that there are large parts of the spec-trum where little or no intensity is observed. Therefore, the spectrum is subdivided into sections according to the type of vibra-tion being investigated. In this way, the precise posivibra-tion of the bands can be detailed. The infrared spectrum of cobaltkoritnigite in the 500–4000 cm 1spectral range is shown inFig. 1c. The reflec-tance spectrum starts at 500 cm 1because the ATR cell absorbs all infrared radiation below this wavenumber. As for the Raman spec-trum, the infrared spectrum is subdivided into sections depending upon the type of vibration being examined. The complete infrared spectrum displays the position of the infrared bands and their rel-ative intensity.
The Raman spectrum of cobaltkoritnigite in the 800–1100 cm 1 spectral range is displayed inFig. 2a. This spectrum is the region where the stretching vibrations of the oxyanions in this case the arsenate and hydroxyarsenate anions are observed. The Raman spectrum of koritnigite in the 800–1100 cm 1spectral range is dis-played in Fig. 4b. This spectrum appears cleaner that for the cobaltkoritnigite.
In the range from 700 to 900 cm 1, a set of Raman bands for cobaltkoritnigite was observed (Fig. 2a) at 812, 828 and 838 cm 1and may be compared with the data downloaded from the RRUFF data base for koritnigite. RRUFF is the name of the data base for the Raman spectra of minerals held at the Arizona State University. No interpretation of the Raman data is given. However, useful comparisons may be made with the data for the RRUFF data
base and the spectra recorded in this work. The Raman spectrum of koritnigite (Fig. 2b) displays bands at 813, 839, 879 and 895 cm 1. Raman bands from the RRUFF data base are observed at 766, 812, 841, 877 and 891 cm 1[RRUFF] and infrared bands at 845, 815 and 760 cm 1. Respecting intensities of observed bands, the bands close to 813 cm 1are attributed to the
m
1(AsO3OH)2 symmetric stretching vibrations, while the bands in the range from 895 to 740 cm 1are assigned to the split degenerate
m
3(AsO3OH)2 anti-symmetric stretching vibrations. The intensity of these bands are very low for the cobaltkoritnigite. Raman bands close to 766 cm 1are connected with the
m
AsAOH stretching vibrations. In the Raman spectrum of cobaltkoritnigite, a series of Raman bands are observed at 973, 985, 1001 and 1013 cm 1. It is sug-gested that these bands are due to phosphate and hydrogen phos-phate stretching vibrations. Thus, it would appear that some
Fig. 1.(a) Raman spectrum of cobaltkoritnigite (upper spectrum) over the 100– 4000 cm 1spectral range, (b) Raman spectrum of koritnigite (middle spectrum)
over the 100–4000 cm 1spectral range and (c) infrared spectrum of
substitution of phosphate for arsenate in the structure of cobaltk-oritnigite has occurred. The Raman bands at 1050, 1058 and 1071 cm 1are ascribed to the
m
3antisymmetric stretching bands of the phosphate and hydrogen phosphate units.
The infrared spectrum of cobaltkoritnigite in the 650– 1200 cm 1 spectral range is shown in Fig. 2c. Intense infrared bands are observed at 792 and 892 cm 1. The infrared band at 892 cm 1is assigned to the attributed to the
m
1(AsO3OH)2 sym-metric stretching vibration; the band at 792 cm 1and associated shoulder bands are assigned to the split degenerate
m
3(AsO3OH)2 antisymmetric stretching vibrations. The infrared bands at 935 and 985 cm 1are attributed to them
1(PO3OH)2 and
m
1(PO4)3 sym-metric stretching vibrations. The broad infrared bands at 1052 and 1118 cm 1are attributed to them
3(PO3OH)2 and
m
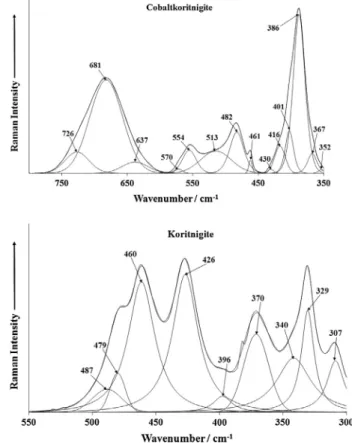
3(PO4)3 antisymmetric stretching vibrations. Clearly, infrared spectroscopy indicates that some substitution of phosphate for arsenate has oc-curred in the cobaltkoritnigite structure; thus confirming the inter-pretation of the preceding Raman spectra.The Raman spectrum of cobaltkoritnigite over the 350– 800 cm 1spectral range is reported inFig. 3a. The Raman spectrum
Fig. 2.(a) Raman spectrum of cobaltkoritnigite (upper spectrum) in the 800– 1100 cm1spectral range, (b) Raman spectrum of koritnigite (middle spectrum) in
the 600–1100 cm 1spectral range and (c) infrared spectrum of cobaltkoritnigite
(lower spectrum) in the 650–1200 cm 1spectral range.
Fig. 3.(a) Raman spectrum of cobaltkoritnigite (upper spectrum) in the 350– 800 cm1spectral range and (b) Raman spectrum of koritnigite (lower spectrum) in
the 300–550 cm1spectral range.
Fig. 4.(a) Raman spectrum of cobaltkoritnigite (upper spectrum) in the 100– 350 cm1spectral range and (b) Raman spectrum of koritnigite (lower spectrum) in
of koritnigite over the 300–550 cm 1spectral range is reported in Fig. 3b. The Raman bands for cobaltkoritnigite 386, 401, 416, 430, 461 and 482 cm 1 are attributed to the
m
4 (AsO3OH)2 bending vibrations. Raman bands for koritnigite at 396, 426, 460 and 479 cm 1 and 394, 424 and 456 cm 1 (RRUFF) are attributed to the split degenerate
m
4(AsO3OH)2 bending vibrations and those at 372 and 330 cm 1 and 370 and 327 cm 1 (RRUFF) to them
2 (AsO3OH)2 bending vibrations. Keller et al.[17,18]assigned infra-red bands at 388 and 378 cm 1and 350 and 320 cm 1to these vibrations, respectively. Raman bands at lower wavenumbers such as the band at 300 cm 1for cobaltkoritnigite may be described as the lattice vibrations (Fig. 4a and b).
The Raman spectrum of cobaltkoritnigite over the 2800– 3800 cm 1spectral range is reported inFig. 5a. The Raman spec-trum of koritnigite over the 2600–3800 cm 1spectral range is re-ported in Fig. 5b. Two broad Raman bands for cobaltkoritnigite
are observed at 3165 and 3438 cm 1with two additional bands at 2862 and 2922 cm 1. The first two bands are assigned to water stretching vibrations. The latter two bands are attributed to very strongly hydrogen bonded OH vibrations. Raman bands for korit-nigite at 2784, 3005, 3182 and 3474 cm 1 are assigned to the
m
OH stretching vibrations of hydrogen bonded water molecules, while those at 2434 and 2285 cm 1to them
OH stretching vibra-tions of strongly hydrogen bonded (OH) ions in the (AsO3OH)2 units. According to Keller et al.[17,18], infrared bands in the spec-trum of cobaltkoritnigite were observed at 3480, 3200, 2770, 2420 and 2280 cm 1and are close to the Raman spectra studied in this work. The infrared spectrum of cobaltkoritnigite over the 2500– 3800 cm 1 spectral range is provided in Fig. 5c. Broad infrared bands are observed at 2679, 2885, 3144, 3388 3525, 3388 and 3525 cm 1. According to Libowitzky, the OAH O hydrogen bond lengths may vary in the range approximately from 2.80 to 2.73 Å. Such hydrogen bond distances are a function of the hydrogen bond strength. The OAH O hydrogen bond lengths inferred from the
Fig. 5.(a) Raman spectrum of cobaltkoritnigite (upper spectrum) in the 2800– 3800 cm1spectral range, (b) Raman spectrum of koritnigite (middle spectrum) in
the 2800–3800 cm1spectral range and (c) infrared spectrum of cobaltkoritnigite
(lower spectrum) in the 2500–4000 cm1spectral range.
Fig. 6.(a) Raman spectrum of cobaltkoritnigite (upper spectrum) in the 2800– 3800 cm 1spectral range, (b) Raman spectrum of koritnigite (middle spectrum) in
the 2800–3800 cm1spectral range and (c) infrared spectrum of cobaltkoritnigite
Raman and infrared spectra of cobaltkoritnigite are located in the range 2.87–2.55 Å and are comparable with those from the X-ray crystal structure 2.93–2.51 Å[17,18].
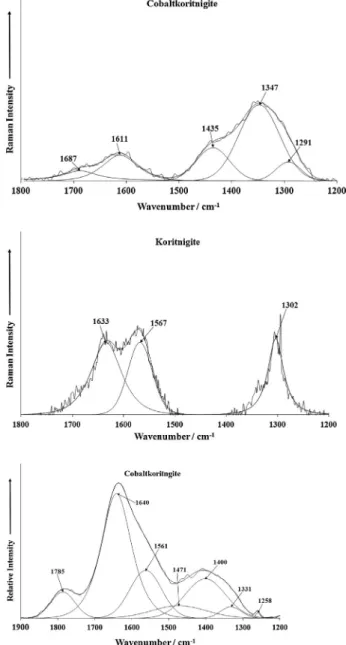
The Raman spectrum of cobaltkoritnigite over the 1200– 1800 cm 1spectral range is reported inFig. 6a. Raman bands are identified at 1291, 1347, 1435, 1611 and 1687 cm 1. The latter two bands are assigned to the water bending modes of very strongly bonded water and weakly hydrogen bonded water, respectively. The Raman spectrum of koritnigite over the 1200– 1800 cm 1spectral range is reported inFig. 6b. Raman bands are observed at 1302, 1567 and 1633 cm 1. This latter band is ascribed to a water bending mode. The infrared spectrum of cobaltkoritnig-ite over the 1200–1800 cm 1spectral range is reported inFig. 6c. Raman bands at 1567 cm 1 are connected with the
m
2 (d) H2O bending vibrations. The Raman band at 1302 cm 1may be proba-bly related to a combination band or overtone. Keller et al.[17,18] attributed infrared bands at 1645 and 1560 cm 1to these vibra-tions. Raman bands at 1303 cm 1 are assigned to the d As
AOH bending vibrations, close to 1300 cm 1 observed in the infrared spectrum by Keller et al.[17].
Conclusions
Raman spectra of two well-defined types of cobaltkoritnigite and koritnigite crystals from Richelsdorf District, Hessen, Germany and Jáchymov ore district, the Krušné Hory Mountains, Western Bohemia, Czech Republic were analysed and related to the struc-ture of the minerals. Substantial differences were observed be-tween the Raman spectra of cobaltkoritnigite and koritnigite. A comparison is made between the Raman spectra of the two miner-als. It is noted that cobaltkoritnigite is not as ‘clean’ as the mineral Czech koritnigite.
The Raman spectra of cobaltkoritnigite and koritnigite are com-pared, Structural interpretation based upon the Raman spectra is given. Observed Raman bands were attributed to the (AsO3OH)2 stretching and bending vibrations, stretching and bending vibra-tions of water molecules and hydroxyl ions. The OAH O hydro-gen bond lengths in the crystal structure of cobaltkoritnigite and koritnigite were inferred from the Raman and infrared spectra and compared with those derived from the X-ray single crystal refinement. The presence of (AsO3OH)2 units in the crystal struc-ture of cobaltkoritnigite was proved from the Raman spectra which supports the conclusions of the X-ray structure analysis. Both the Raman and infrared spectra of cobaltkoritnigite identify bands which are assigned to phosphate and hydrogen phosphate bands,
supporting the concept that some substitution of phosphate for arsenate in the structure of cobaltkoritnigite occurs.
Acknowledgements
The financial and infra-structure support of the Discipline of Nanotechnology and Molecular Science, Science and Engineering Faculty of the Queensland University of Technology, is gratefully acknowledged. The Australian Research Council (ARC) is thanked for funding the instrumentation. The authors would like to acknowledge the Center of Microscopy at the Universidade Federal de Minas Gerais (http://www.microscopia.ufmg.br) for providing the equipment and technical support for experiments involving electron microscopy. R. Scholz thanks to CNPq – Conselho Nacional de Desenvolvimento Científico e Tecnológico (Grant No. 306287/ 2012-9). L. Souza thanks to PIBIC/CNPq/UFOP and C. Lana thanks to CNPq 402852/2012-5.
Appendix A. Supplementary material
Supplementary data associated with this article can be found, in the online version, athttp://dx.doi.org/10.1016/j.saa.2014.01.106.
References
[1]K.W. Schmetzer, O. Horn, Neues Jb. Miner. Mh. (1981) 257–266.
[2]U. Kolitsch, J. Gröbner, G. Blaß, H.-W. Graf, A. Pring, Lapis 30 (2005) 35–39. [3]G. Favreau, J.E. Dietrich, Die Mineralien von Bou Azzer, Lapis 31 (2006) 27–68. [4]G. Favreau, J.E. Dietrich, N. Meisser, J. Brugger, L.A. Haddouch, L. Maacha, Min.
Rec. 38 (2007) 345–407.
[5]R.L. Frost, J. Sejkora, J. Cejka, J. Plasil, S. Bahfenne, E.C. Keeffe, J. Raman Spectrosc. 42 (2011) 534–539.
[6]W. Martens, R.L. Frost, J.T. Kloprogge, J. Raman Spectrosc. 34 (2003) 90–95. [7]W. Martens, R.L. Frost, P.A. Williams, J. Raman Spectrosc. 34 (2003) 104–111. [8]W.N. Martens, R.L. Frost, J.T. Kloprogge, P.A. Williams, Amer. Min. 88 (2003)
501–508.
[9] V.C. Farmer, Mineralogical Society Monograph 4: The Infrared Spectra of Minerals, 1974.
[10]P.A. Williams, Oxide Zone Geochemistry, Ellis Horwood Ltd., Chichester, West Sussex, England, 1990.
[11]S.C.B. Myneni, S.J. Traina, G.A. Waychunas, T.J. Logan, Geochim. Cosmochim. Acta 62 (1998) 3285–3300.
[12]S.C.B. Myneni, S.J. Traina, G.A. Waychunas, T.J. Logan, Geochim. Cosmochim. Acta 62 (1998) 3499–3514.
[13]K. Nakamoto, Infrared and Raman Spectra of Inorganic and Coordination Compounds, Wiley, New York, 1986.
[14]P. Keller, Neues Jb. Miner. Mh. (1971) 491–510.
[15]F.K. Vansant, B.J.V.D. Veken, J. Mol. Struct. 15 (1973) 439–444. [16]F.K. Vansant, B.J.V.D. Veken, H.O. Desseyn, J. Mol. Struct. (1973) 425–437. [17]P. Keller, H. Hess, H. Riffel, Neues Jb. Miner. Mh. 138 (1980) 316–332. [18]P. Keller, H. Hess, P. Suesse, G. Schnorrer, P.J. Dunn, Tsch. Min. Petr. Mitt. 26