A vibrational spectroscopic study of the phosphate mineral lulzacite
Sr
2
Fe
2+
(Fe
2+
,Mg)
2
Al
4
(PO
4
)
4
(OH)
10
Ray L. Frost
a,⇑, Andrés López
a, Fernanda M. Belotti
b, Yunfei Xi
a, Ricardo Scholz
c aSchool of Chemistry, Physics and Mechanical Engineering, Science and Engineering Faculty, Queensland University of Technology, GPO Box 2434, Brisbane, Queensland 4001, Australia
b
Federal University of Itajubá, Campus Itabira, Itabira, MG, Brazil
c
Geology Department, School of Mines, Federal University of Ouro Preto, Campus Morro do Cruzeiro, Ouro Preto, MG 35400-00, Brazil
h i g h l i g h t s
We have studied the mineral lulzacite from Saint-Aubin des Chateaux mine, France.
Using a combination of electron microscopy with EDX and vibrational spectroscopic techniques.
Chemical analysis shows a Sr, Fe, Al phosphate with minor amounts of Ga, Ba and Mg.
Vibrational spectroscopy offers insights into the molecular structure of the phosphate mineral lulzacite.
g r a p h i c a l
a b s t r a c t
a r t i c l e
i n f o
Article history: Received 6 January 2014
Received in revised form 29 January 2014 Accepted 9 February 2014
Available online 24 February 2014
Keywords: Lulzacite Strontium Phosphate Raman spectroscopy
a b s t r a c t
The mineral lulzacite from Saint-Aubin des Chateaux mine, France, with theoretical formula Sr2Fe2+(Fe2+,Mg)2Al4(PO4)4(OH)10has been studied using a combination of electron microscopy with
EDX and vibrational spectroscopic techniques. Chemical analysis shows a Sr, Fe, Al phosphate with minor amounts of Ga, Ba and Mg. Raman spectroscopy identifies an intense band at 990 cm 1with an additional
band at 1011 cm 1. These bands are attributed to the PO3
4 m1symmetric stretching mode. Them3
anti-symmetric stretching modes are observed by a large number of Raman bands. The Raman bands at 1034, 1051, 1058, 1069 and 1084 together with the Raman bands at 1098, 1116, 1133, 1155 and 1174 cm 1are assigned to them
3antisymmetric stretching vibrations of PO34 and the HOPO23 units. The observation of these multiple Raman bands in the symmetric and antisymmetric stretching region gives credence to the concept that both phosphate and hydrogen phosphate units exist in the structure of lulzacite. The series of Raman bands at 567, 582, 601, 644, 661, 673 and 687 cm1are assigned to the
PO3
4 m2bending modes. The series of Raman bands at 437, 468, 478, 491, 503 cm 1are attributed to the
PO3
4 and HOPO23 m4bending modes.
No Raman bands of lulzacite which could be attributed to the hydroxyl stretching unit were observed. Infrared bands at 3511 and 3359 cm 1are ascribed to the OH stretching vibration of the OH units. Very
broad bands at 3022 and 3299 cm1are attributed to the OH stretching vibrations of water. Vibrational
spectroscopy offers insights into the molecular structure of the phosphate mineral lulzacite.
Ó2014 Elsevier B.V. All rights reserved.
http://dx.doi.org/10.1016/j.saa.2014.02.041 1386-1425/Ó2014 Elsevier B.V. All rights reserved.
⇑ Corresponding author. Tel.: +61 7 3138 2407; fax: +61 7 3138 1804. E-mail address:[email protected](R.L. Frost).
Contents lists available atScienceDirect
Spectrochimica Acta Part A: Molecular and
Biomolecular Spectroscopy
Introduction
The mineral lulzacite is a rare strontium containing phosphate mineral of general chemical formula Sr2Fe2+(Fe2+,Mg)2Al4(PO4)4
(OH)10. The mineral was first described in 2000 from quartzite
deposits at Saint-Aubin-des-Chateaux, Loire-Atlantique, France [1]. The mineral occurs with quartz and siderite. Other minerals found with lulzacite include apatite, goyazite and pyrite[2]. Lulza-cite is triclinic withP1 space group, and unit cell parameters are: a= 5.457(1) Å, b= 9.131(2) Å, c= 9.769(2) Å,
a
= 108.47(3)°,b= 91.72(3)° and
c
= 97.44(3)° [2]. The mineral is isostructuralwith jamesite (Pb2Zn(Fe2+,Zn)2Fe3+4(AsO4)4(OH)10)[3,4].
Raman spectroscopy has proven most useful for the study of mineral structure. Raman spectroscopy is an important tool in the characterization of phosphates in complex paragenesis[5–8]. In recent years, spectroscopic studies concerning phosphate miner-als are increasing, especially due to their industrial and technolog-ical importance [8–11]. The aim of this paper is to report the Raman spectra of lulzacite, and to relate the spectra to the molec-ular structure of this hydrogen-phosphate mineral. The paper fol-lows the systematic research of the large group of secondary minerals and especially molecular structure of minerals containing oxyanions using IR and Raman spectroscopy.
Experimental
Samples description and preparation
The lulzacite sample studied in this work forms part of the collection of the Geology Department of the Federal University of Ouro Preto, Minas Gerais, Brazil, with sample code SAC-106. The studied sample is from Saint-Aubin-des-Châteaux, located 8 km west of Châteaubriant (Loire-Atlantique, France). Quartzite forms a sequence of decimetric beds within Armorican sandstones. In the lower southwest part of the quarry, appears a micro-crystalline limestone level about 1 m thick, enriched in pyrite and organic matter. Veinlets filled mainly by quartz, siderite and recrystallised pyrite, with traces of sphalerite and galena, occur at the contact be-tween quartzite and pyrite-rich limestone. Within these veinlets, phosphates are irregularly distributed and forms a complex paragenesis including lulzacite, goyazite, apatite and sulphides (pyrrhotite, pyrite, bournonite, boulangerite, sphalerite, galena and chalcopyrite)[2].
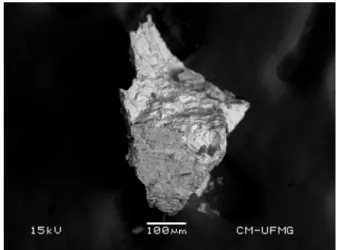
The sample was gently crushed and the associated minerals were removed under a stereomicroscope Leica MZ4. The lulzacite studied in this work occurs in association with siderite. Scanning electron microscopy (SEM) in the EDS mode was applied to support the mineral characterization.
Scanning electron microscopy (SEM)
Experiments and analyses involving electron microscopy were performed in the Center of Microscopy of the Universidade Federal de Minas Gerais, Belo Horizonte, Minas Gerais, Brazil (http:// www.microscopia.ufmg.br). Lulzacite massive fragment up to 0.5 mm was coated with a 5 nm layer of evaporated Au. Secondary Electron and Backscattering Electron images were obtained using a JEOL JSM-6360LV equipment. A qualitative and semi-quantitative chemical analysis in the EDS mode was performed with a Ther-moNORAN spectrometer model Quest and was applied to support the mineral characterization.
Raman microprobe spectroscopy
Crystals of lulzacite were placed on a polished metal surface on the stage of an Olympus BHSM microscope, which is equipped with
10, 20, and 50 objectives. The microscope is part of a
Reni-shaw 1000 Raman microscope system, which also includes a monochromator, a filter system and a CCD detector (1024 pixels). The Raman spectra were excited by a Spectra-Physics model 127 He–Ne laser producing highly polarized light at 633 nm and col-lected at a nominal resolution of 2 cm 1 and a precision of
±1 cm 1in the range between 200 and 4000 cm 1. Repeated
acqui-sitions on the crystals using the highest magnification (50) were
accumulated to improve the signal to noise ratio of the spectra. Ra-man Spectra were calibrated using the 520.5 cm 1line of a silicon
wafer. The Raman spectrum of at least 10 crystals was collected to ensure the consistency of the spectra.
An image of the lulzacite crystals measured is shown in the supplementary information as Fig. S1. Clearly the crystals of lulzacite are readily observed, making the Raman spectroscopic measurements readily obtainable.
Infrared spectroscopy
Infrared spectra were obtained using a Nicolet Nexus 870 FTIR spectrometer with a smart endurance single bounce diamond ATR cell. Spectra over the 4000–525 cm 1 range were obtained
by the co-addition of 128 scans with a resolution of 4 cm 1and a
mirror velocity of 0.6329 cm/s. Spectra were co-added to improve the signal to noise ratio.
Spectral manipulation such as baseline correction/adjustment and smoothing were performed using the Spectracalc software package GRAMS (Galactic Industries Corporation, NH, USA). Band component analysis was undertaken using the Jandel ‘Peakfit’ software package that enabled the type of fitting function to be selected and allows specific parameters to be fixed or varied accordingly. Band fitting was done using a Lorentzian–Gaussian cross-product function with the minimum number of component bands used for the fitting process. The Gaussian–Lorentzian ratio was maintained at values greater than 0.7 and fitting was under-taken until reproducible results were obtained with squared correlations ofr2greater than 0.995.
Results and discussion
Chemical characterization
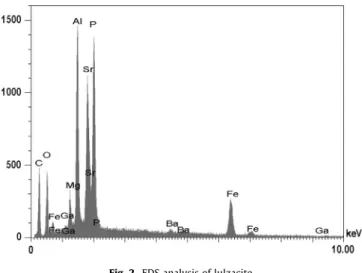
The BSE image of lulzacite sample studied in this work is shown inFig. 1. Qualitative and semi-quantitative chemical composition shows a Sr, Fe, Al phosphate with minor amounts of Ga, Ba and
Mg. Carbon was observed due to effect of conductive tape and metallization (seeFig. 2).
The chemical analysis by EMP shows chemical formula expressed by Fe2+Fe
53+(PO4)4(OH)5 4H2O that indicate
predomi-nance of lulzacite member in a triple series between lulzacite, Zn-lulzacite and Al-lulzacite. Minor amount of Al was also found.
Vibrational spectroscopy
Background
In aqueous systems, the Raman spectra of phosphate oxyanions show a symmetric stretching mode (
m
1) at 938 cm 1,an antisymmetric stretching mode (
m
3) at 1017 cm 1, a symmetricbending mode (
m
2) at 420 cm 1 and am
4 bending mode at567 cm 1. S.D. Ross in Farmer (page 404) listed some well-known
minerals containing phosphate, which were either hydrated or hydroxylated or both[9]. The vibrational spectrum of the dihydro-gen phosphate anion has been reported in Farmer. The PO2
sym-metric stretching mode occurs at 1072 cm 1 and the POH
symmetric stretching mode at878 cm 1. The position of the PO
stretching vibration for calcium dihydrogen phosphate is found at 915 cm 1. The POH antisymmetric stretching mode is at
947 cm 1 and the P(OH)
2 bending mode at 380 cm 1. The band
at 1150 cm 1 is assigned to the PO
2 antisymmetric stretching
mode. The position of these bands will shift according to the crystal structure of archerite.
Raman and infrared spectroscopy
The Raman spectrum of lulzacite over the 100–4000 cm 1
spec-tral range is displayed inFig. 3a. This figure shows the position and relative intensities of the Raman bands. It may be observed that there are large parts of the spectrum where no Raman intensity is observed. Thus, the spectrum is subdivided into sections depending upon the type of vibration being examined. It is noted that significant intensity exists in the OH stretching region in the 2800–4000 cm 1spectral range, reflecting the number of hydroxyl
units in the lulzacite structure. The infrared spectrum of lulzacite over the 500–4000 cm 1spectral range is shown in Fig. 3b. This
figure displays the position and relative intensity of the infrared bands. As for the Raman spectrum, the infrared spectrum is subdi-vided into sections based upon the type of vibration being studied. Fig. 2.EDS analysis of lulzacite.
Fig. 3.(a) Raman spectrum of lulzacite (upper spectrum) in the 100–1500 cm1
spectral range and (b) infrared spectrum of lulzacite (lower spectrum) in the 500– 4000 cm1spectral range.
Fig. 4.(a) Raman spectrum of lulzacite (upper spectrum) in the 900–1200 cm 1
The Raman spectrum of lulzacite over the 900–1200 cm 1
spectral range is reported inFig. 4a. The spectrum is dominated by an intense Raman band at 990 cm 1which is attributed to the
PO3
4
m
1symmetric stretching vibrations. Two shoulder bands arefound at 968 and 983 cm 1. One possibility is that the proton of
the hydroxyl unit is mobile and on a picoseconds time scale can transfer to the phosphate units, thus generating a HOPO2
3 unit. A
Raman band observed at 968 cm 1is attributed to the PO
symmet-ric stretching vibration of these HOPO2
3 units. A series of Raman
bands of low intensity are noted at 1035, 1045, 1069, 1082, 1106 and 1128 cm 1. These bands are assigned to the
m
3antisymmetric
stretching vibrations of PO3
4 and the HOPO23 units.
The infrared spectrum of lulzacite over the 650–1200 cm 1
spectral range is shown inFig. 4b. This spectrum is complex and consists of a series of overlapping bands which may be curve resolved into component bands. The infrared bands at 972, 989 and 1007 cm 1 may be assigned to the
m
1 symmetric stretching
vibrations of PO3
4 and the HOPO23 units. The infrared bands at
1070, 1095, 1122 and 1153 cm 1are assigned to the
m
3
antisym-metric stretching vibrations of PO3
4 and the HOPO23 units.
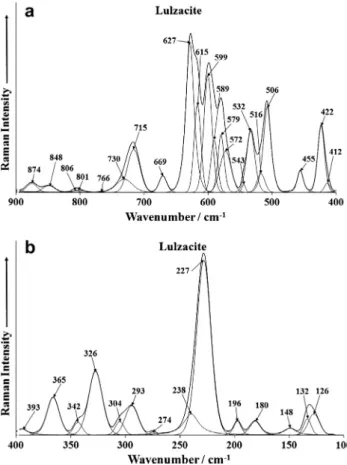
The Raman spectrum of lulzacite over the 400–900 cm 1
spectral range is given inFig. 5a. This figure shows the bands which are due to the bending modes of PO3
4 and the HOPO23 units. The
Raman bands at 412, 422 and 455 cm 1are assigned to the PO3 4
and HOPO2
3
m
4 bending modes. The series of Raman bands at506, 532, 579, 599, 615 and 627 cm 1are attributed to the PO3 4
and HOPO2
3
m
2bending modes.A comparison may be based on that with other phosphate containing minerals, which also contain hydroxyl groups. For pseudomalachite Cu5(PO4)2(OH)4, Raman bands are observed at
482 and 452 cm 1of about equal intensity. The two
m
2bands for
pseudomalachite were reported by Ross [12] at 450 and 422 cm 1. Cornetite Cu
3(PO4)(OH)3, Raman spectra shows an
in-tense band at 433 cm 1 with minor components at 463 and
411 cm 1. Ross [9]reported two bands at 464 and 411 cm 1for
cornetite. The variation between the spectral results may be attrib-uted to orientation effects and the intensity of different bands will depend on which crystal face is scattering the Raman signal. The Raman spectrum of libethenite Cu2(PO4)(OH) showed a single band
for
m
2at 450 cm 1. A number of bands in the 480–680 cm 1regionof mineral phosphates were reported by Ross [12] for selected phosphates. Ross attributed these bands to the
m
4modes. Weob-serve similar number of bands for the churchite-(Y) minerals. The Raman spectrum of pseudomalachite exhibits bands at 481, 517, 537 and 609 cm 1. The
m
4modes for cornetite were observed
at 487, 518, 541 and 570 cm 1. Bands were observed for
libethe-nite at 556, 582, 626 and 645 cm 1. These band positions are in
good agreement with the values reported by Ross in Farmer’s trea-tise[12]. The Raman spectrum of the far low wavenumber region of lulzacite is shown inFig. 5b. A strong Raman band is noted at 227 cm 1which together with other bands in this spectral region
are described as lattice vibrations. The Raman bands at 293, 326, 342, 365 and 393 are likely to be associated with metal oxygen stretching vibrations.
The Raman spectrum of lulzacite over the 3000–3700 cm 1
spectral range is reported inFig. 6a. Two overlapping Raman bands at 3419 and 3447 cm 1 together with the sharp intense Raman
band at 3590 cm 1 are assigned to the stretching vibrations of
the OH units. The reason for the wide variation of the band position of the hydroxyl units is due to the variation in hydrogen bond strength of these hydroxyl units. The hydroxyl units are non-equiv-alent. Other low intensity shoulders are observed at 3345, 3554,
Fig. 5.(a) Raman spectrum of lulzacite (upper spectrum) in the 900–300 cm1
spectral range and (b) Raman spectrum of lulzacite (lower spectrum) in the 300– 100 cm 1spectral range.
Fig. 6.Raman spectrum of lulzacite (upper spectrum) in the 3000–3700 cm1
3605 and 3619 cm 1. The low intensity Raman bands at 3105 and
3217 cm 1 maybe due to the stretching vibrations of water. The
infrared spectrum of lulzacite over the 2500–3800 cm 1 spectral
range is shown in Fig. 6b. The intense infrared bands at 3420, 3596 and 3614 cm 1 are assigned to the stretching vibration of
OH units. The broader bands at 3070 and 3209 cm 1are attributed
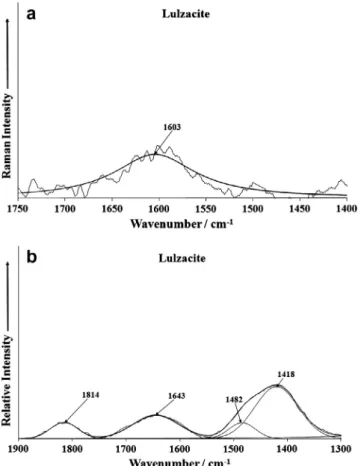
to water stretching vibrations. The Raman spectrum of lulzacite over the 1400–1750 cm 1is shown inFig. 7a. This spectrum suffers
from a lack of signal. It is difficult to make a statement about Ra-man bands being present. The infrared spectrum of lulzacite over the 1300–1900 cm 1spectral range is reported inFig. 7b. An
infra-red band is found at 1643 cm 1which is ascribed to the bending
vibration of strongly bonded water.
Conclusions
A lulzacite sample was studied by Electron Microscope in the EDS mode, Raman and infrared spectroscopy. The chemical analy-sis by EMP combined shows chemical formula expressed by Fe
2+-Fe53+(PO4)4(OH)5 4H2O that indicate predominance of lulzacite
member in a triple series between lulzacite, Zn-lulzacite and Al-lulzacite. Minor amount of Al was also found.
Raman spectroscopy identifies an intense band at 990 cm 1and
1011 cm 1. These bands are attributed to the PO3
4
m
1symmetricstretching mode. The
m
3antisymmetric stretching modes areob-served by a large number of Raman bands. The Raman bands at
1034, 1051, 1058, 1069 and 1084 together with the Raman bands at 1098, 1116, 1133, 1155 and 1174 cm 1are assigned to the
m
3
antisymmetric stretching vibrations of PO3
4 and the HOPO23 units.
The observation of these multiple Raman bands in the symmetric and antisymmetric stretching region gives credence to the concept that both phosphate and hydrogen phosphate units exist in the structure of lulzacite. At least on the picoseconds time scale, the hydrogen phosphate units exist and may be identified by vibra-tional spectroscopy. The infrared spectrum shows complexity with many overlapping bands. The series of Raman bands at 567, 582, 601, 644, 661, 673 and 687 cm 1are assigned to the PO3
4
m
2bend-ing modes. The series of Raman bands at 437, 468, 478, 491, 503 cm 1 are attributed to the PO3
4 and HOPO23
m
4 bendingmodes. This work brings into question the actual formula of lulza-cite Sr2Fe2+(Fe2+,Mg)2Al4(PO4)4(OH)10. The formula should include
some hydrogen phosphate units.
Two overlapping Raman bands at 3419 and 3447 cm 1together
with the sharp intense Raman band at 3590 cm 1are assigned to
the stretching vibrations of the OH units. Infrared bands at 3511 and 3359 cm 1are ascribed to the OH stretching vibration of the
OH units. Very broad bands at 3022 and 3299 cm 1are attributed
to the OH stretching vibrations of water. Vibrational spectroscopy offers insights into the molecular structure of the phosphate mineral lulzacite.
Acknowledgements
The financial and infra-structure support of the Discipline of Nanotechnology and Molecular Science, Science and Engineering Faculty of the Queensland University of Technology, is gratefully acknowledged. The Australian Research Council (ARC) is thanked for funding the instrumentation. The authors would like to acknowledge the Center of Microscopy at the Universidade Federal de Minas Gerais (http://www.microscopia.ufmg.br) for providing the equipment and technical support for experiments involving electron microscopy.
Appendix A. Supplementary data
Supplementary data associated with this article can be found, in the online version, athttp://dx.doi.org/10.1016/j.saa.2014.02.041.
References
[1]Y. Moelo, B. Lasnier, P. Palvadeau, P. Leone, F. Fontan, Comptes Rendu 330 (2000) 317–324.
[2]P. Leone, P. Palvadeau, Y. Moelo, Comptes Rendu 3 (2000) 301–308. [3]Y. Moelo, O. Rouer, M. Bouhnik-Le Coz, Eur. J. Mineral. 20 (2008) 205–216. [4]P. Keller, H. Hess, P.J. Dunn, Chem. Erde 40 (1981) 105–109.
[5]M. Łodzin´ski, M. Sitarz, J. Mol. Struct. 924–926 (2009) 442–447.
[6]R.L. Frost, Y. Xi, R. Scholz, F.M. Belotti, M.C. Filho, J. Mol. Struct. 1033 (2013) 258–264.
[7]R.L. Frost, R. Scholz, A. Lopes, Y. Xi, Z.Z. Gobac, L.F.C. Horta, Spectrochim. Acta A116 (2013) 491–496.
[8]R.L. Frost, A. Lopez, Y. Xi, A. Granja, R. Scholz, Spectrochim. Acta A115 (2013) 22–25.
[9]L.A.d.S. Costa, C. Souza de Miranda, M.I. Campos, D.d.J. Assis, J.I. Druzian, Rev. GEINTEC 3 (2013) 055–069.
[10] J. Jimenez-Guzman, L. Gomez-Ruiz, M. Garcia-Garibay, Informacion Tecnologica 14 (2003) 7–12.
[11]K.C. Sekhar, C.T. Kamala, N.S. Chary, A.B. Mukherjee, Trace Metals Other Contam. Environ. 9 (2007) 315–337.
[12]V.C. Farmer, Mineralogical Society Monograph 4: The Infrared Spectra of Minerals, The Mineralogical Society, London, 1974.
Fig. 7.Raman spectrum of lulzacite (upper spectrum) in the 1400–750 cm 1