SEM, EDX and vibrational spectroscopic study of the phosphate mineral
ushkovite MgFe
2
3+
(PO
4
)
2
(OH)
2
8H
2
O – Implications of the molecular
structure
Andrés López
b, Ricardo Scholz
a, Ray L. Frost
b,⇑, Fernanda M. Belotti
caGeology Department, School of Mines, Federal University of Ouro Preto, Campus Morro do Cruzeiro, Ouro Preto, MG 35,400-00, Brazil bQueensland University of Technology, Brisbane, Queensland, Australia
cFederal University of Itajubá, Campus Itabira, Itabira, MG 35,903-087, Brazil
h i g h l i g h t s
We have studied the mineral ushkovite.
Chemical analysis shows the mineral contains P, Mg with very minor Fe.
Vibrational spectroscopy enhances our knowledge of the molecular structure of ushkovite.
a r t i c l e
i n f o
Article history:
Received 18 August 2014
Received in revised form 8 October 2014 Accepted 9 October 2014
Available online 29 October 2014
Keywords:
Ushkovite Phosphate Hydroxyl
Raman spectroscopy SEM
EDX
a b s t r a c t
The mineral ushkovite has been analyzed using a combination of electron microscopy with EDX and vibrational spectroscopy. Chemical analysis shows the mineral contains P, Mg with very minor Fe. Thus, the formula of the studied ushkovite is Mg32+(PO4)28H2O. The Raman spectrum shows an intense band at 953 cm1assigned to the
m1symmetric stretching mode. In the infrared spectra complexity exists with multiple antisymmetric stretching vibrations observed, due to the reduced tetrahedral symmetry. This loss of degeneracy is also reflected in the bending modes. Strong infrared bands around 827 cm 1are attributed to water librational modes. The Raman spectra of the hydroxyl-stretching region are complex with overlapping broad bands. Hydroxyl stretching vibrations are identified at 2881, 2998, 3107, 3203, 3284 and 3457 cm 1. The wavenumber band at 3457 cm 1is attributed to the presence of FeOH groups. This complexity is reflected in the water HOH bending modes where a strong infrared band centered around 1653 cm 1is found. Such a band reflects the strong hydrogen bonding of the water molecules to the phosphate anions in adjacent layers. Spectra show three distinct OH bending bands from strongly hydrogen-bonded, weakly hydrogen bonded water and non-hydrogen bonded water. Vibrational spectroscopy enhances our knowledge of the molecular structure of ushkovite.
Ó2014 Elsevier B.V. All rights reserved.
Introduction
The mineral ushkovite of formula MgFe23+(PO4)2(OH)28H2O is a
hydrated hydroxy phosphate of ferric iron and magnesium. The mineral is a member of the laueite mineral group. Other minerals in this group are césarferreiraite Fe2+(Fe3+)
2(AsO4)2(OH)28H2O,
ferrolaueite Fe2+Fe 2 3+(PO
4)2(OH)28H2O, gordonite MgAl23+(PO4)2
(OH)28H2O, kastningite (Mn2+, Fe2+, Mg)Al2(PO4)2(OH)28H2O,
laue-ite Mn2+Fe 2 3+(PO
4)2(OH)28H2O, maghrebite MgAl2(AsO4)2(OH)2 8H2O, mangangordonite Mn2+Al23+(PO4)2(OH)28H2O, paravauxite
Fe2+Al 2 3+(PO
4)2(OH)28H2O and sigloite Fe3+Al23+(PO4)2(OH)27H2O
[1].
This group of minerals may be considered as environmental minerals. The minerals are of interest because of their occurrence in environments such as the coatings of water pipes and soils from peat bogs, morasses and sediments[2]. If ground waters are high in both Mg2+and Fe2+then it is possible that both the minerals of the
laueite group such as ferrolaueite and ushkovite may form, particularly when phosphate fertilisers have been used in the surrounding farmlands. In fact, these minerals have been found in sediments in New Zealand.
The Raman spectra of the tetrahedral anions in aqueous systems are well known. The symmetric stretching vibration of the
http://dx.doi.org/10.1016/j.molstruc.2014.10.017
0022-2860/Ó2014 Elsevier B.V. All rights reserved.
⇑ Corresponding author. Tel.: +61 7 3138 2407; fax: +61 7 3138 1804.
E-mail address:[email protected](R.L. Frost).
Contents lists available atScienceDirect
Journal of Molecular Structure
phosphate anion in aqueous systems, (
m
1) is observed at 938 cm 1, the asymmetric stretching mode (m
3) at 1018 cm 1. Them
2mode is observed at 420 cm 1and them
4mode at 567 cm 1. In solids, the
position of the bands will be dependent on the chemical environ-ment. Farmer[3]lists a number of infrared spectra of phosphates including vivianite. The symmetric stretching mode was not listed but the antisymmetric mode was found at 990 and 1040 cm 1.
Bands at 890 and 872 cm 1were not assigned. It is probable that
these are the symmetric stretching modes of the hydrogen bonded phosphate. Bands for the
m
4mode was observed at 475, 560 and 590 cm 1. The formula is close to that of ushkovite. Griffithreported the Raman spectra of vivianite[4]. The laueite minerals are all triclinic and point group 1 bar[5].
There is currently a lack of comprehensive spectral knowledge of the laueite phosphate group minerals including ushkovite and as part of a wider comprehensive study of the vibrational spectros-copy of secondary minerals, we report the vibrational spectrosspectros-copy and molecular structure of ushkovite of the laueite group. As part of our comprehensive research into minerals containing oxyanions, we report the SEM with EDX and vibrational spectroscopy of ushkovite and relate the spectra to the structure of the mineral.
Experimental
Samples description and preparation
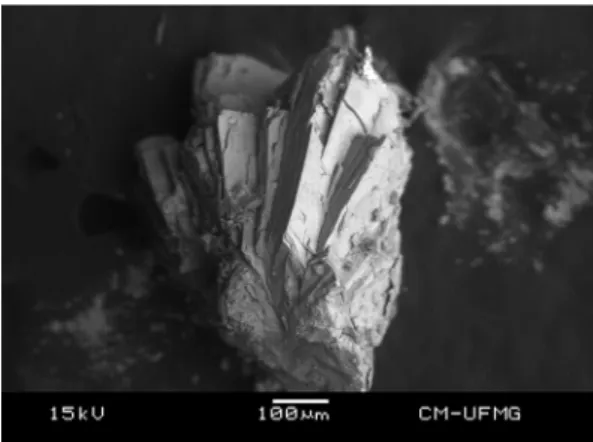
The ushkovite sample studied in this work is from Linópolis, Divino das Laranjeiras, Minas Gerais, Brazil. The sample is part of the collection of the Geology Department of the Federal University of Ouro Preto, Minas Gerais, Brazil, with sample code SAA-083. Ushkovite sample occurs as millimetric crystal aggregates associ-ated with atencioite[6]. The sample was gently crushed and the associated minerals were removed under a stereomicroscope Zeiss Stemi DV4 from the Museu de Ciência e Técnica of the Federal Uni-versity of Ouro Preto. Qualitative and semiquantitative chemical analysis via SEM/EDS was applied to the mineral characterization.
Scanning electron microscopy (SEM)
Experiments and analyses involving electron microscopy were performed in the in the Center of Microscopy of the Universidade Federal de Minas Gerais, Belo Horizonte, Minas Gerais, Brazil (http://www.microscopia.ufmg.br). Ushkovite crystals were coated with a 5 nm layer of evaporated carbon. Secondary Electron and Backscattering Electron images were obtained using a JEOL JSM-6360LV equipment. Qualitative and semi-quantitative chemical analyses in the EDS mode were performed with a ThermoNORAN spectrometer model Quest and were applied to support the mineral characterization.
Raman microprobe spectroscopy
Crystals of ushkovite were placed on a polished metal surface on the stage of an Olympus BHSM microscope, which is equipped with 10, 20, and 50 objectives. The microscope is part of a Renishaw 1000 Raman microscope system, which also includes a monochromator, a filter system and a CCD detector (1024 pixels). The Raman spectra were excited by a Spectra-Physics model 127 He–Ne laser producing highly polarized light at 633 nm and collected at a nominal resolution of 2 cm 1 and a precision of
±1 cm 1in the range between 200 and 4000 cm 1. Repeated
acqui-sitions on the crystals using the highest magnification (50) were accumulated to improve the signal to noise ratio of the spectra. Raman Spectra were calibrated using the 520.5 cm 1 line of a
silicon wafer. The Raman spectrum of at least 10 crystals was collected to ensure the consistency of the spectra.
An image of the ushkovite crystals measured is shown in the Supplementary information as Fig. S1. Clearly the crystals of ushkovite are readily observed, making the Raman spectroscopic measurements readily obtainable.
Infrared spectroscopy
Infrared spectra of ushkovite were obtained using a Nicolet Nexus 870 FTIR spectrometer with a smart endurance single bounce diamond ATR cell. Spectra over the 4,000,525 cm 1range
were obtained by the co-addition of 128 scans with a resolution of 4 cm 1 and a mirror velocity of 0.6329 cm/s. Spectra were
co-added to improve the signal to noise ratio.
Spectral manipulation such as baseline correction/adjustment and smoothing were performed using the Spectracalc software package GRAMS (Galactic Industries Corporation, NH, USA). Band component analysis was undertaken using the Jandel ‘Peakfit’ software package that enabled the type of fitting function to be selected and allows specific parameters to be fixed or varied accordingly. Band fitting was done using a Lorentzian–Gaussian cross-product function with the minimum number of component bands used for the fitting process. The Lorentzian–Gaussian ratio was maintained at values greater than 0.7 and fitting was undertaken until reproducible results were obtained with squared correlations ofr2greater than 0.995.
Results and discussion
Chemical characterization
The SEM image of ushkovite sample studied in this work is reported in Fig. 1. The image shows a crystal fragment up to 0.5 mm. A perfect cleavage parallel to 010 is observed. The chem-ical analysis is provided inFig. 2. The major chemical elements in the composition of the measured sample are Mg, Fe and P. Minor amounts of Al and Si were also observed. The presence of carbon is related to the carbon coating.
Vibrational spectroscopy
The Raman spectrum of ushkovite in the 100–4000 cm 1
spec-tral range is displayed inFig. 3a. This figure displays the Raman spectrum over the 100–4000 cm 1spectral range. This spectrum
shows the position and relative intensities of the Raman bands. It is noted that there are large parts of the spectrum where no intensity or minimal intensity is observed. Thus, the spectrum is subdivided into subsections depending upon the type of vibration being studied. The infrared spectrum of ushkovite in the
500–4000 cm 1spectral region is shown inFig. 3b. This figure
dis-plays the infrared spectrum over the 500–4000 cm 1 spectral
range. This figure shows the position of the infrared bands and their relative intensities. This spectrum displays the position and relative intensities of the infrared bands. As for the Raman spec-trum, there are parts of the spectrum where little or no intensity is observed. Therefore, the spectrum is subdivided into subsections depending on the vibrational mode being analyzed.
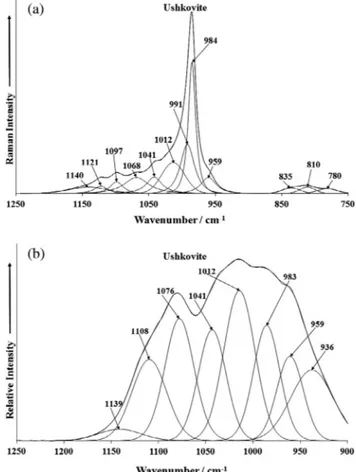
The Raman spectrum of ushkovite over the 750–1250 cm 1
spectral range is reported in Fig. 4a. In the Raman spectrum of
ushkovite, a single intense band is observed at 984 cm 1with low
intensity bands observed at 959 and 991 cm 1. The 984 cm 1band is assigned to the Raman active
m
1 PO43 symmetric stretching vibration. The position of this band is in excellent agreement with a previously published result[7]. The bands at 1012, 1041, 1068, 1097, 1121 and 1140 cm 1are assigned to the phosphatem
3PO43
antisymmetric stretching vibration. These bands are of very low intensity. Piriou and Poullen [7] found bands at 1018 and 1053 cm 1which are in agreement with our results. The phosphate
anion in an aqueous solution shows a single antisymmetric band at 1017 cm 1. In this work, multiple bands are observed, consistent
with the reduction of the phosphate ion symmetry from Tdto C3v
or less to C2vin accord with the crystal structure determination.
The infrared spectrum of ushkovite over the 900–1250 cm 1
spectral range is shown inFig. 4b. The infrared spectrum is complex to say the least, with multiple overlapping bands. This symmetry reduction is borne out in the infrared spectra. Infrared bands are observed at 936, 959, 967, 983, 1012, 1041, 1076 and 1108 cm 1.
The 983 and 1012 cm 1bands are the symmetric stretching
vibra-tions as may be observed in the Raman spectrum. The bands 1041, 1076 and 1108 cm 1correspond to the very low intensity Raman
bands observed at 1012, 1041, 1068, 1097, 1121 and 1140 cm 1.
Previously published infrared data reported by Farmer [3] gave bands at 990 and 1040 cm 1, which are different from the results
reported here. One possibility is that the data is correct, the identi-fication of the mineral used by Farmer incorrect. The infrared bands at 936, 959 are probably due to water librational modes.
The Raman spectrum of ushkovite over the 300–700 cm 1
spec-tral range is reported inFig. 5a. The use of the diamond ATR cell has a lower wavenumber limit of around 550 cm 1, and as a consequence
Fig. 2.EDS analysis of ushkovite.
Fig. 3.(a) Raman spectrum of ushkovite over the 100–4000 cm1spectral range
(upper spectrum) and (b) infrared spectrum of ushkovite over the 500–4000 cm1
spectral range (lower spectrum).
Fig. 4.(a) Raman spectrum of ushkovite (upper spectrum) in the 750–1250 cm1
spectral range and (b) infrared spectrum of ushkovite (lower spectrum) in the 900– 1250 cm 1spectral range.
infrared data for this region were not obtained. One of the strong advantages of Raman spectroscopy is the ability to obtain spectral data below 400 cm 1. The difficulty in the study of this spectral region is a combination of the complexity of the overlap and the number of bands. The difficulty rests with the attribution of the multiple bands found in this region. In aqueous solutions of the phosphate ion, the band observed at 420 cm 1is assigned to
the
m
2bending mode. For ushkovite, Raman bands are observed at 386, 410, 421, 442, and 469 cm 1, with the band at 410 cm 1beingthe most intense. These bands are assigned to the phosphate
m
2 PO43 bending modes. The observation of several bands for theOPO bending region suggests the loss of degeneracy of the PO43
bending modes. The only Raman data for comparison is that reported by Griffith[4], who suggested the bending mode was at 316 cm 1. However, this may be an error. Farmer[3]also did not
report this bending mode. Intense Raman bands are observed at 563 and 583 cm 1and are attributed to the PO
4 3
m
4bending modes.
Other Raman bands are observed at 492, 506, 606, 610 and 637 cm 1. The low intensity Raman bands at 313 and 321 cm 1
are thought to be due to FeO stretching vibrations.
In the Raman spectrum (Fig. 5b), the low intensity bands are attributed to lattice vibrational modes. Intense Raman bands are observed at 144, 183, 206, 216 and 261 cm 1. Other low intensity
bands are noted.
The Raman spectrum of ushkovite over the 2800–3800 cm 1
spectral range is shown inFig. 6a. The Raman spectrum shows com-plexity with a number of overlapping bands. The Raman spectrum is broad with overlapping bands observed at 3225, 3286, 3449, 3495 and 3517 cm 1. The first three bands are attributed to water
with strong hydrogen bonding. The Raman bands at 3449, 3495 and 3517 cm 1are due to water with moderate hydrogen bonding.
Fig. 5.(a) Raman spectrum of ushkovite (upper spectrum) in the 300–700 cm1
spectral range and (b) Raman spectrum of ushkovite (lower spectrum) in the 100– 300 cm 1spectral range.
Fig. 6.(a) Raman spectrum of ushkovite (upper spectrum) in the 2800–3800 cm 1
spectral range and (b) infrared spectrum of ushkovite (lower spectrum) in the 2800–3800 cm1spectral range.
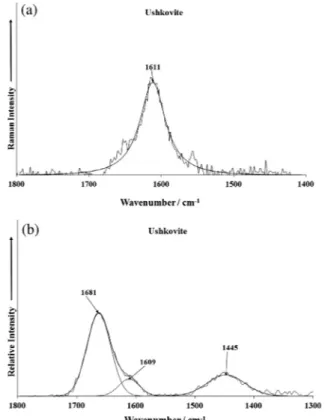
Fig. 7.(a) Raman spectrum of ushkovite (upper spectrum) in the 1400–1800 cm 1
The infrared spectrum of ushkovite over the 2800–3800 cm 1
spec-tral range is shown inFig. 6b. The spectrum appears broad and complex with a significant number of bands. Infrared bands are noted at 2990, 3131, 3253, 3343 and 3481 cm 1. These bands are
ascribed to the stretching bands of water. The number of observed bands proves that water in involved in a number of molecular envi-ronments with a wide range of hydrogen bonding strengths. The infrared bands at 2990 and 3131 cm 1are indicative of water with
short hydrogen bonds. The infrared bands at 3253 and 3343 cm 1
are due to water with moderate hydrogen bonding, whereas the band at 3481 cm 1is due to weak hydrogen bonding.
The Raman spectrum of ushkovite over the 1400–1800 cm 1 spectral range is shown in Fig. 7a. Raman band is observed at 1611 cm 1and is assigned to water bending modes.
The infrared spectrum of ushkovite over the 1400–1800 cm 1
spectral range is shown inFig. 7b. The infrared spectrum in this spectral region displays infrared bands at 1609 and 1681 cm 1.
These bands are assigned to the bending modes of water. The position of these bands shows that water is in the structure of ushkovite with different hydrogen bond strengths. The number of bands observed in this spectral region is in harmony with the number of bands in the hydroxyl stretching region (Fig. 6b).
Conclusions
A combination of Raman and infrared spectroscopy has been used to study the phosphate mineral ushkovite. Bands attributed to the water hydroxyl stretching, bending and librational modes are identified and show the existence of different types of water molecules in the structure, namely adsorbed, weakly and strongly hydrogen-bonded. A single phosphate symmetric stretching vibra-tion is observed but several antisymmetric stretching modes are observed consistent with a loss of symmetry of the phosphate anion in the mineral crystals. The loss of symmetry also results
in several in-plane and out of plane bending modes. The observa-tion of blue materials in soils and sediments has suggested the use of Raman spectroscopy for the identification of ushkovite in these soils. It is suspected that the other phosphate minerals exist in ground water drainage sites but this remains to be proved.
Acknowledgements
The financial and infra-structure support of the Discipline of Nanotechnology and Molecular Science, Science and Engineering Faculty of the Queensland University of Technology, is gratefully acknowledged. The Australian Research Council (ARC) is thanked for funding the instrumentation. R. Scholz is grateful to PROPP/ UFOP, project No. 03/2014.
Appendix A. Supplementary material
Supplementary data associated with this article can be found, in the online version, athttp://dx.doi.org/10.1016/j.molstruc.2014.10. 017.
References
[1]R. Scholz, N.V. Chukanov, A.D.M. Filho, D.D. Atenico, L. Lagoeiro, F.M. Belotti, M.L.S.C. Chaves, A.W. Romano, P.R. Brandao, F.I. Belakovskiy, I. Pekov, Am. Mineral. 99 (2014) 607–611.
[2]G.S. Henderson, P.M. Black, K.A. Rodgers, P.C. Rankin, New Zealand J. Geol. Geophys. 27 (1984) 367–378.
[3] V.C. Farmer, Mineralogical Society Monograph 4, The Infrared Spectra of Minerals, 1974.
[4]W.P. Griffith, J. Chem. Soc. A (1970) 286–291.
[5]J.W. Anthony, R.A. Bideaux, K.W. Bladh, M.C. Nichols, Handbook of Mineralogy, Arsenates, Phosphates, Vanadates, vol. IV, Mineral Data Publishing, Tucson, Arizona, 2000.
[6]N.V. Chukanov, R.K. Rastsvetaeva, S. Möckel, A.E. Zadov, L.A. Levitskaya, New Data Mineral. 41 (2006) 18–25.
[7]B. Piriou, J.F. Poullen, Bull. Mineral. 110 (1987) 697–710.