The molecular structure of the phosphate mineral beraunite
Fe
2+
Fe
5
3+
(PO
4
)
4
(OH)
5
4H
2
O – A vibrational spectroscopic study
Ray L. Frost
a,⇑, Andrés López
a, Ricardo Scholz
b, Yunfei Xi
a, Cristiano Lana
baSchool of Chemistry, Physics and Mechanical Engineering, Science and Engineering Faculty, Queensland University of Technology, GPO Box 2434, Brisbane, Queensland 4001, Australia bGeology Department, School of Mines, Federal University of Ouro Preto, Campus Morro do Cruzeiro, Ouro Preto, MG 35,400-00, Brazil
h i g h l i g h t s
We have studied the phosphate mineral beraunite.
The mineral contains both ferrous and ferric ions in the formula.
Raman bands are attributed to the stretching and bending modes of phosphate.
Infrared bands are assigned to OH stretching vibrations.
Vibrational spectroscopy offers insights into the molecular structure of the phosphate mineral beraunite.
g r a p h i c a l
a b s t r a c t
a r t i c l e
i n f o
Article history:
Received 2 December 2013
Received in revised form 27 February 2014 Accepted 27 February 2014
Available online 14 March 2014
Keywords: Beraunite Ferrous–ferric Infrared Phosphate Raman spectroscopy
a b s t r a c t
The mineral beraunite from Boca Rica pegmatite in Minas Gerais with theoretical formula Fe2+
Fe53+(PO4)4(OH)54H2O has been studied using a combination of electron microscopy with EDX and
vibrational spectroscopic techniques.
Raman spectroscopy identifies an intense band at 990 cm 1and 1011 cm1. These bands are attributed
to the PO43 m1symmetric stretching mode. Them3antisymmetric stretching modes are observed by a large number of Raman bands. The Raman bands at 1034, 1051, 1058, 1069 and 1084 together with the Raman bands at 1098, 1116, 1133, 1155 and 1174 cm 1are assigned to the
m3antisymmetric stretch-ing vibrations of PO43 and the HOPO32 units. The observation of these multiple Raman bands in the
sym-metric and antisymsym-metric stretching region gives credence to the concept that both phosphate and hydrogen phosphate units exist in the structure of beraunite. The series of Raman bands at 567, 582, 601, 644, 661, 673, and 687 cm 1are assigned to the PO
4 3
m2bending modes. The series of Raman bands at 437, 468, 478, 491, 503 cm 1are attributed to the PO
4
3 and HOPO 3 2 m
4bending modes.
No Raman bands of beraunite which could be attributed to the hydroxyl stretching unit were observed. Infrared bands at 3511 and 3359 cm 1are ascribed to the OH stretching vibration of the OH units. Very
broad bands at 3022 and 3299 cm 1are attributed to the OH stretching vibrations of water. Vibrational
spectroscopy offers insights into the molecular structure of the phosphate mineral beraunite.
Ó2014 Elsevier B.V. All rights reserved.
http://dx.doi.org/10.1016/j.saa.2014.02.198 1386-1425/Ó2014 Elsevier B.V. All rights reserved.
⇑Corresponding author. Tel.: +61 7 3138 2407; fax: +61 7 3138 1804. E-mail address:[email protected](R.L. Frost).
Contents lists available atScienceDirect
Spectrochimica Acta Part A: Molecular and
Biomolecular Spectroscopy
Introduction
The mineral beraunite has been known for a considerable time
[1–3]and was often confused with other phosphate minerals such as vivianite[4]. Beraunite Fe2+Fe
5 3+(PO
4)4(OH)54H2O is essentially
an iron phosphate mineral which contains iron in both the ferrous and ferric state. It was first described in an occurrence in Beraun in the Czech Republic[5,6]. The beraunite occurs as a secondary min-eral in iron ore deposits and as an alteration product of primary phosphates in granitic pegmatites.
The mineral occurs as a fibrous green to black/brown nodules. According to the literature[7,8], variation in the chemical compo-sition may occur with irrational amounts of ferrous iron. Beraunite crystallizes in the monoclinic crystal system with point group 2/m
[9]. The chain segments in beraunite are one and two octahedra in length[10]. Beraunite has two different types which are Zn-rich and Al-rich beraunites. Phosphate minerals have special character-istics about their chemical composition. The polyatomic complex of iron–oxygen octahedral face is sharing triplets corner to four other octahedral in the arrangement of atoms of the basic iron phosphates such as with dufrenite, rockbridgeite and beraunite. This arrangement is held together by the phosphate tetrahedra. The larger Fe2+ ion occupies a separate and distinct position in
the structure of beraunite from the five other Fe3+ions.
Raman spectroscopy has proven most useful for the study of mineral structure [11–15]. Raman spectroscopy is an important tool in the characterization of phosphates in pegmatite rocks
[16]. In recent years, spectroscopic studies concerning phosphate minerals are increasing, especially due to their industrial and tech-nological importance. The aim of this paper is to report the Raman spectra of beraunite, and to relate the spectra to the molecular structure of this hydrogen-phosphate mineral. The paper follows the systematic research of the large group of supergene minerals and especially molecular structure of minerals containing oxya-nions using IR and Raman spectroscopy.
Experimental
Samples description and preparation
The beraunite sample studied in this work forms part of the col-lection of the Geology Department of the Federal University of Ouro Preto, Minas Gerais, Brazil, with sample code SAC-106. The studied sample is from Boca Rica pegmatite in Minas Gerais, Brazil, and occurs in association with heterosite. Geological description and characterization of the phosphate paragenesis in Boca Rica pegmatite was published[17].
The sample was gently crushed and the associated minerals were removed under a stereomicroscope Leica MZ4. The beraunite studied in this work occurs in association with siderite. Scanning electron microscopy (SEM) in the EDS mode was applied to support the mineral characterization.
Scanning electron microscopy (SEM)
Experiments and analyses involving electron microscopy were performed in the Center of Microscopy of the Universidade Federal de Minas Gerais, Belo Horizonte, Minas Gerais, Brazil (http:// www.microscopia.ufmg.br).
Beraunite crystal aggregate was coated with a 5 nm layer of evaporated carbon. Secondary Electron and Backscattering Elec-tron images were obtained using a JEOL JSM-6360LV equipment. Qualitative and semi-quantitative chemical analyses in the EDS mode were performed with a ThermoNORAN spectrometer model Quest and were applied to support the mineral characterization.
Raman microprobe spectroscopy
Crystals of beraunite were placed on a polished metal surface on the stage of an Olympus BHSM microscope, which is equipped with 10, 20, and 50objectives. The microscope is part of a Renishaw 1000 Raman microscope system, which also includes a monochromator, a filter system and a CCD detector (1024 pixels). The Raman spectra were excited by a Spectra-Physics model 127 He–Ne laser producing highly polarized light at 633 nm and col-lected at a nominal resolution of 2 cm 1 and a precision of
±1 cm 1 in the range between 200 and 4000 cm 1. The poser at
the sample was less than 1 mW. Repeated acquisitions on the crys-tals using the highest magnification (50) were accumulated to improve the signal to noise ratio of the spectra. Raman spectra were calibrated using the 520.5 cm 1line of a silicon wafer. The
Raman spectrum of at least 10 crystals was collected to ensure the consistency of the spectra.
An image of the beraunite crystals measured is shown in the supplementary information as Fig. S1. Clearly the crystals of bera-unite are readily observed, making the Raman spectroscopic mea-surements readily obtainable.
Infrared spectroscopy
Infrared spectra were obtained using a Nicolet Nexus 870 FTIR spectrometer with a smart endurance single bounce diamond ATR cell. Spectra over the 4000–525 cm 1 range were obtained
by the co-addition of 128 scans with a resolution of 4 cm 1and a
mirror velocity of 0.6329 cm/s. Spectra were co-added to improve the signal to noise ratio. The infrared spectra are given in the supplementary information.
Spectral manipulation such as baseline correction/adjustment and smoothing were performed using the Spectracalc software package GRAMS (Galactic Industries Corporation, NH, USA). Band component analysis was undertaken using the Jandel ‘Peakfit’ soft-ware package that enabled the type of fitting function to be selected and allows specific parameters to be fixed or varied accordingly. Band fitting was done using a Lorentzian–Gaussian cross-product function with the minimum number of component bands used for the fitting process. The Gaussian–Lorentzian ratio was maintained at values greater than 0.7 and fitting was under-taken until reproducible results were obtained with squared correlations ofr2greater than 0.995.
Results and discussion
Chemical characterization
The BSE image of beraunite sample studied in this work is shown in Fig. S1. The image shows an aggregate of prismatic crys-tals with acicular habitus. The sample is homogeneous and zona-tion or contaminant phases are not observed. Qualitative and semi-quantitative chemical composition shows a Fe phosphate (Fig. S2). No other cations were observed in substitution to Fe.
Infrared and Raman spectroscopy
Background
In aqueous systems, the Raman spectra of phosphate oxyanions show a symmetric stretching mode (
m
1) at 938 cm 1, an antisym-metric stretching mode (m
3) at 1017 cm 1, a symmetric bending mode (m
2) at 420 cm 1 and am
4 bending mode at 567 cm 1hydroxylated or both[21]. The vibrational spectrum of the dihydro-gen phosphate anion has been reported in Farmer. The PO2
symmet-ric stretching mode occurs at 1072 cm 1and the POH symmetric
stretching mode at878 cm 1. The position of the PO stretching vibration for calcium dihydrogen phosphate is found at 915 cm 1.
The POH antisymmetric stretching mode is at 947 cm 1and the
P(OH)2bending mode at 380 cm 1. The band at 1150 cm 1is
as-signed to the PO2antisymmetric stretching mode. The position of
these bands will shift according to the crystal structure of archerite.
Vibrational spectroscopy
Vibrational spectroscopy provides a means of studying the molecular structure of a mineral such as beraunite at the molecular level. The Raman spectrum of beraunite over the 100–1500 cm 1
spectral range is illustrated inFig. 1a. This spectrum shows the po-sition of the bands and the relative intensities of these bands. Dif-ficulty was experienced in obtaining the Raman spectrum of the OH stretching region. There are large parts of the spectrum where no intensity is observed and therefore the spectrum is subdivided into sections based upon the type of vibration being studied. The infrared spectrum over the 500–4000 cm 1spectral range is shown
inFig. 1b. This spectrum shows the position and relative intensity of these infrared bands. There are large parts of the spectrum where no intensity is observed and therefore, the spectrum is sub-divided into sections depending upon the type of vibration being observed.
The Raman spectrum of beraunite in the 900–1200 cm 1
spec-tral range as displayed inFig. 2a is complex. Multiple overlapping bands are observed. Such complexity is even more profound in the
infrared spectrum of beraunite (Fig. 2b). This complexity is associ-ated with the fact that both ferrous and ferric iron exist in the structure of beraunite. The phosphate anion bonds to both cations and each interaction will give a separate set of phosphate bands. A further complication can arise with the mobility of the proton from the OH units. One possibility is that the proton of the hydroxyl unit is mobile and on a picoseconds time scale can transfer to the phosphate units, thus generating a HOPO32 unit. The Raman bands
at 990 and 1011 cm 1 are assigned to the PO 4 3
m
1 symmetric
stretching vibrations. A Raman band is observed at 969 cm 1and
is attributed to the PO symmetric stretching vibration of these HOPO32 units. The Raman bands at 1034, 1051, 1058, 1069 and
1084 together with the Raman bands at 1098, 1116, 1133, 1155 and 1174 cm 1 are assigned to the
m
3 antisymmetric stretching
vibrations of PO43 and the HOPO32 units.
The infrared spectrum of beraunite in the 650–1200 cm 1
spec-tral range is reported inFig. 2b. A broad spectral feature is ob-served which may be resolved into component bands. The infrared bands at 928, 958, 985 and 1009 cm 1 are assigned to
the symmetric stretching vibrations of the PO43 and HOPO32 units.
The infrared bands at 1030, 1068, 1096 and 1150 cm 1are attrib-uted to the phosphate and hydrogen phosphate
m
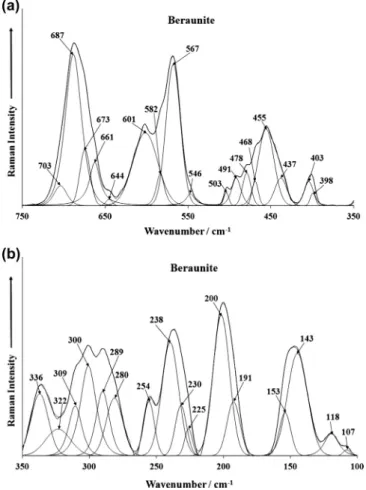
3antisymmetric stretching vibrations.The Raman spectrum of beraunite in the 350–750 cm 1spectral
range is illustrated inFig. 3a. The series of Raman bands at 567, 582, 601, 644, 661, 673, and 687 are assigned to the PO43 and
HOPO32
m
2 bending modes. The complexity of the phosphate stretching region is also reflected in the phosphate bending region. The series of Raman bands at 437, 468, 478, 491, 503 cm 1areattributed to the PO43 and HOPO32
m
4bending modes. The twoFig. 1.(a) Raman spectrum of beraunite over the 4000–100 cm 1spectral range. (b) Infrared spectrum of beraunite over the 4000–500 cm1spectral range.
overlapping bands at 398 and 403 cm 1are assigned to the FeO
stretching vibration. The observation of two close bands reflects the ferrous/ferric state of iron in the structure of beraunite. The Raman spectrum of beraunite in the 100–350 cm 1spectral range
is illustrated inFig. 3b. Raman bands are observed at 107, 118, 143, 153, 191, 200, 230, 238 and 254 cm 1. These bands may be
described as external or lattice vibrations. However, the series of Raman bands at 280, 289, 300, 309, and 336 cm 1may be related to metal oxygen stretching vibrations.
The infrared spectrum of beraunite over the 2500–3800 cm 1
spectral range is reported inFig. 4. This spectrum reflects the OH
stretching vibrations as may be observed from the formula of ber-aunite (Fe2+Fe
5 3+(PO
4)4(OH)54H2O). The infrared bands at 3511 and
3359 cm 1are assigned to the OH stretching vibration of the OH
units. The very broad bands at 3022 and 3299 cm 1are attributed
to the OH stretching vibrations of water. It is noted that no Raman spectrum of beraunite could be obtained in this spectral region for whatever reason. The observation of two bands in the water OH stretching region is in harmony with the infrared spectrum dis-played inFig. 5. Infrared bands found at 1624 and 1664 cm 1are
assigned to the water bending modes. The observation of these two bands reflects water is involved with both very weak and very strong hydrogen bonding in the beraunite structure. A comparison may be made with the mineral wolfeite (Fe2+)
2(PO4)(OH), a mineral
which has ferrous iron only in the structure. The infrared spectrum shows sharp bands at 3477, 3495, 3515 and 3541 cm 1. These bands are assigned to the OH stretching vibration. The observation of these multiple bands gives credence to the concept that the OH units are non-equivalent in the structure of wolfeite.
Conclusions
A beraunite sample was studied by Electron Microscope in the EDS mode, Raman and infrared spectroscopy. The chemical analy-sis by SEM/EDS shows a homogeneous phase composed by Fe and P. The sample can be considered a pure phase.
Raman spectroscopy identifies an intense band at 990 cm 1and
1011 cm 1. These bands are attributed to the PO 4 3
m
1symmetric
stretching mode. The
m
3antisymmetric stretching modes are ob-served by a large number of Raman bands. The Raman bands at 1034, 1051, 1058, 1069 and 1084 together with the Raman bands at 1098, 1116, 1133, 1155 and 1174 cm 1are assigned to them
3
anti-symmetric stretching vibrations of PO43 and the HOPO32 units. The
observation of these multiple Raman bands in the symmetric and antisymmetric stretching region gives credence to the concept that both phosphate and hydrogen phosphate units exist in the structure of beraunite. The infrared spectrum shows complexity with many overlapping bands. The series of Raman bands at 567, 582, 601, 644, 661, 673, and 687 to cm 1are assigned to the PO
4 3
m
2bending
modes. The series of Raman bands at 437, 468, 478, 491, 503 cm 1
are attributed to the PO43 and HOPO32
m
4bending modes.No Raman bands which could be attributed to the hydroxyl stretching unit were found. Infrared bands at 3511 and 3359 cm 1are ascribed to the OH stretching vibration of the OH
units. Very broad bands at 3022 and 3299 cm 1are attributed to
the OH stretching vibrations of water. Vibrational spectroscopy of-fers insights into the molecular structure of the phosphate mineral beraunite.
Fig. 3.(a) Raman spectrum of beraunite over the 800–300 cm 1spectral range. (b) Raman spectrum of beraunite over the 300–100 cm1spectral range.
Fig. 4.Infrared spectrum of beraunite over the 3800–2600 cm1spectral range.
Acknowledgements
The financial and infra-structure support of the Discipline of Nanotechnology and Molecular Science, Science and Engineering Faculty of the Queensland University of Technology, is gratefully acknowledged. The Australian Research Council (ARC) is thanked for funding the instrumentation. The authors would like to acknowledge the Center of Microscopy at the Universidade Federal de Minas Gerais (http://www.microscopia.ufmg.br) for providing the equipment and technical support for experiments involving electron microscopy. R. Scholz thanks to CNPq – Conselho Nacional de Desenvolvimento Científico e Tecnológico (Grant Nos. 306287/ 2012-9 and 402852/2012-5).
Appendix A. Supplementary material
Supplementary material associated with this article can be found, in the online version, at http://dx.doi.org/10.1016/j.saa. 2014.02.198.
References
[1] Church, J. Chem. Soc. 23 (1870) 3–5. [2]A. Frenzel, Jahrbuch f. Min. (1873) 23.
[3]A. Russell, Mineral. Mag. 21 (1927) 272–275.
[4] H. Bowley, [Mineral notes.], Rept. Chem. Branch, Dept. Mines, Western Australia, (1941) 10–11.
[5]E. Lehrieder, P. Cerny, Aufschluss 50 (1999) 79–95.
[6]J. Sejkora, R. Skoda, P. Ondrus, P. Beran, C. Susser, J. Czech Geol. Soc. 51 (2006) 103–147.
[7]P.B. Moore, Science 164 (1969) 1063–1064. [8]P.B. Moore, Am. Mineral. 55 (1970) 135–169.
[9]L. Fanfani, P.F. Zanazzi, Acta Crystallogr. 22 (1967) 173–181. [10]P.B. Moore, A.R. Kampf, Zeit. fuer Krist. 201 (1992) 263–281.
[11]R.L. Frost, S.J. Palmer, Y. Xi, J. Cejka, J. Sejkora, J. Plasil, Spectrochim. Acta A103 (2013) 431–434.
[12]R.L. Frost, Y. Xi, R. Scholz, M. Belotti Fernanda, Spectrochim. Acta A103 (2013) 143–150.
[13]R.L. Frost, Y. Xi, R. Scholz, M. Belotti Fernanda, A. Dias Menezes Filho Luiz, Spectrochim. Acta A104 (2013) 250–256.
[14]R.L. Frost, A. Lopez, Y. Xi, A. Granja, R. Scholz, R.M.F. Lima, Spectrochim. Acta A114 (2013) 309–315.
[15]R.L. Frost, R. Scholz, A. Lopes, Y. Xi, Z.Z. Gobac, L.F.C. Horta, Spectrochim. Acta A116 (2013) 491–496.
[16]M. Łodzin´ski, M. Sitarz, J. Mol. Struct. 924–926 (2009) 442–447.
[17]M.L.S.C. Chaves, R. Scholz, D. Atencio, J. Karfunkel, Geociências 24 (2005) 143 (in Portuguese).
[18]R.L. Frost, W. Martens, P.A. Williams, J.T. Kloprogge, Mineral. Mag. 66 (2002) 1063–1073.
[19]R.L. Frost, W.N. Martens, T. Kloprogge, P.A. Williams, Neues Jahrb. fuer Min. Mt (2002) 481–496.
[20]R.L. Frost, P.A. Williams, W. Martens, J.T. Kloprogge, P. Leverett, J. Raman Spectrosc. 33 (2002) 260–263.