83
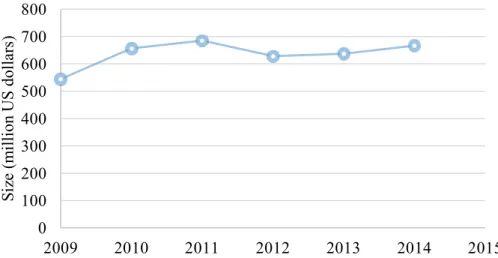
Appendix (I): Jewelry Market
0
100
200
300
400
500
600
700
800
2009
2010
2011
2012
2013
2014
2015
Si
ze
(m
ill
ion
U
S dol
la
rs
)
Market (Jewelry and Related Items) in Portugal
84
Figure 2: Inês Telles JewelryFigure 4: Liliana Guerreiro
Figure 5: Lia Goncalves
Figure 3: Filigrana D'Viana
85
Appendix (III): Value Chain
88
Figure 9: Distribution channels in Portugal. Ourivesaria Arneiro and Ourivesaria Alfeijóias websites; Ourivesaria Morais, Loja de Serralves and Loja da Casa Verde; IZU Chiado and FIL (Feira Internacional de Lisboa)89
Figure 11: Liliana Alves Jewelry Design Website90
Appendix (IV): Financial Analysis
Figure 13: Annual income
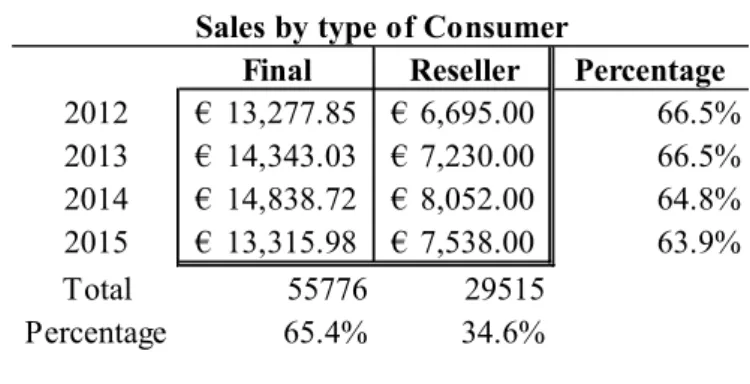
Figure 14: Sales by type of consumer
Figure 15: Trends - Worst Case Scenario
Figure 16: Trends - Most Predictable Scenario
Figure 17: Trends - Best Case Scenario 2008 Change from Previous Year 2009 Change from Previous Year 2010 Change from Previous Year 2011 Change from Previous Year 2012 Change from Previous Year 2013 Change from Previous Year 2014 Change from Previous Year 2015 (So Far) Change from Previous Year 12,957
€ - € 27,026 109% € 24,252 -10% € 12,559 -48% € 19,973 59% € 21,573 8% € 22,891 6% € 20,854 -9%
Annual Revenues
Final
Reseller
Percentage
2012
€
13,277.85
€
6,695.00
66.5%
2013
€
14,343.03
€
7,230.00
66.5%
2014
€
14,838.72
€
8,052.00
64.8%
2015
€
13,315.98
€
7,538.00
63.9%
Total
55776
29515
Percentage
65.4%
34.6%
Sales by type of Consumer
2014 Change from Previous Year 2015 Change from Previous Year 2016 Change from Previous Year 2017 Change from Previous Year 2018 Change from Previous Year 2019 Change from Previous Year 2020 Change from Previous Year 22,891
€ 6% € 24,036 5% € 25,237 5% € 26,499 5% € 27,824 5% € 29,215 5% € 30,676 5% Worst Case Scenario
2014 Change from Previous Year 2015 Change from Previous Year 2016 Change from Previous Year 2017 Change from Previous Year 2018 Change from Previous Year 2019 Change from Previous Year 2020 Change from Previous Year 22,891
€ 6% € 27,469 20% € 30,216 10% € 33,238 10% € 36,562 10% € 40,218 10% € 44,239 10% Most Predictable Scenario
2014 Change from Previous Year 2015 Change from Previous Year 2016 Change from Previous Year 2017 Change from Previous Year 2018 Change from Previous Year 2019 Change from Previous Year 2020 Change from Previous Year 22,891
91
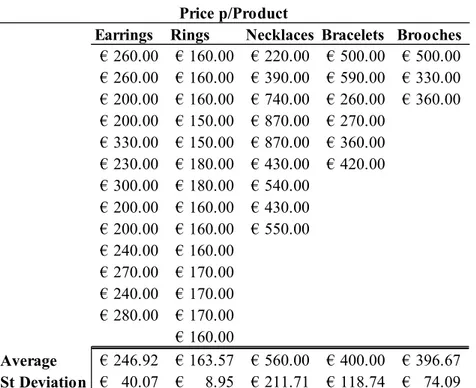
Figure 18: Price per type of productEarrings Rings
Necklaces Bracelets Brooches
260.00
€
€
160.00
€
220.00
€
500.00
€
500.00
260.00
€
€
160.00
€
390.00
€
590.00
€
330.00
200.00
€
€
160.00
€
740.00
€
260.00
€
360.00
200.00
€
€
150.00
€
870.00
€
270.00
330.00
€
€
150.00
€
870.00
€
360.00
230.00
€
€
180.00
€
430.00
€
420.00
300.00
€
€
180.00
€
540.00
200.00
€
€
160.00
€
430.00
200.00
€
€
160.00
€
550.00
240.00
€
€
160.00
270.00
€
€
170.00
240.00
€
€
170.00
280.00
€
€
170.00
160.00
€
Average
€
246.92
€
163.57
€
560.00
€
400.00
€
396.67
St Deviation
€
40.07
€
8.95
€
211.71
€
118.74
€
74.09
Price p/Product
Portugal Portugal Canada France Switzerland Switzerland
(P) (P) (Toronto) (F) (CH) (CH)
Resellers RRP Resellers Resellers Resellers RRP Basic Price € 235 € 235 € 235 € 235 € 235 € 235 € 235 € 235 € 235
Increase 0% 100% 50% 30% 50% 125%
€ 235.0 € 470.0 € 352.5 € 305.5 € 352.5 € 528.8
VAT 23% 23% 0 0 0 23%
€ 289.05 € 578.10 € - € 352.50 € - € 305.50 € - € 352.50 € 650.36
Real 24/04/2015 Aplicada + Exchange + Exchange + Exchange
x - 1,0338 Switzerland x - 0,9673 1.1 CHF 387.75 CHF 715.40
+ or -x - 1,3995 Canada x - 0,7145 1.3995 $ 493.32
Prices by Source of Revenue
Exchange
92
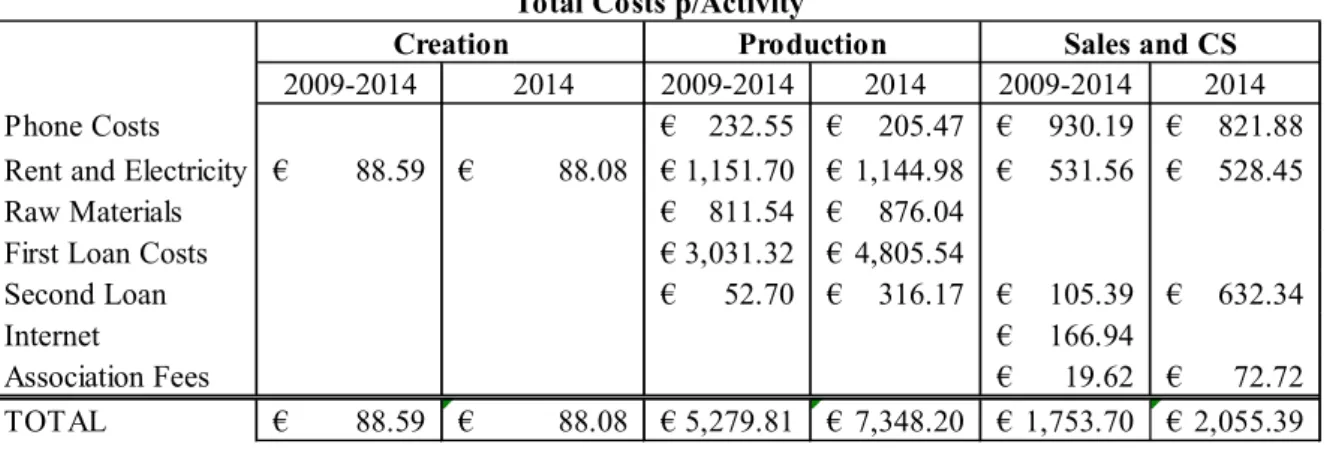
Figure 20: Total costs per activity2009-2014 2014 2009-2014 2014 2009-2014 2014
Phone Costs € 232.55 € 205.47 € 930.19 € 821.88 Rent and Electricity € 88.59 € 88.08 € 1,151.70 € 1,144.98 € 531.56 € 528.45
Raw Materials € 811.54 € 876.04
First Loan Costs € 3,031.32 € 4,805.54
Second Loan € 52.70 € 316.17 € 105.39 € 632.34
Internet € 166.94
Association Fees € 19.62 € 72.72
TOTAL € 88.59 € 88.08 € 5,279.81 € 7,348.20 € 1,753.70 € 2,055.39
Total Costs p/Activity
Sales and CS
Creation Production
2009 2010 2011 2012 2013 2014
Revenues € 27,026.00 € 24,252.00 € 12,559.00 € 19,973.00 € 21,573.00 € 22,891.00 VAT € 5,355.69 € 4,805.97 € 2,488.79 € 3,958.01 € 4,275.08 € 4,536.26 Raw Materials Cost € 1,028.46 € 922.90 € 477.93 € 751.86 € 812.05 € 876.04 Fixed Costs € 4,763.81 € 8,399.67 € 7,552.75 € 8,018.02 € 10,253.87 € 9,917.61 Earnings € 15,878.04 € 10,123.46 € 2,039.53 € 7,245.11 € 6,232.01 € 7,561.09
Margin 59% 42% 16% 36% 29% 33%
Profit Margins
93
Appendix (V): Internationalization Strategy
Income Segments Annual household income
Global >$113000
Upper Middle $56500-$113000
Middle $22500-$56499
Lower Middle $13500-$22499
Deprived <$13500
Figure 22: Annual household income per income segment
0 20 40 60
Global Upper MiddleMiddle Lower MiddleDeprived
In
com
e
Se
gm
ent
s
Distribution of consumption and population
% of total population % of total consumption
Figure 23: Distribution of consumption and population per income segment
(Source: Economist Intelligence Unit, June 2009; World Bank, June 2009; McKinsey Analysis)
Figure 24: Countries with McDonald's restaurants, showing their first year with its first restaurant
94
The following section includes data of every variable introduced in the
internationalization model. The last column of the tables A.1 to A.8 contains the score
of each country according to the variable under analysis, with higher score meaning
higher attractiveness of the market. The table “B) Macro Score” presents the
calculations to achieve the country scores at the macroeconomic level by a weighted
average. Finally, the table “C) Final Score” follows the same pattern but adds the
market specific variables: market size and consumer expenditure.
A)
Variables
1.
GDP per capita adjusted to PPP
(constant 2011 international $)
Country GDP pc PPP ($) Score
Qatar 146 178 100%
Macao SAR, China 139 767 96%
Luxembourg 90 252 62%
Singapore 82 763 57%
Brunei Darussalam 76 754 53%
Kuwait 75 349 52%
United Arab Emirates 66 009 45%
Norway 64 893 44%
Switzerland 57 983 40%
Hong Kong SAR, China 55 084 38%
United States 54 629 37%
North America 53 573 37%
Saudi Arabia 51 924 36%
Bermuda 51 632 35%
Ireland 47 804 33%
Netherlands 47 131 32%
Austria 46 165 32%
Germany 45 616 31%
Bahrain 45 479 31%
Sweden 45 144 31%
Denmark 44 863 31%
Canada 44 089 30%
Australia 43 902 30%
Iceland 43 393 30%
Belgium 42 725 29%
Finland 39 754 27%
United Kingdom 39 137 27%
France 38 847 27%
Oman 38 395 26%
95
Japan 36 426 25%
European Union 36 244 25%
Puerto Rico 35 709 24%
Italy 34 758 24%
Korea, Rep. 34 356 24%
Spain 33 763 23%
Israel 33 072 23%
Trinidad and Tobago 31 074 21%
Cyprus 30 873 21%
Equatorial Guinea 30 583 21%
Czech Republic 30 445 21%
Malta 30 003 21%
Slovenia 29 917 20%
Portugal 28 327 19%
Slovak Republic 27 585 19%
Lithuania 26 643 18%
Estonia 26 355 18%
Seychelles 26 245 18%
Greece 26 099 18%
Russian Federation 25 636 18%
Malaysia 24 951 17%
Poland 24 882 17%
Hungary 24 498 17%
Kazakhstan 24 205 17%
Bahamas, The 23 491 16%
Latvia 23 337 16%
St. Kitts and Nevis 22 669 16%
Chile 22 346 15%
Antigua and Barbuda 21 800 15%
Cuba 21 442 15%
Croatia 21 252 15%
Panama 20 895 14%
Uruguay 20 884 14%
Romania 19 401 13%
Turkey 19 226 13%
Gabon 19 038 13%
Mauritius 18 585 13%
Belarus 18 185 12%
Venezuela, RB 17 558 12%
Azerbaijan 17 516 12%
Lebanon 17 462 12%
Mexico 16 950 12%
Suriname 16 807 11%
96
Bulgaria 16 324 11%
Botswana 16 099 11%
Arab World 15 910 11%
Brazil 15 838 11%
Libya 15 591 11%
Turkmenistan 15 474 11%
Costa Rica 14 918 10%
Palau 14 757 10%
Thailand 14 552 10%
Maldives 14 533 10%
Iraq 14 469 10%
Montenegro 14 323 10%
Algeria 14 167 10%
Barbados 13 575 9%
Colombia 13 357 9%
Dominican Republic 13 262 9%
China 13 217 9%
Macedonia, FYR 13 142 9%
South Africa 13 046 9%
Serbia 12 660 9%
Jordan 12 050 8%
Peru 11 989 8%
Mongolia 11 946 8%
Grenada 11 944 8%
Tunisia 11 459 8%
Ecuador 11 350 8%
97
2.
Big Mac Index
Country price local dollar ex Dollar price dollar ppp valuation Dollar (dollar price) Score
Switzerland 6,5 0,86 7,54 1,36 57,49 100%
Norway 48 7,62 6,3 10,02 31,46 84%
Denmark 34,5 6,42 5,38 7,2 12,23 71%
Brazil 13,5 2,59 5,21 2,82 8,7 69%
Sweden 40,7 8,19 4,97 8,5 3,73 66%
United States 4,79 1 4,79 1 0 64%
Finland 4,1 0,86 4,75 0,86 -0,83 63%
Canada 5,7 1,23 4,64 1,19 -3,14 62%
Uruguay 113 24,43 4,63 23,59 -3,42 61%
France 3,9 0,86 4,52 0,81 -5,66 60%
New Zealand 5,9 1,31 4,49 1,23 -6,21 60%
Italy 3,85 0,86 4,46 0,8 -6,87 59%
Israel 17,5 3,93 4,45 3,65 -7,14 59%
Britain 2,89 0,66 4,37 0,6 -8,81 58%
Australia 5,3 1,23 4,32 1,11 -9,84 57%
Belgium 3,7 0,86 4,29 0,77 -10,5 57%
Germany 3,67 0,86 4,25 0,77 -11,23 56%
Spain 3,65 0,86 4,23 0,76 -11,71 56%
Ireland 3,49 0,86 4,04 0,73 -15,58 54%
Costa Rica 2150 536,09 4,01 448,85 -16,27 53%
Netherlands 3,54 0,86 4 0,72 -16,55 53%
Turkey 9,25 2,33 3,96 1,93 -17,24 53%
Austria 3,39 0,86 3,93 0,71 -18 52%
South Korea 4100 1083,3 3,78 855,95 -20,99 50%
Philippines 163 44,41 3,67 34,03 -23,37 49%
UAE 13 3,67 3,54 2,71 -26,11 47%
Singapore 4,7 1,33 3,53 0,98 -26,4 47%
Greece 3,05 0,86 3,53 0,64 -26,22 47%
Portugal 3 0,86 3,48 0,63 -27,43 46%
Estonia 2,9 0,86 3,36 0,61 -29,85 45%
Chile 2100 627,49 3,35 438,41 -30,13 44%
Mexico 49 14,63 3,35 10,23 -30,07 44%
Colombia 7900 2364,98 3,34 1649,27 -30,26 44%
Peru 10 3,01 3,32 2,09 -30,6 44%
Argentina 28 8,61 3,25 5,85 -32,11 43%
Hungary 860 271,39 3,17 179,54 -33,84 42%
Japan 370 117,77 3,14 77,24 -34,41 42%
Thailand 99 32,61 3,04 20,67 -36,61 40%
98
Saudi Arabia 11 3,76 2,93 2,3 -38,87 39%
Czech Republic 70,45 24,13 2,92 14,71 -39,06 39%
Vietnam 60000 21380 2,81 12526,1 -41,41 37%
China 17,2 6,21 2,77 3,59 -42,19 37%
Sri Lanka 350 131,88 2,65 73,07 -44,59 35%
Venezuela 132 52,1 2,53 27,56 -47,11 34%
Taiwan 79 31,49 2,51 16,49 -47,63 33%
Poland 9,2 3,71 2,48 1,92 -48,18 33%
Hong Kong 18,8 7,75 2,43 3,92 -49,37 32%
Egypt 16,93 7,35 2,3 3,53 -51,91 31%
Indonesia 27939 12480 2,24 5832,78 -53,26 30%
South Africa 25,5 11,48 2,22 5,32 -53,62 29%
Malaysia 7,63 3,62 2,11 1,59 -55,94 28%
India 116,25 61,62 1,89 24,27 -60,61 25%
Russia 89 65,23 1,36 18,58 -71,51 18%
Ukraine 19 15,82 1,2 3,97 -74,93 16%
99
3.
Geographic distance and international relations
Country Distance (km) Shengen Space EU Corrected EU Shengen
PALOP/ Former Colonies
Other
Agreements WTO Not % %-1
Shengen Dist Correct (0.5) EU Dist Correct (0.4) PALOP Dist Correct (0.3) Other Correct (0.3) WTO Penalty (1) DISTANCE
CORRECTED Score Inverse
Spain 400 1 1 0 0 0 0 2% 98% 200 0 0 0 0 200 1% 99%
France 1140 1 1 0 0 0 0 6% 94% 570 0 0 0 0 570 3% 97%
Switzerland 1567 1 0 0 0 0 0 8% 92% 784 0 0 0 0 784 4% 96%
Belgium 1585 1 1 0 0 0 0 8% 92% 793 0 0 0 0 793 4% 96%
Luxembourg 1619 1 1 0 0 0 0 8% 92% 810 0 0 0 0 810 4% 96%
Liechtenstein 1674 1 0 0 0 0 0 8% 92% 837 0 0 0 0 837 4% 96%
Morocco 853 0 0 0 0 0 0 4% 96% 0 0 0 0 0 853 4% 96%
Netherlands 1758 1 1 0 0 0 0 9% 91% 879 0 0 0 0 879 4% 96%
Italy 1773 1 1 0 0 0 0 9% 91% 887 0 0 0 0 887 4% 96%
Ireland 1560 0 1 1 0 0 0 8% 92% 0 624 0 0 0 936 5% 95%
Germany 1953 1 1 0 0 0 0 10% 90% 977 0 0 0 0 977 5% 95%
Malta 2023 1 1 0 0 0 0 10% 90% 1012 0 0 0 0 1012 5% 95%
Slovenia 2031 1 1 0 0 0 0 10% 90% 1016 0 0 0 0 1016 5% 95%
Austria 2040 1 1 0 0 0 0 10% 90% 1020 0 0 0 0 1020 5% 95%
United Kingdom 1814 0 1 1 0 0 0 9% 91% 0 725,6 0 0 0 1088 6% 94%
Czech Republic 2193 1 1 0 0 0 0 11% 89% 1097 0 0 0 0 1097 6% 94%
Denmark 2283 1 1 0 0 0 0 12% 88% 1142 0 0 0 0 1142 6% 94%
Hungary 2392 1 1 0 0 0 0 12% 88% 1196 0 0 0 0 1196 6% 94%
Croatia 2023 0 1 1 0 0 0 10% 90% 0 809,2 0 0 0 1214 6% 94%
Slovakia 2443 1 1 0 0 0 0 12% 88% 1222 0 0 0 0 1222 6% 94%
Poland 2521 1 1 0 0 0 0 13% 87% 1261 0 0 0 0 1261 6% 94%
Greece 2579 1 1 0 0 0 0 13% 87% 1290 0 0 0 0 1290 7% 93%
Norway 2616 1 0 0 0 0 0 13% 87% 1308 0 0 0 0 1308 7% 93%
100
Lithuania 2951 1 1 0 0 0 0 15% 85% 1476 0 0 0 0 1476 7% 93%
Sweden 2967 1 1 0 0 0 0 15% 85% 1484 0 0 0 0 1484 8% 92%
Latvia 3070 1 1 0 0 0 0 16% 84% 1535 0 0 0 0 1535 8% 92%
Estonia 3176 1 1 0 0 0 0 16% 84% 1588 0 0 0 0 1588 8% 92%
Romania 2790 0 1 1 0 0 0 14% 86% 0 1116 0 0 0 1674 8% 92%
Tunisia 1697 0 0 0 0 0 0 9% 91% 0 0 0 0 0 1697 9% 91%
Finland 3395 1 1 0 0 0 0 17% 83% 1698 0 0 0 0 1698 9% 91%
Bulgaria 2834 0 1 1 0 0 0 14% 86% 0 1133,6 0 0 0 1700 9% 91%
Cape Verde 3091 0 0 0 1 0 0 16% 84% 0 0 927,3 0 0 2164 11% 89%
Guinea Bissau 3148 0 0 0 1 0 0 16% 84% 0 0 944,4 0 0 2204 11% 89%
Cyprus 3688 0 1 1 0 0 0 19% 81% 0 1475,2 0 0 0 2213 11% 89%
Turkey 3714 0 0 0 0 1 0 19% 81% 0 0 0 1114,2 0 2600 13% 87%
Israel 3987 0 0 0 0 1 0 20% 80% 0 0 0 1196,1 0 2791 14% 86%
Armenia 4490 0 0 0 0 1 0 23% 77% 0 0 0 1347 0 3143 16% 84%
Ukraine 3274 0 0 0 0 0 0 17% 83% 0 0 0 0 0 3274 17% 83%
Nigeria 3771 0 0 0 0 0 0 19% 81% 0 0 0 0 0 3771 19% 81%
Jordan 4128 0 0 0 0 0 0 21% 79% 0 0 0 0 0 4128 21% 79%
Serbia 2469 0 0 0 0 1 1 13% 87% 0 0 0 740,7 2469 4197 21% 79%
Angola 6248 0 0 0 1 0 0 32% 68% 0 0 1874,4 0 0 4374 22% 78%
Canada 6926 0 0 0 0 1 0 35% 65% 0 0 0 2077,8 0 4848 25% 75%
United States 7326 0 0 0 0 1 0 37% 63% 0 0 0 2197,8 0 5128 26% 74%
Brazil 7495 0 0 0 1 0 0 38% 62% 0 0 2248,5 0 0 5247 27% 73%
Saudi Arabia 5256 0 0 0 0 0 0 27% 73% 0 0 0 0 0 5256 27% 73%
Colombia 7649 0 0 0 0 1 0 39% 61% 0 0 0 2294,7 0 5354 27% 73%
Mozambique 7903 0 0 0 1 0 0 40% 60% 0 0 2370,9 0 0 5532 28% 72%
South Korea 2769 0 0 0 0 0 1 14% 86% 0 0 0 0 2769 5538 28% 72%
Qatar 5695 0 0 0 0 0 0 29% 71% 0 0 0 0 0 5695 29% 71%
101
United Arab Emirates 6038 0 0 0 0 0 0 31% 69% 0 0 0 0 0 6038 31% 69%
Mexico 8728 0 0 0 0 1 0 44% 56% 0 0 0 2618,4 0 6110 31% 69%
China 9168 0 0 0 0 1 0 46% 54% 0 0 0 2750,4 0 6418 33% 67%
Venezuela 6871 0 0 0 0 0 0 35% 65% 0 0 0 0 0 6871 35% 65%
Japan 10946 0 0 0 0 1 0 55% 45% 0 0 0 3283,8 0 7662 39% 61%
Equatorial Guinea 4602 0 0 0 1 0 1 23% 77% 0 0 1380,6 0 4602 7823 40% 60%
Sao Tome and Principe 4619 0 0 0 1 0 1 23% 77% 0 0 1385,7 0 4619 7852 40% 60%
Panama 7919 0 0 0 0 0 0 40% 60% 0 0 0 0 0 7919 40% 60%
South Africa 8429 0 0 0 0 0 0 43% 57% 0 0 0 0 0 8429 43% 57%
Bolivia 8450 0 0 0 0 0 0 43% 57% 0 0 0 0 0 8450 43% 57%
Peru 8739 0 0 0 0 0 0 44% 56% 0 0 0 0 0 8739 44% 56%
Indonesia 12782 0 0 0 0 1 0 65% 35% 0 0 0 3834,6 0 8947 45% 55%
Uruguay 9389 0 0 0 0 0 0 48% 52% 0 0 0 0 0 9389 48% 52%
Thailand 10472 0 0 0 0 0 0 53% 47% 0 0 0 0 0 10472 53% 47%
Chile 10583 0 0 0 0 0 0 54% 46% 0 0 0 0 0 10583 54% 46%
Macao 10894 0 0 0 0 0 0 55% 45% 0 0 0 0 0 10894 55% 45%
Hong Kong 10916 0 0 0 0 0 0 55% 45% 0 0 0 0 0 10916 55% 45%
Malaysia 11430 0 0 0 0 0 0 58% 42% 0 0 0 0 0 11430 58% 42%
Singapore 11795 0 0 0 0 0 0 60% 40% 0 0 0 0 0 11795 60% 40%
Philippines 12250 0 0 0 0 0 0 62% 38% 0 0 0 0 0 12250 62% 38%
Russia 7319 0 0 0 0 0 1 37% 63% 0 0 0 0 7319 14638 74% 26%
Australia 16169 0 0 0 0 0 0 82% 18% 0 0 0 0 0 16169 82% 18%
New Zealand 19725 0 0 0 0 0 0 100% 0% 0 0 0 0 0 19725 100% 0%
102
4.
GDP annual growth rate
Country Name GDP growth (%) Score
South Sudan 36,17 100%
Turkmenistan 10,30 28%
Ethiopia 9,94 27%
Congo, Dem. Rep. 9,05 25%
Cote d'Ivoire 9,00 25%
Myanmar 8,50 24%
Uzbekistan 8,10 22%
Palau 7,95 22%
Mongolia 7,82 22%
Maldives 7,56 21%
Lao PDR 7,46 21%
India 7,42 21%
Mozambique 7,37 20%
Sri Lanka 7,37 20%
China 7,35 20%
Dominican Republic 7,34 20%
Chad 7,30 20%
Mali 7,22 20%
Cambodia 7,03 19%
Sierra Leone 6,98 19%
Tanzania 6,97 19%
Rwanda 6,96 19%
Niger 6,90 19%
Tajikistan 6,70 19%
Timor-Leste 6,66 18%
Congo, Rep. 6,55 18%
Mauritania 6,42 18%
St. Kitts and Nevis 6,34 18%
Nigeria 6,31 17%
Bhutan 6,26 17%
Panama 6,16 17%
Qatar 6,15 17%
Bangladesh 6,12 17%
Philippines 6,10 17%
Malaysia 6,03 17%
Zambia 6,00 17%
Vietnam 5,98 17%
Cameroon 5,89 16%
Togo 5,71 16%
Malawi 5,70 16%
Djibouti 5,50 15%
Nepal 5,48 15%
Pakistan 5,41 15%
Bolivia 5,40 15%
Benin 5,37 15%
103
Brunei Darussalam 5,30 15%
Indonesia 5,02 14%
Ireland 4,79 13%
Georgia 4,77 13%
Nicaragua 4,70 13%
Burundi 4,66 13%
Moldova 4,60 13%
Colombia 4,55 13%
Uganda 4,51 12%
Bahrain 4,51 12%
Namibia 4,48 12%
Botswana 4,42 12%
Paraguay 4,35 12%
Gabon 4,30 12%
Kazakhstan 4,30 12%
Guatemala 4,24 12%
Sao Tome and Principe 4,23 12%
Ghana 4,18 12%
Algeria 4,10 11%
Burkina Faso 4,05 11%
Senegal 3,92 11%
Angola 3,90 11%
Guyana 3,83 11%
Ecuador 3,80 11%
Fiji 3,80 11%
Macedonia, FYR 3,77 10%
Hungary 3,64 10%
United Arab Emirates 3,61 10%
Kyrgyz Republic 3,60 10%
Mauritius 3,60 10%
Costa Rica 3,50 10%
Uruguay 3,50 10%
Honduras 3,48 10%
Saudi Arabia 3,47 10%
Armenia 3,40 9%
Poland 3,37 9%
Korea, Rep. 3,31 9%
Antigua and Barbuda 3,22 9%
Zimbabwe 3,17 9%
Jordan 3,10 9%
Sudan 3,08 9%
Kiribati 3,03 8%
Comoros 3,00 8%
104
5.
Trading Across Borders
Country Rate Score
Singapore 1 100%
Hong Kong SAR, China 2 99%
Korea, Rep. 3 98%
Sweden 4 97%
Ireland 5 96%
Estonia 6 95%
Denmark 7 94%
United Arab Emirates 8 93%
Panama 9 92%
France 10 91%
Malaysia 11 90%
Israel 12 89%
Netherlands 13 88%
Finland 14 87%
United Kingdom 15 86%
United States * 16 85%
Mauritius 17 84%
Germany 18 83%
Austria 19 82%
Japan * 20 81%
Lithuania 21 80%
Switzerland 22 79%
Canada 23 78%
Norway 24 77%
Dominican Republic 24 77%
Belgium 26 75%
New Zealand 27 74%
Latvia 28 73%
Portugal 29 72%
Spain 30 71%
Morocco 31 70%
Taiwan, China 32 69%
Georgia 33 68%
Cyprus 34 67%
Luxembourg 35 66%
Thailand 36 65%
Italy 37 64%
Barbados 38 63%
Iceland 39 62%
Chile 40 61%
Poland 41 60%
Seychelles 42 59%
Malta 43 58%
Mexico 44 57%
St. Vincent and the Grenadines 45 56%
105
Costa Rica 47 54%
Greece 48 53%
Australia 49 52%
Tunisia 50 51%
Grenada 51 50%
Montenegro 52 49%
Slovenia 53 48%
Jordan 54 47%
Peru 55 46%
Djibouti 56 45%
Bulgaria 57 44%
Czech Republic 58 43%
San Marino 59 42%
Oman 60 41%
Qatar 61 40%
Indonesia 62 39%
Bahamas, The 63 38%
Bahrain 64 37%
Romania 65 36%
Philippines 65 36%
St. Kitts and Nevis 67 34%
Marshall Islands 68 33%
Sri Lanka 69 32%
Honduras 70 31%
Slovak Republic 71 30%
Hungary 72 29%
El Salvador 73 28%
Nicaragua 74 27%
Vietnam 75 26%
Trinidad and Tobago 76 25%
Gambia, The 77 24%
Tonga 78 23%
Senegal 79 22%
Samoa 80 21%
Kiribati 81 20%
Guyana 82 19%
Uruguay 83 18%
Puerto Rico 84 17%
Macedonia 85 16%
Croatia 86 15%
Solomon Islands 87 14%
Dominica 88 13%
Antigua and Barbuda 89 12%
106
6.
Country risk
Country Risk Score Inverse score
Liechtenstein 11 13,75% 86%
Hong Kong 12 15,00% 85%
Australia 13 16,25% 84%
Singapore 13 16,25% 84%
Austria 14 17,50% 83%
New Zealand 14 17,50% 83%
Switzerland 14 17,50% 83%
Canada 15 18,75% 81%
Norway 15 18,75% 81%
Sweden 15 18,75% 81%
Finland 16 20,00% 80%
Luxembourg 17 21,25% 79%
Denmark 18 22,50% 78%
Netherlands 19 23,75% 76%
United States 19 23,75% 76%
United Kingdom 20 25,00% 75%
Germany 21 26,25% 74%
Taiwan 21 26,25% 74%
Chile 22 27,50% 73%
France 23 28,75% 71%
Ireland 23 28,75% 71%
Japan 23 28,75% 71%
Belgium 25 31,25% 69%
Estonia 25 31,25% 69%
Iceland 26 32,50% 68%
Malta 26 32,50% 68%
Slovenia 26 32,50% 68%
Lithuania 27 33,75% 66%
Macau 27 33,75% 66%
Spain 27 33,75% 66%
Czech Republic 29 36,25% 64%
Latvia 29 36,25% 64%
Qatar 29 36,25% 64%
Israel 30 37,50% 63%
Poland 30 37,50% 63%
Slovakia 30 37,50% 63%
Malaysia 31 38,75% 61%
United Arab Emirates 31 38,75% 61%
Cyprus 32 40,00% 60%
Hungary 32 40,00% 60%
Panama 33 41,25% 59%
South Korea 33 41,25% 59%
107
Romania 36 45,00% 55%
Bulgaria 37 46,25% 54%
Croatia 38 47,50% 53%
Cabo Verde 39 48,75% 51%
Saudi Arabia 40 50,00% 50%
Colombia 43 53,75% 46%
Jordan 43 53,75% 46%
Peru 43 53,75% 46%
Serbia 43 53,75% 46%
South Africa 43 53,75% 46%
Uruguay 43 53,75% 46%
China 44 55,00% 45%
Mexico 44 55,00% 45%
Brazil 49 61,25% 39%
Morocco 49 61,25% 39%
Philippines 49 61,25% 39%
Thailand 49 61,25% 39%
Turkey 49 61,25% 39%
Armenia 50 62,50% 38%
India 50 62,50% 38%
Indonesia 50 62,50% 38%
Greece 52 65,00% 35%
Timor Leste 53 66,25% 34%
Mozambique 54 67,50% 33%
Sao Tome e Principe 55 68,75% 31%
Bolivia 58 72,50% 28%
Tunisia 59 73,75% 26%
Russia 60 75,00% 25%
Angola 62 77,50% 23%
Equatorial Guinea 62 77,50% 23%
Argentina 64 80,00% 20%
Ukraine 65 81,25% 19%
Nigeria 71 88,75% 11%
Guinea Bissau 77 96,25% 4%
Venezuela 80 100,00% 0%
108
7.
Market Size
Country Market size (M€) Score
China 84 143,90 100,00%
United States 56 408,40 67,04%
India 35 650,80 42,37%
Japan 7 531,90 8,95%
Hong Kong 7 341,90 8,73%
Canada 5 226,80 6,21%
Russia 4 923,50 5,85%
United Kingdom 4 352,00 5,17%
Germany 3 830,50 4,55%
Taiwan 3 730,20 4,43%
Italy 3 721,70 4,42%
Turkey 3 630,70 4,31%
South Korea 3 525,70 4,19%
France 3 422,20 4,07%
Brazil 2 997,00 3,56%
Australia 2 792,90 3,32%
United Arab Emirates 2 460,80 2,92%
Singapore 2 030,40 2,41%
Thailand 1 955,40 2,32%
Spain 1 603,60 1,91%
Mexico 1 520,80 1,81%
Malaysia 1 462,00 1,74%
Switzerland 1 350,10 1,60%
Indonesia 1 096,90 1,30%
Netherlands 855,00 1,02%
Poland 593,20 0,70%
Philippines 580,20 0,69%
Sweden 425,60 0,51%
Ukraine 355,70 0,42%
South Africa 297,10 0,35%
Romania 296,70 0,35%
Argentina 129,90 0,15%
109
8.
Consumer Expenditure
Country Consumer expenditure (M€) Score
China 103 824,60 100,00%
United States 84 619,00 81,50%
India 16 804,70 16,19%
United Kingdom 16 558,10 15,95%
Japan 14 639,80 14,10%
Germany 13 481,80 12,99%
Russia 11 004,00 10,60%
France 8 766,70 8,44%
Italy 8 766,70 8,44%
Turkey 8 085,10 7,79%
Saudi Arabia 6 517,60 6,28%
Mexico 5 383,90 5,19%
Canada 4 931,20 4,75%
Australia 4 889,00 4,71%
Thailand 4 127,10 3,98%
Spain 3 339,30 3,22%
Argentina 2 952,10 2,84%
South Korea 2 830,00 2,73%
Poland 2 491,10 2,40%
Netherlands 2 480,30 2,39%
Philippines 2 411,50 2,32%
Switzerland 2 339,80 2,25%
Malaysia 2 131,20 2,05%
Brazil 2 031,50 1,96%
Austria 1 894,30 1,82%
Singapore 1 834,40 1,77%
Hong Kong 1 799,90 1,73%
Colombia 1 794,40 1,73%
Israel 1 431,00 1,38%
Indonesia 1 407,00 1,36%
Chile 1 187,90 1,14%
Sweden 1 164,30 1,12%
Nigeria 1 053,30 1,01%
United Arab Emirates 1 035,90 1,00%
Taiwan 1 014,80 0,98%
Norway 970,60 0,93%
Belgium 899,80 0,87%
Denmark 737,50 0,71%
Greece 736,00 0,71%
New Zealand 692,50 0,67%
Ukraine 672,50 0,65%
Finland 638,10 0,61%
110
South Africa 507,90 0,49%
Romania 473,00 0,46%
Czech Republic 365,10 0,35%
Qatar 302,30 0,29%
Venezuela 298,30 0,29%
Peru 277,90 0,27%
Hungary 261,00 0,25%
Lithuania 251,40 0,24%
Slovakia 227,80 0,22%
Morocco 209,30 0,20%
Jordan 188,50 0,18%
Bulgaria 145,80 0,14%
Serbia 116,30 0,11%
Tunisia 113,30 0,11%
Slovenia 93,10 0,09%
Latvia 79,50 0,08%
Estonia 68,80 0,07%
Croatia 66,30 0,06%
Bolivia 49,20 0,05%
Uruguay 16,70 0,02%
B)
Macro Score
Country GDP per capita,
PPP Weight Big Mac Index Weight International Relations Weight
GDP growth
rate Weight
Trading across
borders Weight Country risk Weight Macro Score
Switzerland 40% 16,5 100% 16,5 96% 21 0% 21 79% 12,5 83% 12,5 63%
Norway 44% 16,5 84% 16,5 93% 21 0% 21 77% 12,5 81% 12,5 61%
Denmark 31% 16,5 71% 16,5 94% 21 0% 21 94% 12,5 78% 12,5 58%
Ireland 33% 16,5 54% 16,5 95% 21 13% 21 96% 12,5 71% 12,5 58%
Sweden 31% 16,5 66% 16,5 92% 21 0% 21 97% 12,5 81% 12,5 58%
France 27% 16,5 60% 16,5 97% 21 0% 21 91% 12,5 71% 12,5 55%
Finland 27% 16,5 63% 16,5 91% 21 0% 21 87% 12,5 80% 12,5 55%
Netherlands 32% 16,5 53% 16,5 96% 21 0% 21 88% 12,5 76% 12,5 55%
Austria 32% 16,5 52% 16,5 95% 21 0% 21 82% 12,5 83% 12,5 54%
Germany 31% 16,5 56% 16,5 95% 21 0% 21 83% 12,5 74% 12,5 54%
Belgium 29% 16,5 57% 16,5 96% 21 0% 21 75% 12,5 69% 12,5 52%
Spain 23% 16,5 56% 16,5 99% 21 0% 21 71% 12,5 66% 12,5 51%
Canada 30% 16,5 62% 16,5 75% 21 0% 21 78% 12,5 81% 12,5 51%
Israel 23% 16,5 59% 16,5 86% 21 0% 21 89% 12,5 63% 12,5 50%
Estonia 18% 16,5 45% 16,5 92% 21 0% 21 95% 12,5 69% 12,5 50%
Italy 24% 16,5 59% 16,5 96% 21 0% 21 64% 12,5 56% 12,5 49%
Singapore 57% 16,5 47% 16,5 40% 21 0% 21 100% 12,5 84% 12,5 48%
Luxembourg 62% 16,5 0% 16,5 96% 21 0% 21 66% 12,5 79% 12,5 48%
Qatar 100% 16,5 0% 16,5 71% 21 17% 21 40% 12,5 64% 12,5 48%
Poland 17% 16,5 33% 16,5 94% 21 9% 21 60% 12,5 63% 12,5 45%
United Kingdom 27% 16,5 0% 16,5 94% 21 0% 21 86% 12,5 75% 12,5 44%
United Arab Emirates 45% 16,5 0% 16,5 69% 21 10% 21 93% 12,5 61% 12,5 43%
Czech Republic 21% 16,5 39% 16,5 94% 21 0% 21 43% 12,5 64% 12,5 43%
Hungary 17% 16,5 42% 16,5 94% 21 10% 21 29% 12,5 60% 12,5 43%
112
Lithuania 18% 16,5 0% 16,5 93% 21 0% 21 80% 12,5 66% 12,5 41%
Iceland 30% 16,5 0% 16,5 93% 21 0% 21 62% 12,5 68% 12,5 41%
Latvia 16% 16,5 0% 16,5 92% 21 0% 21 73% 12,5 64% 12,5 39%
Malta 21% 16,5 0% 16,5 95% 21 0% 21 58% 12,5 68% 12,5 39%
Malaysia 17% 16,5 28% 16,5 42% 21 17% 21 90% 12,5 61% 12,5 39%
Cyprus 21% 16,5 0% 16,5 89% 21 0% 21 67% 12,5 60% 12,5 38%
Slovenia 20% 16,5 0% 16,5 95% 21 0% 21 48% 12,5 68% 12,5 38%
Panama 14% 16,5 0% 16,5 60% 21 17% 21 92% 12,5 59% 12,5 37%
Greece 18% 16,5 47% 16,5 93% 21 0% 21 53% 12,5 0% 12,5 37%
Chile 15% 16,5 44% 16,5 46% 21 0% 21 61% 12,5 73% 12,5 36%
Saudi Arabia 36% 16,5 39% 16,5 73% 21 10% 21 0% 12,5 50% 12,5 36%
Australia 30% 16,5 57% 16,5 18% 21 0% 21 52% 12,5 84% 12,5 35%
Turkey 13% 16,5 53% 16,5 87% 21 0% 21 0% 12,5 39% 12,5 34%
Morocco 0% 16,5 0% 16,5 96% 21 0% 21 70% 12,5 39% 12,5 34%
New Zealand 26% 16,5 60% 16,5 0% 21 0% 21 74% 12,5 83% 12,5 34%
Uruguay 14% 16,5 61% 16,5 52% 21 10% 21 18% 12,5 46% 12,5 34%
Brazil 11% 16,5 69% 16,5 73% 21 0% 21 0% 12,5 39% 12,5 33%
Bulgaria 11% 16,5 0% 16,5 91% 21 0% 21 44% 12,5 54% 12,5 33%
Romania 13% 16,5 0% 16,5 92% 21 0% 21 36% 12,5 55% 12,5 33%
Japan 25% 16,5 42% 16,5 61% 21 0% 21 0% 12,5 71% 12,5 33%
Colombia 9% 16,5 44% 16,5 73% 21 13% 21 0% 12,5 46% 12,5 33%
Peru 8% 16,5 44% 16,5 56% 21 0% 21 46% 12,5 46% 12,5 32%
China 9% 16,5 37% 16,5 67% 21 20% 21 0% 12,5 45% 12,5 32%
Jordan 8% 16,5 0% 16,5 79% 21 9% 21 47% 12,5 46% 12,5 31%
Thailand 10% 16,5 40% 16,5 47% 21 0% 21 65% 12,5 39% 12,5 31%
Liechtenstein 0% 16,5 0% 16,5 96% 21 0% 21 0% 12,5 86% 12,5 31%
Croatia 15% 16,5 0% 16,5 94% 21 0% 21 15% 12,5 53% 12,5 31%
Tunisia 8% 16,5 0% 16,5 91% 21 0% 21 51% 12,5 26% 12,5 30%
113
Philippines 0% 16,5 49% 16,5 38% 21 17% 21 36% 12,5 39% 12,5 29%
Indonesia 0% 16,5 30% 16,5 55% 21 14% 21 39% 12,5 38% 12,5 29%
India 0% 16,5 25% 16,5 70% 21 21% 21 0% 12,5 38% 12,5 28%
Armenia 0% 16,5 0% 16,5 84% 21 9% 21 0% 12,5 38% 12,5 24%
South Africa 9% 16,5 29% 16,5 57% 21 0% 21 0% 12,5 46% 12,5 24%
Serbia 9% 16,5 0% 16,5 79% 21 0% 21 0% 12,5 46% 12,5 24%
Mozambique 0% 16,5 0% 16,5 72% 21 20% 21 0% 12,5 33% 12,5 23%
Ukraine 0% 16,5 16% 16,5 83% 21 0% 21 0% 12,5 19% 12,5 22%
Nigeria 0% 16,5 0% 16,5 81% 21 17% 21 0% 12,5 11% 12,5 22%
Angola 0% 16,5 0% 16,5 78% 21 11% 21 0% 12,5 23% 12,5 21%
South Sudan 0% 16,5 0% 16,5 0% 21 100% 21 0% 12,5 0% 12,5 21%
Portugal 19% 16,5 46% 16,5 0% 21 0% 21 72% 12,5 0% 12,5 20%
Costa Rica 10% 16,5 53% 16,5 0% 21 10% 21 54% 12,5 0% 12,5 19%
Equatorial Guinea 21% 16,5 0% 16,5 60% 21 0% 21 0% 12,5 23% 12,5 19%
Brunei Darussalam 53% 16,5 0% 16,5 0% 21 15% 21 55% 12,5 0% 12,5 19%
Hong Kong SAR, China 38% 16,5 0% 16,5 0% 21 0% 21 99% 12,5 0% 12,5 19%
Bolivia 0% 16,5 0% 16,5 57% 21 15% 21 0% 12,5 28% 12,5 19%
Korea, Rep. 24% 16,5 0% 16,5 0% 21 9% 21 98% 12,5 0% 12,5 18%
Macao SAR, China 96% 16,5 0% 16,5 0% 21 0% 21 0% 12,5 0% 12,5 16%
Dominican Republic 9% 16,5 0% 16,5 0% 21 20% 21 77% 12,5 0% 12,5 15%
Mauritius 13% 16,5 0% 16,5 0% 21 10% 21 84% 12,5 0% 12,5 15%
Sri Lanka 0% 16,5 35% 16,5 0% 21 20% 21 32% 12,5 0% 12,5 14%
Vietnam 0% 16,5 37% 16,5 0% 21 17% 21 26% 12,5 0% 12,5 13%
Bahrain 31% 16,5 0% 16,5 0% 21 12% 21 37% 12,5 0% 12,5 12%
Georgia 0% 16,5 0% 16,5 0% 21 13% 21 68% 12,5 0% 12,5 11%
St. Kitts and Nevis 16% 16,5 0% 16,5 0% 21 18% 21 34% 12,5 0% 12,5 10%
Seychelles 18% 16,5 0% 16,5 0% 21 0% 21 59% 12,5 0% 12,5 10%
Pakistan 0% 16,5 40% 16,5 0% 21 15% 21 0% 12,5 0% 12,5 10%
114
Oman 26% 16,5 0% 16,5 0% 21 0% 21 41% 12,5 0% 12,5 9%
Barbados 9% 16,5 0% 16,5 0% 21 0% 21 63% 12,5 0% 12,5 9%
Djibouti 0% 16,5 0% 16,5 0% 21 15% 21 45% 12,5 0% 12,5 9%
Taiwan, China 0% 16,5 0% 16,5 0% 21 0% 21 69% 12,5 0% 12,5 9%
Kuwait 52% 16,5 0% 16,5 0% 21 0% 21 0% 12,5 0% 12,5 9%
Montenegro 10% 16,5 0% 16,5 0% 21 0% 21 49% 12,5 0% 12,5 8%
Turkmenistan 11% 16,5 0% 16,5 0% 21 28% 21 0% 12,5 0% 12,5 8%
Grenada 8% 16,5 0% 16,5 0% 21 0% 21 50% 12,5 0% 12,5 8%
Bahamas, The 16% 16,5 0% 16,5 0% 21 0% 21 38% 12,5 0% 12,5 7%
St. Vincent and the
Grenadines 0% 16,5 0% 16,5 0% 21 0% 21 56% 12,5 0% 12,5 7%
Slovak Republic 19% 16,5 0% 16,5 0% 21 0% 21 30% 12,5 0% 12,5 7%
Trinidad and Tobago 21% 16,5 0% 16,5 0% 21 0% 21 25% 12,5 0% 12,5 7%
Cabo Verde 0% 16,5 0% 16,5 0% 21 0% 21 0% 12,5 51% 12,5 6%
Palau 10% 16,5 0% 16,5 0% 21 22% 21 0% 12,5 0% 12,5 6%
Puerto Rico 24% 16,5 0% 16,5 0% 21 0% 21 17% 12,5 0% 12,5 6%
Nicaragua 0% 16,5 0% 16,5 0% 21 13% 21 27% 12,5 0% 12,5 6%
Maldives 10% 16,5 0% 16,5 0% 21 21% 21 0% 12,5 0% 12,5 6%
Honduras 0% 16,5 0% 16,5 0% 21 10% 21 31% 12,5 0% 12,5 6%
Mongolia 8% 16,5 0% 16,5 0% 21 22% 21 0% 12,5 0% 12,5 6%
Antigua and Barbuda 15% 16,5 0% 16,5 0% 21 9% 21 12% 12,5 0% 12,5 6%
Bermuda 35% 16,5 0% 16,5 0% 21 0% 21 0% 12,5 0% 12,5 6%
Ethiopia 0% 16,5 0% 16,5 0% 21 27% 21 0% 12,5 0% 12,5 6%
Congo, Dem. Rep. 0% 16,5 0% 16,5 0% 21 25% 21 0% 12,5 0% 12,5 5%
San Marino 0% 16,5 0% 16,5 0% 21 0% 21 42% 12,5 0% 12,5 5%
Kazakhstan 17% 16,5 0% 16,5 0% 21 12% 21 0% 12,5 0% 12,5 5%
Senegal 0% 16,5 0% 16,5 0% 21 11% 21 22% 12,5 0% 12,5 5%
Myanmar 0% 16,5 0% 16,5 0% 21 24% 21 0% 12,5 0% 12,5 5%
115
Gabon 13% 16,5 0% 16,5 0% 21 12% 21 0% 12,5 0% 12,5 5%
Guyana 0% 16,5 0% 16,5 0% 21 11% 21 19% 12,5 0% 12,5 5%
Botswana 11% 16,5 0% 16,5 0% 21 12% 21 0% 12,5 0% 12,5 4%
Lao PDR 0% 16,5 0% 16,5 0% 21 21% 21 0% 12,5 0% 12,5 4%
Kiribati 0% 16,5 0% 16,5 0% 21 8% 21 20% 12,5 0% 12,5 4%
Chad 0% 16,5 0% 16,5 0% 21 20% 21 0% 12,5 0% 12,5 4%
Mali 0% 16,5 0% 16,5 0% 21 20% 21 0% 12,5 0% 12,5 4%
Marshall Islands 0% 16,5 0% 16,5 0% 21 0% 21 33% 12,5 0% 12,5 4%
Cambodia 0% 16,5 0% 16,5 0% 21 19% 21 0% 12,5 0% 12,5 4%
Sierra Leone 0% 16,5 0% 16,5 0% 21 19% 21 0% 12,5 0% 12,5 4%
Tanzania 0% 16,5 0% 16,5 0% 21 19% 21 0% 12,5 0% 12,5 4%
Rwanda 0% 16,5 0% 16,5 0% 21 19% 21 0% 12,5 0% 12,5 4%
Niger 0% 16,5 0% 16,5 0% 21 19% 21 0% 12,5 0% 12,5 4%
Algeria 10% 16,5 0% 16,5 0% 21 11% 21 0% 12,5 0% 12,5 4%
Tajikistan 0% 16,5 0% 16,5 0% 21 19% 21 0% 12,5 0% 12,5 4%
Timor-Leste 0% 16,5 0% 16,5 0% 21 18% 21 0% 12,5 0% 12,5 4%
Congo, Rep. 0% 16,5 0% 16,5 0% 21 18% 21 0% 12,5 0% 12,5 4%
Mauritania 0% 16,5 0% 16,5 0% 21 18% 21 0% 12,5 0% 12,5 4%
Macedonia, FYR 9% 16,5 0% 16,5 0% 21 10% 21 0% 12,5 0% 12,5 4%
Bhutan 0% 16,5 0% 16,5 0% 21 17% 21 0% 12,5 0% 12,5 4%
Bangladesh 0% 16,5 0% 16,5 0% 21 17% 21 0% 12,5 0% 12,5 4%
El Salvador 0% 16,5 0% 16,5 0% 21 0% 21 28% 12,5 0% 12,5 4%
Ecuador 8% 16,5 0% 16,5 0% 21 11% 21 0% 12,5 0% 12,5 3%
Zambia 0% 16,5 0% 16,5 0% 21 17% 21 0% 12,5 0% 12,5 3%
Cameroon 0% 16,5 0% 16,5 0% 21 16% 21 0% 12,5 0% 12,5 3%
Togo 0% 16,5 0% 16,5 0% 21 16% 21 0% 12,5 0% 12,5 3%
Malawi 0% 16,5 0% 16,5 0% 21 16% 21 0% 12,5 0% 12,5 3%
Nepal 0% 16,5 0% 16,5 0% 21 15% 21 0% 12,5 0% 12,5 3%
116
Kenya 0% 16,5 0% 16,5 0% 21 15% 21 0% 12,5 0% 12,5 3%
Gambia, The 0% 16,5 0% 16,5 0% 21 0% 21 24% 12,5 0% 12,5 3%
Russian Federation 18% 16,5 0% 16,5 0% 21 0% 21 0% 12,5 0% 12,5 3%
Tonga 0% 16,5 0% 16,5 0% 21 0% 21 23% 12,5 0% 12,5 3%
Burundi 0% 16,5 0% 16,5 0% 21 13% 21 0% 12,5 0% 12,5 3%
Moldova 0% 16,5 0% 16,5 0% 21 13% 21 0% 12,5 0% 12,5 3%
Samoa 0% 16,5 0% 16,5 0% 21 0% 21 21% 12,5 0% 12,5 3%
Uganda 0% 16,5 0% 16,5 0% 21 12% 21 0% 12,5 0% 12,5 3%
Namibia 0% 16,5 0% 16,5 0% 21 12% 21 0% 12,5 0% 12,5 3%
Paraguay 0% 16,5 0% 16,5 0% 21 12% 21 0% 12,5 0% 12,5 3%
Guatemala 0% 16,5 0% 16,5 0% 21 12% 21 0% 12,5 0% 12,5 2%
Ghana 0% 16,5 0% 16,5 0% 21 12% 21 0% 12,5 0% 12,5 2%
Cuba 15% 16,5 0% 16,5 0% 21 0% 21 0% 12,5 0% 12,5 2%
Burkina Faso 0% 16,5 0% 16,5 0% 21 11% 21 0% 12,5 0% 12,5 2%
Fiji 0% 16,5 0% 16,5 0% 21 11% 21 0% 12,5 0% 12,5 2%
Kyrgyz Republic 0% 16,5 0% 16,5 0% 21 10% 21 0% 12,5 0% 12,5 2%
Belarus 12% 16,5 0% 16,5 0% 21 0% 21 0% 12,5 0% 12,5 2%
Venezuela, RB 12% 16,5 0% 16,5 0% 21 0% 21 0% 12,5 0% 12,5 2%
Azerbaijan 12% 16,5 0% 16,5 0% 21 0% 21 0% 12,5 0% 12,5 2%
Lebanon 12% 16,5 0% 16,5 0% 21 0% 21 0% 12,5 0% 12,5 2%
Suriname 11% 16,5 0% 16,5 0% 21 0% 21 0% 12,5 0% 12,5 2%
Iran, Islamic Rep. 11% 16,5 0% 16,5 0% 21 0% 21 0% 12,5 0% 12,5 2%
Zimbabwe 0% 16,5 0% 16,5 0% 21 9% 21 0% 12,5 0% 12,5 2%
Sudan 0% 16,5 0% 16,5 0% 21 9% 21 0% 12,5 0% 12,5 2%
Libya 11% 16,5 0% 16,5 0% 21 0% 21 0% 12,5 0% 12,5 2%
Solomon Islands 0% 16,5 0% 16,5 0% 21 0% 21 14% 12,5 0% 12,5 2%
Comoros 0% 16,5 0% 16,5 0% 21 8% 21 0% 12,5 0% 12,5 2%
Iraq 10% 16,5 0% 16,5 0% 21 0% 21 0% 12,5 0% 12,5 2%
117
Afghanistan 0% 16,5 0% 16,5 0% 21 0% 21 0% 12,5 0% 12,5 0%
Albania 0% 16,5 0% 16,5 0% 21 0% 21 0% 12,5 0% 12,5 0%
American Samoa 0% 16,5 0% 16,5 0% 21 0% 21 0% 12,5 0% 12,5 0%
Andorra 0% 16,5 0% 16,5 0% 21 0% 21 0% 12,5 0% 12,5 0%
Aruba 0% 16,5 0% 16,5 0% 21 0% 21 0% 12,5 0% 12,5 0%
Belize 0% 16,5 0% 16,5 0% 21 0% 21 0% 12,5 0% 12,5 0%
Bosnia and Herzegovina 0% 16,5 0% 16,5 0% 21 0% 21 0% 12,5 0% 12,5 0%
Cayman Islands 0% 16,5 0% 16,5 0% 21 0% 21 0% 12,5 0% 12,5 0%
Central African Republic 0% 16,5 0% 16,5 0% 21 0% 21 0% 12,5 0% 12,5 0%
Channel Islands 0% 16,5 0% 16,5 0% 21 0% 21 0% 12,5 0% 12,5 0%
Côte d'Ivoire 0% 16,5 0% 16,5 0% 21 0% 21 0% 12,5 0% 12,5 0%
Curaçao 0% 16,5 0% 16,5 0% 21 0% 21 0% 12,5 0% 12,5 0%
Egypt, Arab Rep. 0% 16,5 0% 16,5 0% 21 0% 21 0% 12,5 0% 12,5 0%
Eritrea 0% 16,5 0% 16,5 0% 21 0% 21 0% 12,5 0% 12,5 0%
Faeroe Islands 0% 16,5 0% 16,5 0% 21 0% 21 0% 12,5 0% 12,5 0%
French Polynesia 0% 16,5 0% 16,5 0% 21 0% 21 0% 12,5 0% 12,5 0%
Greenland 0% 16,5 0% 16,5 0% 21 0% 21 0% 12,5 0% 12,5 0%
Guam 0% 16,5 0% 16,5 0% 21 0% 21 0% 12,5 0% 12,5 0%
Guinea 0% 16,5 0% 16,5 0% 21 0% 21 0% 12,5 0% 12,5 0%
Guinea-Bissau 0% 16,5 0% 16,5 0% 21 0% 21 0% 12,5 0% 12,5 0%
Haiti 0% 16,5 0% 16,5 0% 21 0% 21 0% 12,5 0% 12,5 0%
Isle of Man 0% 16,5 0% 16,5 0% 21 0% 21 0% 12,5 0% 12,5 0%
Jamaica 0% 16,5 0% 16,5 0% 21 0% 21 0% 12,5 0% 12,5 0%
Korea, Dem. Rep. 0% 16,5 0% 16,5 0% 21 0% 21 0% 12,5 0% 12,5 0%
Kosovo 0% 16,5 0% 16,5 0% 21 0% 21 0% 12,5 0% 12,5 0%
Lesotho 0% 16,5 0% 16,5 0% 21 0% 21 0% 12,5 0% 12,5 0%
Liberia 0% 16,5 0% 16,5 0% 21 0% 21 0% 12,5 0% 12,5 0%
Madagascar 0% 16,5 0% 16,5 0% 21 0% 21 0% 12,5 0% 12,5 0%
118
Monaco 0% 16,5 0% 16,5 0% 21 0% 21 0% 12,5 0% 12,5 0%
New Caledonia 0% 16,5 0% 16,5 0% 21 0% 21 0% 12,5 0% 12,5 0%
Northern Mariana Islands 0% 16,5 0% 16,5 0% 21 0% 21 0% 12,5 0% 12,5 0%
Papua New Guinea 0% 16,5 0% 16,5 0% 21 0% 21 0% 12,5 0% 12,5 0%
São Tomé and Principe 0% 16,5 0% 16,5 0% 21 0% 21 0% 12,5 0% 12,5 0%
Sint Maarten (Dutch part) 0% 16,5 0% 16,5 0% 21 0% 21 0% 12,5 0% 12,5 0%
Somalia 0% 16,5 0% 16,5 0% 21 0% 21 0% 12,5 0% 12,5 0%
St. Lucia 0% 16,5 0% 16,5 0% 21 0% 21 0% 12,5 0% 12,5 0%
St. Martin (French part) 0% 16,5 0% 16,5 0% 21 0% 21 0% 12,5 0% 12,5 0%
Swaziland 0% 16,5 0% 16,5 0% 21 0% 21 0% 12,5 0% 12,5 0%
Syrian Arab Republic 0% 16,5 0% 16,5 0% 21 0% 21 0% 12,5 0% 12,5 0%
Turks and Caicos Islands 0% 16,5 0% 16,5 0% 21 0% 21 0% 12,5 0% 12,5 0%
Tuvalu 0% 16,5 0% 16,5 0% 21 0% 21 0% 12,5 0% 12,5 0%
Vanuatu 0% 16,5 0% 16,5 0% 21 0% 21 0% 12,5 0% 12,5 0%
Virgin Islands (U.S.) 0% 16,5 0% 16,5 0% 21 0% 21 0% 12,5 0% 12,5 0%
West Bank and Gaza 0% 16,5 0% 16,5 0% 21 0% 21 0% 12,5 0% 12,5 0%
119
C)
Final Score
Country Macro score Weight Market Size Weight Expenditure Consumer Weight Final Score
China 32% 60% 100,00% 20% 100,00% 20% 59%
United States 42% 60% 67,04% 20% 81,50% 20% 55%
Switzerland 63% 60% 1,60% 20% 2,25% 20% 39%
Norway 61% 60% 0,00% 20% 0,93% 20% 36%
Germany 54% 60% 4,55% 20% 12,99% 20% 36%
France 55% 60% 4,07% 20% 8,44% 20% 35%
Denmark 58% 60% 0,00% 20% 0,71% 20% 35%
Sweden 58% 60% 0,51% 20% 1,12% 20% 35%
Ireland 58% 60% 0,00% 20% 0,54% 20% 35%
Netherlands 55% 60% 1,02% 20% 2,39% 20% 33%
Finland 55% 60% 0,00% 20% 0,61% 20% 33%
Austria 54% 60% 0,00% 20% 1,82% 20% 33%
Canada 51% 60% 6,21% 20% 4,75% 20% 33%
Italy 49% 60% 4,42% 20% 8,44% 20% 32%
Spain 51% 60% 1,91% 20% 3,22% 20% 32%
Belgium 52% 60% 0,00% 20% 0,87% 20% 32%
United Kingdom 44% 60% 5,17% 20% 15,95% 20% 31%
Israel 50% 60% 0,00% 20% 1,38% 20% 31%
Estonia 50% 60% 0,00% 20% 0,07% 20% 30%
Singapore 48% 60% 2,41% 20% 1,77% 20% 30%
Luxembourg 48% 60% 0,00% 20% 0,00% 20% 29%
Qatar 48% 60% 0,00% 20% 0,29% 20% 29%
India 28% 60% 42,37% 20% 16,19% 20% 28%
Poland 45% 60% 0,70% 20% 2,40% 20% 28%
120
Czech Republic 43% 60% 0,00% 20% 0,35% 20% 26%
Hungary 43% 60% 0,00% 20% 0,25% 20% 26%
Lithuania 41% 60% 0,00% 20% 0,24% 20% 24%
Iceland 41% 60% 0,00% 20% 0,00% 20% 24%
Japan 33% 60% 8,95% 20% 14,10% 20% 24%
Malaysia 39% 60% 1,74% 20% 2,05% 20% 24%
Latvia 39% 60% 0,00% 20% 0,08% 20% 23%
Malta 39% 60% 0,00% 20% 0,00% 20% 23%
Saudi Arabia 36% 60% 0,00% 20% 6,28% 20% 23%
Cyprus 38% 60% 0,00% 20% 0,00% 20% 23%
Turkey 34% 60% 4,31% 20% 7,79% 20% 23%
Australia 35% 60% 3,32% 20% 4,71% 20% 23%
Slovenia 38% 60% 0,00% 20% 0,09% 20% 23%
Panama 37% 60% 0,00% 20% 0,00% 20% 22%
Greece 37% 60% 0,00% 20% 0,71% 20% 22%
Chile 36% 60% 0,00% 20% 1,14% 20% 22%
Brazil 33% 60% 3,56% 20% 1,96% 20% 21%
New Zealand 34% 60% 0,00% 20% 0,67% 20% 20%
Morocco 34% 60% 0,00% 20% 0,20% 20% 20%
Uruguay 34% 60% 0,00% 20% 0,02% 20% 20%
Bulgaria 33% 60% 0,00% 20% 0,14% 20% 20%
Thailand 31% 60% 2,32% 20% 3,98% 20% 20%
Colombia 33% 60% 0,00% 20% 1,73% 20% 20%
Romania 33% 60% 0,35% 20% 0,46% 20% 20%
Peru 32% 60% 0,00% 20% 0,27% 20% 19%
Mexico 29% 60% 1,81% 20% 5,19% 20% 19%
Jordan 31% 60% 0,00% 20% 0,18% 20% 19%
Liechtenstein 31% 60% 0,00% 20% 0,00% 20% 19%
121
Tunisia 30% 60% 0,00% 20% 0,11% 20% 18%
Philippines 29% 60% 0,69% 20% 2,32% 20% 18%
Indonesia 29% 60% 1,30% 20% 1,36% 20% 18%
South Africa 24% 60% 0,35% 20% 0,49% 20% 15%
Armenia 24% 60% 0,00% 20% 0,00% 20% 15%
Serbia 24% 60% 0,00% 20% 0,11% 20% 14%
Mozambique 23% 60% 0,00% 20% 0,00% 20% 14%
Ukraine 22% 60% 0,42% 20% 0,65% 20% 14%
Nigeria 22% 60% 0,00% 20% 1,01% 20% 13%
Angola 21% 60% 0,00% 20% 0,00% 20% 13%
South Sudan 21% 60% 0,00% 20% 0,00% 20% 13%
Portugal 20% 60% 0,00% 20% 0,00% 20% 12%
Costa Rica 19% 60% 0,00% 20% 0,00% 20% 12%
Equatorial Guinea 19% 60% 0,00% 20% 0,00% 20% 11%
Brunei Darussalam 19% 60% 0,00% 20% 0,00% 20% 11%
Hong Kong SAR, China 19% 60% 0,00% 20% 0,00% 20% 11%
Bolivia 19% 60% 0,00% 20% 0,05% 20% 11%
Korea, Rep. 18% 60% 0,00% 20% 0,00% 20% 11%
Macao SAR, China 16% 60% 0,00% 20% 0,00% 20% 9%
Dominican Republic 15% 60% 0,00% 20% 0,00% 20% 9%
Mauritius 15% 60% 0,00% 20% 0,00% 20% 9%
Sri Lanka 14% 60% 0,00% 20% 0,00% 20% 8%
Vietnam 13% 60% 0,00% 20% 0,00% 20% 8%
Bahrain 12% 60% 0,00% 20% 0,00% 20% 7%
Georgia 11% 60% 0,00% 20% 0,00% 20% 7%
Argentina 10% 60% 0,15% 20% 2,84% 20% 6%
St. Kitts and Nevis 10% 60% 0,00% 20% 0,00% 20% 6%
Seychelles 10% 60% 0,00% 20% 0,00% 20% 6%
122
Oman 9% 60% 0,00% 20% 0,00% 20% 6%
Barbados 9% 60% 0,00% 20% 0,00% 20% 6%
Djibouti 9% 60% 0,00% 20% 0,00% 20% 5%
Taiwan, China 9% 60% 0,00% 20% 0,00% 20% 5%
Kuwait 9% 60% 0,00% 20% 0,00% 20% 5%
Montenegro 8% 60% 0,00% 20% 0,00% 20% 5%
Turkmenistan 8% 60% 0,00% 20% 0,00% 20% 5%
Grenada 8% 60% 0,00% 20% 0,00% 20% 5%
Bahamas, The 7% 60% 0,00% 20% 0,00% 20% 4%
St. Vincent and the Grenadines 7% 60% 0,00% 20% 0,00% 20% 4%
Slovak Republic 7% 60% 0,00% 20% 0,00% 20% 4%
Trinidad and Tobago 7% 60% 0,00% 20% 0,00% 20% 4%
Cabo Verde 6% 60% 0,00% 20% 0,00% 20% 4%
Palau 6% 60% 0,00% 20% 0,00% 20% 4%
Puerto Rico 6% 60% 0,00% 20% 0,00% 20% 4%
Nicaragua 6% 60% 0,00% 20% 0,00% 20% 4%
Maldives 6% 60% 0,00% 20% 0,00% 20% 4%
Honduras 6% 60% 0,00% 20% 0,00% 20% 4%
Mongolia 6% 60% 0,00% 20% 0,00% 20% 4%
Antigua and Barbuda 6% 60% 0,00% 20% 0,00% 20% 3%
Bermuda 6% 60% 0,00% 20% 0,00% 20% 3%
Ethiopia 6% 60% 0,00% 20% 0,00% 20% 3%
Congo, Dem. Rep. 5% 60% 0,00% 20% 0,00% 20% 3%
San Marino 5% 60% 0,00% 20% 0,00% 20% 3%
Kazakhstan 5% 60% 0,00% 20% 0,00% 20% 3%
Senegal 5% 60% 0,00% 20% 0,00% 20% 3%
Myanmar 5% 60% 0,00% 20% 0,00% 20% 3%
Uzbekistan 5% 60% 0,00% 20% 0,00% 20% 3%
123
Guyana 5% 60% 0,00% 20% 0,00% 20% 3%
Botswana 4% 60% 0,00% 20% 0,00% 20% 3%
Lao PDR 4% 60% 0,00% 20% 0,00% 20% 3%
Kiribati 4% 60% 0,00% 20% 0,00% 20% 3%
Chad 4% 60% 0,00% 20% 0,00% 20% 3%
Mali 4% 60% 0,00% 20% 0,00% 20% 3%
Marshall Islands 4% 60% 0,00% 20% 0,00% 20% 2%
Cambodia 4% 60% 0,00% 20% 0,00% 20% 2%
Sierra Leone 4% 60% 0,00% 20% 0,00% 20% 2%
Tanzania 4% 60% 0,00% 20% 0,00% 20% 2%
Rwanda 4% 60% 0,00% 20% 0,00% 20% 2%
Niger 4% 60% 0,00% 20% 0,00% 20% 2%
Algeria 4% 60% 0,00% 20% 0,00% 20% 2%
Tajikistan 4% 60% 0,00% 20% 0,00% 20% 2%
Timor-Leste 4% 60% 0,00% 20% 0,00% 20% 2%
Congo, Rep. 4% 60% 0,00% 20% 0,00% 20% 2%
Mauritania 4% 60% 0,00% 20% 0,00% 20% 2%
Macedonia, FYR 4% 60% 0,00% 20% 0,00% 20% 2%
Bhutan 4% 60% 0,00% 20% 0,00% 20% 2%
Bangladesh 4% 60% 0,00% 20% 0,00% 20% 2%
El Salvador 4% 60% 0,00% 20% 0,00% 20% 2%
Ecuador 3% 60% 0,00% 20% 0,00% 20% 2%
Zambia 3% 60% 0,00% 20% 0,00% 20% 2%
Cameroon 3% 60% 0,00% 20% 0,00% 20% 2%
Togo 3% 60% 0,00% 20% 0,00% 20% 2%
Malawi 3% 60% 0,00% 20% 0,00% 20% 2%
Nepal 3% 60% 0,00% 20% 0,00% 20% 2%
Benin 3% 60% 0,00% 20% 0,00% 20% 2%
124
Gambia, The 3% 60% 0,00% 20% 0,00% 20% 2%
Russian Federation 3% 60% 0,00% 20% 0,00% 20% 2%
Tonga 3% 60% 0,00% 20% 0,00% 20% 2%
Burundi 3% 60% 0,00% 20% 0,00% 20% 2%
Moldova 3% 60% 0,00% 20% 0,00% 20% 2%
Samoa 3% 60% 0,00% 20% 0,00% 20% 2%
Uganda 3% 60% 0,00% 20% 0,00% 20% 2%
Namibia 3% 60% 0,00% 20% 0,00% 20% 2%
Paraguay 3% 60% 0,00% 20% 0,00% 20% 2%
Guatemala 2% 60% 0,00% 20% 0,00% 20% 1%
Ghana 2% 60% 0,00% 20% 0,00% 20% 1%
Cuba 2% 60% 0,00% 20% 0,00% 20% 1%
Burkina Faso 2% 60% 0,00% 20% 0,00% 20% 1%
Fiji 2% 60% 0,00% 20% 0,00% 20% 1%
Kyrgyz Republic 2% 60% 0,00% 20% 0,00% 20% 1%
Belarus 2% 60% 0,00% 20% 0,00% 20% 1%
Venezuela, RB 2% 60% 0,00% 20% 0,00% 20% 1%
Azerbaijan 2% 60% 0,00% 20% 0,00% 20% 1%
Lebanon 2% 60% 0,00% 20% 0,00% 20% 1%
Suriname 2% 60% 0,00% 20% 0,00% 20% 1%
Iran, Islamic Rep. 2% 60% 0,00% 20% 0,00% 20% 1%
Zimbabwe 2% 60% 0,00% 20% 0,00% 20% 1%
Sudan 2% 60% 0,00% 20% 0,00% 20% 1%
Libya 2% 60% 0,00% 20% 0,00% 20% 1%
Solomon Islands 2% 60% 0,00% 20% 0,00% 20% 1%
Comoros 2% 60% 0,00% 20% 0,00% 20% 1%
Iraq 2% 60% 0,00% 20% 0,00% 20% 1%
Dominica 2% 60% 0,00% 20% 0,00% 20% 1%
125
Albania 0% 60% 0,00% 20% 0,00% 20% 0%
American Samoa 0% 60% 0,00% 20% 0,00% 20% 0%
Andorra 0% 60% 0,00% 20% 0,00% 20% 0%
Aruba 0% 60% 0,00% 20% 0,00% 20% 0%
Belize 0% 60% 0,00% 20% 0,00% 20% 0%
Bosnia and Herzegovina 0% 60% 0,00% 20% 0,00% 20% 0%
Cayman Islands 0% 60% 0,00% 20% 0,00% 20% 0%
Central African Republic 0% 60% 0,00% 20% 0,00% 20% 0%
Channel Islands 0% 60% 0,00% 20% 0,00% 20% 0%
Côte d'Ivoire 0% 60% 0,00% 20% 0,00% 20% 0%
Curaçao 0% 60% 0,00% 20% 0,00% 20% 0%
Egypt, Arab Rep. 0% 60% 0,00% 20% 0,00% 20% 0%
Eritrea 0% 60% 0,00% 20% 0,00% 20% 0%
Faeroe Islands 0% 60% 0,00% 20% 0,00% 20% 0%
French Polynesia 0% 60% 0,00% 20% 0,00% 20% 0%
Greenland 0% 60% 0,00% 20% 0,00% 20% 0%
Guam 0% 60% 0,00% 20% 0,00% 20% 0%
Guinea 0% 60% 0,00% 20% 0,00% 20% 0%
Guinea-Bissau 0% 60% 0,00% 20% 0,00% 20% 0%
Haiti 0% 60% 0,00% 20% 0,00% 20% 0%
Isle of Man 0% 60% 0,00% 20% 0,00% 20% 0%
Jamaica 0% 60% 0,00% 20% 0,00% 20% 0%
Korea, Dem. Rep. 0% 60% 0,00% 20% 0,00% 20% 0%
Kosovo 0% 60% 0,00% 20% 0,00% 20% 0%
Lesotho 0% 60% 0,00% 20% 0,00% 20% 0%
Liberia 0% 60% 0,00% 20% 0,00% 20% 0%
Madagascar 0% 60% 0,00% 20% 0,00% 20% 0%
Micronesia, Fed. Sts. 0% 60% 0,00% 20% 0,00% 20% 0%
126
New Caledonia 0% 60% 0,00% 20% 0,00% 20% 0%
Northern Mariana Islands 0% 60% 0,00% 20% 0,00% 20% 0%
Papua New Guinea 0% 60% 0,00% 20% 0,00% 20% 0%
São Tomé and Principe 0% 60% 0,00% 20% 0,00% 20% 0%
Sint Maarten (Dutch part) 0% 60% 0,00% 20% 0,00% 20% 0%
Somalia 0% 60% 0,00% 20% 0,00% 20% 0%
St. Lucia 0% 60% 0,00% 20% 0,00% 20% 0%
St. Martin (French part) 0% 60% 0,00% 20% 0,00% 20% 0%
Swaziland 0% 60% 0,00% 20% 0,00% 20% 0%
Syrian Arab Republic 0% 60% 0,00% 20% 0,00% 20% 0%
Turks and Caicos Islands 0% 60% 0,00% 20% 0,00% 20% 0%
Tuvalu 0% 60% 0,00% 20% 0,00% 20% 0%
Vanuatu 0% 60% 0,00% 20% 0,00% 20% 0%
Virgin Islands (U.S.) 0% 60% 0,00% 20% 0,00% 20% 0%
West Bank and Gaza 0% 60% 0,00% 20% 0,00% 20% 0%