Original Article
Artigo Original
Keywords
Public health Hearing Hearing loss Public health policies Uniied Health System Information systems
Descritores
Saúde pública Audição Perda auditiva Políticas públicas de saúde Sistema Único de Saúde Sistemas de informação
Correspondence address:
Luciana Santos Gerosino da Silva Rua Sydnei Antônio Rangel, 238, Santo Inácio, Curitiba (PR), Brasil, CEP: 82010-330. E-mail: [email protected]
Received: 12/17/2012
Study carried out at the Graduate Program in Communication Disorders, Universidade Tuiuti do Paraná – UTP – Curitiba (PR), Brazil.
(1) Graduate Program in Communication Disorders, Universidade Tuiuti do Paraná – UTP – Curitiba (PR), Brazil.
Conlict of interests: nothing to declare.
National Policy on Health Care Hearing: an evaluative
study from covering services and diagnostic procedures
Política Nacional de Atenção à Saúde Auditiva:
um estudo avaliativo a partir da cobertura de serviços
e procedimentos diagnósticos
ABSTRACT
Purpose: To evaluate the National Policy on Hearing Health Care (PNASA) based on the coverage of specialized services and diagnostic procedures in hearing health care in Brazil. Methods: This is an evaluation study focused on the coverage of specialized services that offer moderate- and high-complexity diagnostic procedures by region and in Brazil as a whole. We analyzed the data for the period of 2004–2011 collected from the Uniied Health System’s Informatics Department database (DATASUS), under the link “Information on health” and tabulated using the software Tabwin. While collecting data from this platform, we selected “procedures for diagnostic purposes”, and the selected way of organization was “diagnoses in otorhinolaryngology/audiology” of moderate and high complexity. We estimated coverage and evolution of the number of procedures according to the country’s ive geographic macroregions. Results: We identiied an increase of 113% in service coverage and of 61% in the quantity of moderate- and high-complexity hearing health diagnostic procedures throughout the country. The northern region had an increase of 78% in the number of procedures, higher than all other regions. However, a proportionally larger number of procedures were performed in the southeast. We identiied a signiicant increase in the number of examinations of otoacoustic emissions (OAE) for hearing triage, transient-evoked OAE and distortion product, as well as of diagnostic reassessments of hearing loss in patients older than 3 years.
Conclusion: There has been an increase in services and actions in hearing health care in Brazil since PNASA was implemented, but regional inequalities in the distribution of these services still persist.
RESUMO
Objetivo: Avaliar a Política Nacional de Atenção à Saúde Auditiva (PNASA) a partir da cobertura de serviços especializados e procedimentos diagnósticos em saúde auditiva no Brasil. Método: Estudo avaliativo com enfoque na cobertura de serviços especializados que oferecem procedimentos diagnósticos de média e alta complexidade por Região e no Brasil. Foram analisados dados do período 2004 a 2011 levantados a partir do Departamento de Informática do Sistema Único de Saúde (DATASUS), no ícone “Informações em saúde” e tabulados via
software Tabwin. A seleção nesta plataforma foi direcionada a “procedimentos com inalidade diagnóstica”, e a forma de organização selecionada foi “diagnóstico em otorrinolaringologia/fonoaudiologia” em média e alta complexidade. Foram realizados cálculos das estimativas de cobertura e evolução do número de procedimentos segundo as cinco macrorregiões brasileiras. Resultados: Identiicou-se aumento de 113% na cobertura de serviços e 61% no quantitativo de procedimentos de diagnóstico em saúde auditiva de média e alta complexidade em todo o país. A região Norte apresentou 78% de aumento no número de procedimentos, superior às demais regiões. No entanto, o Sudeste realiza proporcionalmente maior quantidade de procedimentos. Identiicou-se aumento expressivo dos exames de emissões otoacústicas (EOA) para triagem auditiva, de estudos de EOA transitórias e produto de distorção, como também dos exames de reavaliação diagnóstico de deiciência auditiva em pacientes maiores de três anos. Conclusão: Houve incremento dos serviços e ações em atenção à saúde auditiva no Brasil desde a implantação da PNASA, porém persistem importantes desigualdades regionais na oferta de serviços. Luciana Santos Gerosino da Silva1
INTRODUCTION
Hearing loss is one of the most frequent sensory problems in the general population. It is estimated that there are 278 mil-lion people with moderate or profound bilateral hearing loss worldwide(1). In the United States, approximately 17% of the
North-American adults (36 million people) report having some degree of hearing loss(2).
In Brazil, the 2010 census identiied 9.8 million individuals with hearing loss, which represents 5.1% of the population. Among them, 1.3% were between zero and 14 years of age, 4.2% were between 15 and 65 years of age, and 25.6% were 65 years or older(3).
In 2004, the Ministry of Health implemented the National Policy on Hearing Health Care — PNASA (Ordinance MH 2073, year 2004) to improve actions related to hearing health within the Uniied Health System (SUS). It proposed the organization of a hierarchized, regionalized, and integrated network between moderate- and high-complexity basic care, with the purpose of guaranteeing not only hearing diagnoses and rehabilitation but also promotion and protection, as well as audiology and speech therapy for adults and children(4).
Drawing on this policy, speciic actions in basic, moder-ate-, and high-complexity care were deined, to be organized and implemented by the State Health Departments (Ordinance SHD/MH 587, year 2004). The minimum technical criteria for service operation, and reorganization and classiication of the procedures used in the UHS were also established (Ordinance SHD/MH 589, year 2004)(4).
To expand service coverage, a minimum number of health centers specialized in hearing health was deined, based on the necessity of care coverage, the level of complexity of the services rendered, and their operation and technical capacity. The recommended parameter of Hearing Health Care centers for cases of moderate and high complexity (Ordinance SHD/ MH 587, year 2004) is one service per 1.5 million inhabitants. To ensure care to people with hearing loss living in states whose population was below 1.5 million inhabitants, one care center was stipulated. In states with 2–3 million inhabitants, the parameter was two centers.
On the basis of the population estimated for Brazil in 2004, namely 169,872,856 inhabitants, 116 hearing health care units for moderate- and high-complexity cases were to be established across the country, distributed as follows: 16 in the south, 47 in the southeast, 9 in the midwest, 33 in the northeast, and 11 in the north(4,5).
The implantation of the PNASA policy was an important step toward providing fair hearing health care in the country. Between 2002 and 2005, the offer of services of diagnosis, dispensation, and follow-up of individuals who use hearing aids through UHS increased by 200%(5). An increase was
also recorded in the number of services offered by the spe-cialized hearing health network, as more procedures related to the itting of hearing aids were conducted between 2004 and 2011(6).
Considering that the diagnostic procedures used in hear-ing health care are essential for the treatment of patients with
hearing loss, as they minimize the social and health-related consequences of hearing loss, evaluating the specialized ser-vices offered in this sphere can improve the policy in question by optimizing the public funding used to offer qualiied care to a larger number of individuals with hearing loss(7).
The analysis of health actions can provide relevant infor-mation to be used in the process of decision-making, planning and management of health practices, as well as setting a focus on the analysis of programs/policies, services, or technologies. Studies that have the purpose of verifying health services and actions can contribute in reorganizing and re-dimensioning them to contemplate public needs and to use inancial resources more rationally(8-11).
The main purpose of a management-focused evaluation is to produce information that contributes to the improvement of the object evaluated. It does not seek the fundamentals, justiications, or re-direction for a given condition, but its improvement. The priority is the characterization of a condi-tion and its translacondi-tion into measures that can be quantiied and replicated(12,13).
In international studies, authors indicate evaluative pro-cesses aimed at (re)structuring health policies that improve funding usage and service distribution, considering a territorial dimension through a “social and spatial justice” perspective that contributes to the integrality and equality of the services offered(14,15).
It is worth highlighting the scarcity of studies that have the purpose of evaluating coverage and accessibility in the area of hearing health care based on secondary data (information systems). This paucity makes these studies relevant, as they can provide material for relecting upon this topic at the national and international levels(16,17).
In light of these considerations, the aim of the present study was to evaluate the coverage of specialized services and diag-nostic procedures in hearing health care based on the PNASA policy in Brazil.
METHODS
This is an evaluation study about the degree of imple-mentation of hearing health care services in Brazil based on the implementation of the PNASA policy with a focus on the coverage of specialized services in which procedures of moderate and high complexity are offered by region and in the country as a whole.
The evaluation of coverage concerns the availability as well as the social and spatial distribution of resources. These are the main components used to evaluate health care services, deined by the proportion of the target population that beneits from a given intervention(18). This intervention can be differentiated
as potential coverage, which corresponds to the capacity and possibility of offer, and as real coverage, an estimate of the proportion of the population that actually used the services(18).
The usefulness of coverage analyses has been little explored in the area of speech-language pathology and audiology(19).
high complexity according to the criteria stated in the 2004 Ordinance SHD/MH 587 and compared them to the services offered/registered in the UHS in 2010. For this purpose, irst we estimated the number of hearing health care services/centers necessary for Brazil and its regions according to the number of inhabitants in the 2010 census and obtained the number of es-tablishments accredited by the UHS in the same year to measure the coverage of the services in question in Brazil.
In the analysis of the evolution of the quantity of hearing health diagnostic procedures offered by region, we considered 2004 as the base year, when the PNASA policy was imple-mented, but also took into consideration the data pertaining to 2011 (the last year available in the Informatics Department of the Uniied Health System — DATASUS). We also analyzed the quantity of hearing health diagnostic procedures from 2008 to 2011, when the new classiication codes for the procedures were deined in the UHS(6).
Moreover, we analyzed 12 moderate-complexity and 2 high-complexity procedures inanced by the UHS in the same period (2008–2011) in Brazil.
The analysis of coverage evolution was conducted by as-sessing the central tendency of the number of procedures and calculating the percentage difference between the irst and last years of the series. We also used the percentage differences between the real and the estimated coverage.
According to PNASA, moderate-complexity services have the purpose of offering specialized assistance to people with otologic disorders and, especially, hearing loss. The care includes auditory triage and monitoring but does not cover diagnoses and hearing aid itting for children up to 3 years of age; people with neurological and psychological conditions, people with genetic syndromes and associated subnormal vi-sion; and individuals with unilateral hearing loss.
Chart 1 displays the moderate-complexity examinations included in this study and their respective codes.
On the other hand, high-complexity services, according to the PNASA, provide hearing loss diagnoses and rehabilitation for children of up to 3 years of age, patients with associated conditions (neurological, psychological, genetic syndromes, blindness, subnormal vision) and unilateral loss, and for those who have dificulty in undergoing audiological assessments in services of moderate complexity. In this sense, the staff must rely on equipment to carry out differential diagnoses of hearing loss.
The high-complexity examinations included in this study and their respective codes in the UHS can be seen in Chart 2.
Chart 1. Audiology codes and moderate-complexity diagnostic procedures
Code Procedure
0211070025 Visual reinforcement audiometry 0211070041 Tone threshold audiometry
0211070149 Otoacoustic emissions for triage purposes 0211070092 Hearing loss diagnostic assessment
0211070157 Transient-evoked otoacoustic emissions and distortion product
0211070203 Immittance audiometry 0211070211 Logoaudiometry
0211070270 Brainstem auditory-evoked potentials (BAEP) for triage purposes
0211070262 Short-, middle-, and long-latency auditory-evoked potentials
021107029 Hearing loss diagnostic reassessment for patients older than 3 years
0211070319 Selection and verification of benefits of personal sound amplification devices (PSAD)
0211070360 Hearing triage of school-aged patients
Chart 2. Audiology codes and high-complexity diagnostic procedures
Code Procedure
0211070106 Assessment for differential diagnosis of hearing loss
0211070300 Hearing loss diagnostic reassessment for patients younger than 3 years
The data were obtained from the DATASUS database(20),
un-der the link “Information on health”. The search was narrowed to “ambulatorial procedure by location” and the geographic coverage was displayed by region.
Therefore, our search was redirected from a group of proce-dures to “diagnostic proceproce-dures”. We then selected “diagnoses in otorhinolaryngology/speech-language pathology and audiol-ogy” of moderate and high complexity.
We analyzed the data on the Information Notes on Health of the Information Systems in Health — DATASUS, composed of an information database of public domain available online.
The data were tabulated using the software Tabwin, avail-able through the Informatics Department of the Ministry of Health. After this step, we calculated the estimates of coverage and evolution of the number of procedures according to the ive Brazilian geographical macroregions (north, northeast, midwest, southeast, and south).
Some limitations of databases must be highlighted. They are updated by health professionals and are, therefore, subject to errors such as duplication and lack or substitution of informa-tion, which can compromise data quality. These facts do not invalidate this research, because these speciicities are present in studies of this type.
This study was approved by the human research eth-ics committee of the Clineth-ics Hospital of Universidade Federal do Paraná on December 05, 2011 (report number 410ext043/2011-10).
RESULTS
As stated in the PNASA policy(4), the distribution of hearing
health care services must allocate one center for each 1.5 mil-lion inhabitants. On the basis of data of the 2010 census, Brazil had a population of 190,732,694 inhabitants at that time(3);
population was 127. Data available on DATASUS show that 143 centers were registered by the Ministry of Health in that year for the entire territory, that is, a coverage of 112.6%.
However, on analyzing the distribution of services registered per region, we observed that the south had a number of centers and coverage much larger than what was estimated as necessary (189.0%), whereas the north had half of the necessary coverage (54.5%) to assist the local population (Table 1).
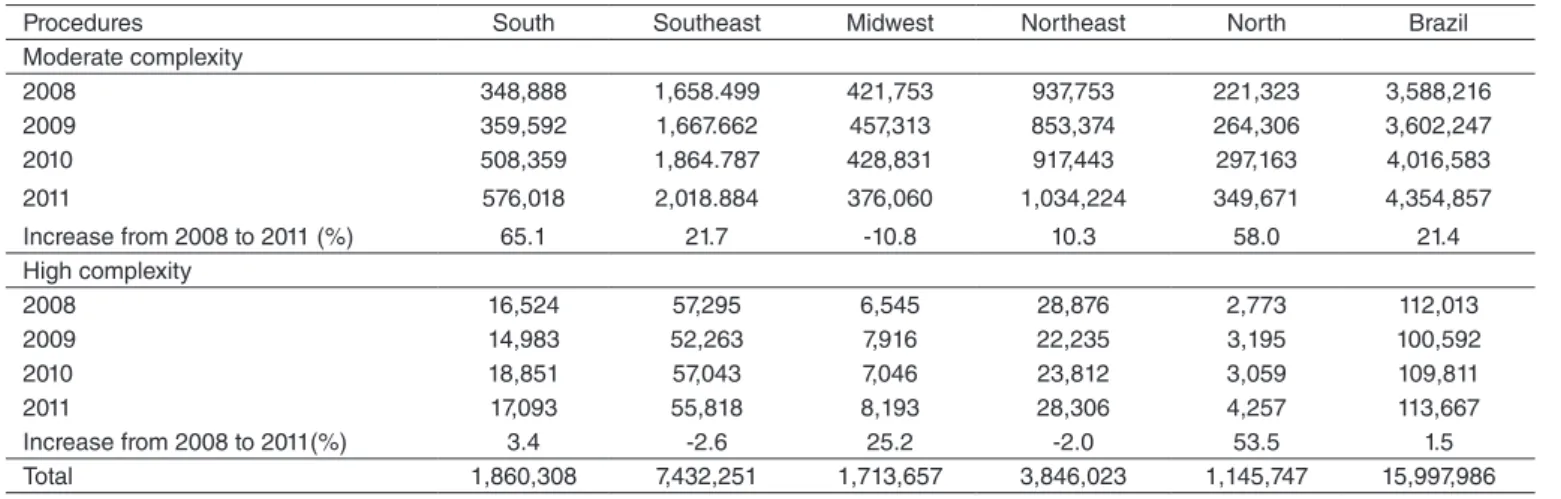
Table 2 shows the evolution of all moderate-complexity hearing health procedures in the national territory and by re-gion between 2008 and 2011. It is observable that there was an overall increase of 21.4% of these procedures in Brazil, whereas high-complexity procedures had an increase of only 1.5%.
When evaluation was conducted by Brazilian region, we veriied that the southeast concentrated the majority of moder-ate-complexity procedures in all years studied, followed by the northeast region. However, the south had the highest propor-tional increase (65%) in that period. In the north, the number of procedures performed over the 4 years was the smallest in the country, but the region presented the second highest growth rate (58% in that period).
Concerning high-complexity procedures by region, the southeast presented the largest quantity of procedures performed from 2008 to 2011 in comparison to the other regions, followed by the northeast. However, they had a
negative growth rate if the irst and the last years investigated are considered, as the number of examinations decreased 2%. Although a much smaller number of high-complexity procedures was registered in the north region in relation to the others, it presented an increase of 53.5% in that period, as seen in Table 2.
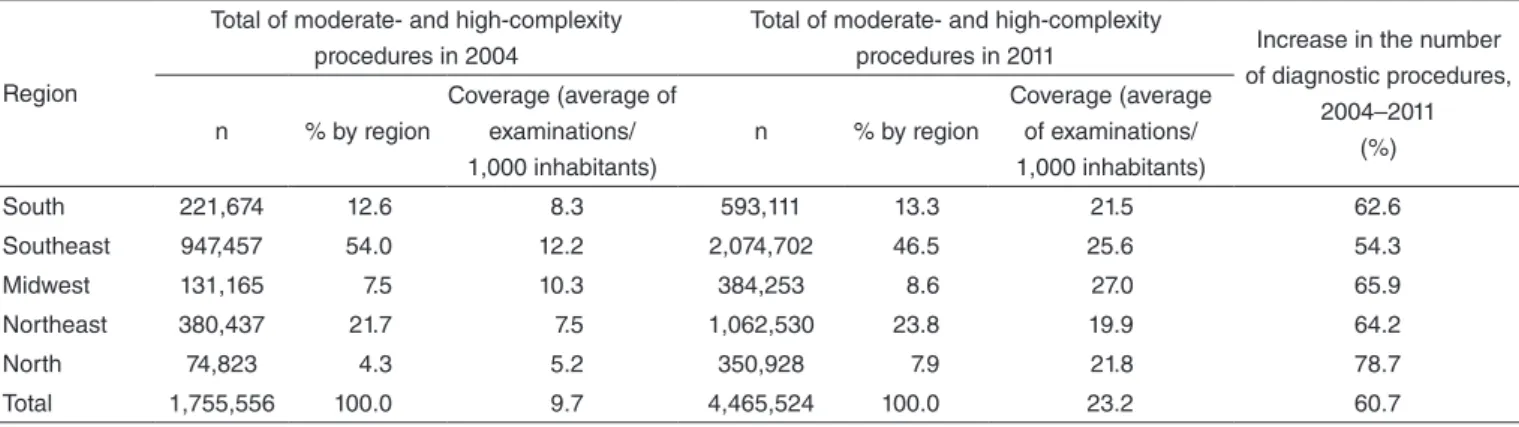
With the purpose of evaluating the implantation of PNASA, we estimated the coverage of diagnostic procedures (Charts 1 and 2) in hearing health care based on the number of exami-nations conducted in 2004 compared to the more recent data of 2011.
Table 3 shows the increase in the number and coverage of procedures (given by the average of examinations per 1,000 inhabitants) in all regions between the two years analyzed. The north region had a growth rate higher than other regions (78.68%). However, a proportionally larger number of proce-dures were performed in the southeast in comparison to the other regions (46.5% in 2011).
Table 4 details the evolution of some speciic hearing health diagnostic procedures of moderate and high complexity between 2008 and 2011.
Over the 4 years evaluated in this study, there was an in-crease in the majority of procedures analyzed, namely 473% in examinations and otoacoustic emissions (OAE) for triage, 129% in examinations of transient-evoked OAE and distortion
Table 1. Estimate of hearing health care centers covered by the Unified Health System by region (Brazil, 2010)
Region Population in 2010 Estimated necessary services* (number)
Accredited services (number)
Estimated service coverage (%)
South 27,384,815 18 34 189.0
Southeast 80,353,724 54 59 109.3
Midwest 14,050,340 9 9 100.0
Northeast 53,078,137 35 35 100.0
North 15,865,678 11 6 54.5
Total 190,732,694 127 143 112.6
*One center for every 1.5 million inhabitants
Table 2. Evolution of the number of moderate- and high-complexity hearing health procedures in the Unified Health System by region (Brazil, 2008–2011)
Procedures South Southeast Midwest Northeast North Brazil Moderate complexity
2008 348,888 1,658.499 421,753 937,753 221,323 3,588,216
2009 359,592 1,667.662 457,313 853,374 264,306 3,602,247
2010 508,359 1,864.787 428,831 917,443 297,163 4,016,583
2011 576,018 2,018.884 376,060 1,034,224 349,671 4,354,857 Increase from 2008 to 2011 (%) 65.1 21.7 -10.8 10.3 58.0 21.4 High complexity
2008 16,524 57,295 6,545 28,876 2,773 112,013
2009 14,983 52,263 7,916 22,235 3,195 100,592
2010 18,851 57,043 7,046 23,812 3,059 109,811
2011 17,093 55,818 8,193 28,306 4,257 113,667
product, and 121% in diagnostic reassessments of hearing loss in patients older than 3 years.
On the other hand, we veriied a decrease in the number of visual reinforcement audiometry examinations, and short-, middle- and long-latency auditory-evoked potentials, as well as of hearing triage examinations performed in school-aged patients (Table 4).
DISCUSSION
In this study we aimed at evaluating the degree of implemen-tation of the PNASA policy based on the quantitative evolution of moderate- and high-complexity services and diagnostic procedures in hearing health care in the entire national territory.
The results obtained point to advancements in service coverage and, consequently, in hearing health diagnostic procedures in the country.
In a study about hearing health programs in countries in Latin America and the Caribbean, the authors concluded that hearing loss is not prioritized in health care services, and that in-vestments in technology and human material are as limited as the services offered(16). In several Latin American countries,
such as Argentina, Chile and Mexico, these interventions were incipient before 2000 and did not include audiology diagnostic services(17). In Brazil, these actions were intensiied with the
implementation of PNASA in 2004.
Few studies on the quantitative evaluation of procedures as a resource to improve service and accessibility coverage and
Table 4. Evolution of the number of specific hearing health diagnostic procedures (Brazil, 2008–2011)
Procedures 2008 2009 2010 2011 Increase (%)
Moderate complexity
Visual reinforcement audiometry 39,705 41,174 36,052 31,641 -20.3 Tone threshold audiometry 382,376 486,034 553,807 612,654 60.2 Otoacoustic emissions for triage purposes 89,224 250,081 361,324 511,274 473.0 Hearing loss diagnostic assessment 34,381 38,542 41,294 37,965 10.4 Transient-evoked otoacoustic emissions and distortion product 67,966 87,856 119,157 155,807 129.2 Immittance audiometry 367,458 425,845 460,623 506,597 37.9
Logoaudiometry 435,766 484,631 525,424 562,843 29.2
Brainstem auditory-evoked potentials (BAEP) for triage purposes 36,447 37,036 39,523 42,733 17.2 Short-, middle-, and long-latency auditory-evoked potentials 31,341 17,234 17,442 21,223 -32.3 Hearing loss diagnostic reassessment for patients older than 3
years 10,962 16,049 21,795 24,209 120.8
Selection and verification of benefits of personal sound
amplification devices (PSAD) 71,186 88,428 102,292 114,367 60.7 Hearing triage of school-aged patients 51,426 44,847 33,108 26,250 -49.0 Subtotal 1,618,238 2,017,757 2,311,841 2,647,563 8,595,399 High complexity
Assessment for differential diagnosis of hearing loss 89,224 94,318 102,979 107,853 20.9 Hearing loss diagnostic reassessment for patients younger than
3 years 5,198 6,274 6,832 5,814 11.9
Subtotal 94,422 100,592 109,811 113,667 418,492
Total 1,712,660 2,118,349 2,421,652 2,761,230 9,013,891
Table 3. Evolution of coverage for moderate- and high-complexity hearing health diagnostic procedures by region (Brazil, 2004 and 2011)
Region
Total of moderate- and high-complexity procedures in 2004
Total of moderate- and high-complexity
procedures in 2011 Increase in the number of diagnostic procedures,
2004–2011 (%) n % by region
Coverage (average of examinations/ 1,000 inhabitants)
n % by region
Coverage (average of examinations/ 1,000 inhabitants)
South 221,674 12.6 8.3 593,111 13.3 21.5 62.6
Southeast 947,457 54.0 12.2 2,074,702 46.5 25.6 54.3
Midwest 131,165 7.5 10.3 384,253 8.6 27.0 65.9
Northeast 380,437 21.7 7.5 1,062,530 23.8 19.9 64.2
North 74,823 4.3 5.2 350,928 7.9 21.8 78.7
organization have been carried out in the country(5,8,21). In one
of them, the authors analyzed the users’ level of satisfaction pertaining to the dificulty to keep track of the services offered in hearing health(7).
It is known that in order to achieve good-quality health care several mechanisms for evaluation and control are used. Evaluating its structure is fundamental to planning and man-aging health care services. It also evidences the real situation in a given territory, region, and country, which facilitates the proper use of resources, investments, and service extension(22).
Regional or state evaluation studies on PNASA are still scarce. Speciic studies were carried out in the northeastern region, Pernambuco(5), and in the southeast, Rio de Janeiro(21).
Both studies showed the necessity of improvements concerning the hearing health care procedures, early diagnoses, and access to hearing aids and rehabilitation.
On analyzing the quantity of moderate- and high-complex-ity services offered by macroregion (Table 1), we identiied that the south and the southeast regions surpassed the number of estimated necessary services according to the parameters of PNASA. However, in the northern region the number of services was still below 50% of expectations.
From 2008 to 2011 (Table 2), the southern region had a signiicant increase in moderate-complexity interventions, followed by the north, which maintained this growth also in regards to moderate and high complexity, compared to the other macroregions.
In a study conducted based on secondary data from the Ambulatorial Information System (AIS) of the UHS, with a focus on personal sound ampliication devices (PSAD) itting from 2004 to 2010, the researchers identiied an improvement in the national coverage of hearing health care services, with 86% of network implementation across the national territory, and that the midwest and the north were below the expectations compared to the other regions(6).
These differences can be justiied by Brazil’s immense demographic and socioeconomic heterogeneity. The UHS’ pro-posal to decentralize health care services contributes to health care accessibility throughout the national territory. However, equality and integrality become a challenge, as care-related aspects spring from local initiatives, in tune with a given popu-lation’s inancial particularities and necessities, proposed by state and municipal management personnel(14,15,23-25).
In regards to the north, data from the 2002 Municipal System Management Survey revealed an increase in the region’s resources, even though they still remained below the other regions. According to the study, advancements and increases were observable following the implementation of the UHS(26).
The increase in the number of moderate-complexity proce-dures related to hearing health can be justiied by technologi-cal advancements along with investments by the Ministry of Health, the organization of care in network mode in several municipalities, policies geared toward the promotion of equal-ity, and to the implementation of the Little Ear Test law (Teste
da Orelhinha), which mandates the conduction of OAE
exami-nations in children born in the country(27,28).
Concerning the procedures considered of moderate com-plexity in the AIS, we veriied a signiicant decrease in au-diometry examinations with visual reinforcement (Table 4). This can be attributed to technological advancements and to the acquisition of equipment to be used in hearing health services with the purpose of performing objective examinations due to their easy use and practicality.
The databases made available by the Ministry of Health are a way to democratize information and also a tool for social management and control, but these resources are underused by all levels of health management. We highlight, however, that analyses based on the data available on DATASUS, among others, must be judicious, as typing errors and inconsistencies might be present(8,9).
Finally, we highlight the need for new quantitative evalu-ation studies that detail the distribution of hearing health care services in each state and region. Studies carried out to create protocols for assessing the PNASA policy in Brazil are also necessary, considering the expansion of the procedures shown in this study, with the purpose of evaluating its effectiveness.
CONCLUSION
We veriied a relative increase in the number of moderate-complexity examinations in the periods studied here. It was also evident that the north region presented a signiicant increase in the number and coverage of procedures in the period analyzed, although it still has insuficient coverage for specialized ser-vices, which shows that regional inequalities in the distribution of hearing health care services still persist.
*LSGS was responsible for data collection, tabulation and analysis, and also for manuscript elaboration; CGOG and VMNS were responsible for the study project and outline, as well as overall supervision of the stages of manuscript writing and elaboration.
REFERENCES
1. Mondelli MFCG, Silva LSL. Peril dos pacientes atendidos em um sistema de alta complexidade. Arq Int Otorrinolaringol. 2011;15(1):29-34. 2. Oyler A. Untreated hearing loss in adults–A growing national epidemic;
2011 [cited 2013 Nov 30). Available from: http://www.asha.org/Aud/ Articles/Untreated-Hearing-Loss-in-Adults/.
3. Instituto Brasileiro de Geograia e Estatística. Censo Demográico 2010: características gerais da população, religião e pessoas com deiciência. Rio de Janeiro: IBGE; 2010.
4. Brasil. Ministério da Saúde. Portaria nº 2.073, de 28 de setembro de 2004. Institui a Política Nacional de Atenção à Saúde Auditiva. Brasília: Ministério da Saúde; 2009.
5. Teixeira CF. Estudo avaliativo da política de atenção à saúde auditiva: estudo de caso em Pernambuco [tese]. Recife: Centro de Pesquisa Aggeu Magalhães, Fundação Oswaldo Cruz; 2007.
6. BevilacquaMC, MorettinM, MeloTM, AmantiniRCB, Martinez MANS. Contribuições para análise da política de saúde auditiva no Brasil. Rev Soc Bras Fonoaudiol. 2011;16(3):252-9.
8. Bevilacqua MC, Melo TM, Morettin M, Lopes AC. A avaliação de serviços em Audiologia: concepções e perspectivas. Rev Soc Bras Fonoaudiol. 2009;14(3):421-6.
9. Coeli CM. Sistemas de Informação em Saúde e uso de dados secundários na pesquisa e avaliação em saúde. Cad Saúde Colet. 2010;18(3):335-6.
10. Silva LMV, Formigli VLA. Avaliação em saúde: limites e perspectivas. Cad Saúde Pública. 1994;10(1):80-91.
11. Tanaka OY, Tamaki EM. O papel da avaliação para a tomada de decisão na gestão de serviços de saúde. Ciênc Saúde Coletiva. 2012;17(4):821-8.
12. Schoenbaum SC, Sundwall DN,. Using clinical practice guidelines to evaluate quality of care. Volume 1. Washington (DC): US Department of Health and Human Services. Agency for Health Care Policy and Research; 1995.
13. Donabedian A. Criteria and standards for quality assessment and monitoring. QRB Qual Rev Bull. 1986;12(3):99-108.
14. Santinha G. Cuidados de saúde e território: um debate em torno de uma abordagem integrada. Saúde Soc. 2013;22(3):815-29.
15. Gold M. Beyond coverage and supply: measuring access to healthcare in today’s market. HealthServRes. 1998;33(3 Pt 2):625-84.
16. Madriz JJ. Audiology in Latin America: hearing impairment, resources and services. Scand Audiol Suppl. 2001;(53):85-92.
17. Madriz JJ. Hearing impairment in Latin American: an inventory of limited options and resources. Audiology. 2000;39(4):212-20.
18. Cardoso MO, Vieira-da-Silva LM. Avaliação da cobertura da atenção básica à saúde em Salvador, Bahia, Brasil (2000 a 2007). Cad Saúde Pública. 2012;28(7):1273-84.
19. Novaes HMD. Avaliação de programas, serviços e tecnologias em saúde. Rev Saúde Pública. 2000;34(5):547-9.
20. DATASUS. Ministério da Saúde/Secretaria de Atenção à Saúde (SAS): Sistema de Informações Hospitalares do SUS (SIH/SUS). Brasil: DATASUS; 2009 [cited 2012 Abr 11]. Disponível em: http://www2. datasus.gov.br/DATASUS/index.php.
21. Amaral LS. A política nacional de atenção à saúde auditiva: avanços e entraves no município do Rio de Janeiro [dissertação]. Rio de Janeiro: Escola Nacional de Saúde Pública Sergio Arouca; 2009.
22. Brasil. Ministério da Saúde. Agência Nacional de Vigilância Sanitária. Programa Nacional de Avaliação de Serviços de Saúde. Resultado do processo avaliativo 2004-2006. Brasília: Ministério da Saúde; 2007. 23. The Scottish Government. Draft quality standarts for adult hearing
rehabilitation. 2008 [cited 2012 Dec 14]. Available from: scotlandd.gov. uk/publications/2008/01/09093543/0.
24. Silveira DS, Facchini LA, Siqueira FV, Piccini RX, Tomasi E, Thumé E, et al. Gestão do trabalho, da educação, da informação e comunicação na atenção básica à saúde de municípios das regiões Sul e Nordeste do Brasil. Cad Saúde Pública. 2010;26(9):1714-26.
25. Pinheiro RS, Camargo Júnior KR, Coeli CM. Relacionamento de bases de dados em saúde. Cad Saúde Colet. 2006;14(2):195-6.
26. Viana ALD, Fausto MCR, Lima LD. Política de saúde e eqüidade. São Paulo Perspec. 2003;17(1):58-68.
27. Silva KR, Ferreira MC, Guia ACOM, Neto RO, Lemos SMA. Produção cientíica em saúde auditiva no Brasil: análise do período de 2000 a 2010. Rev CEFAC. 2013;15(1):215-27.