Guilherme G. Peixoto* Instituto Tecnológico de Aeronáutica
São José dos Campos − Brazil [email protected]
Mauro Angelo Alves Instituto de Aeronáutica e Espaço
São José dos Campos − Brazil [email protected]
Alberto José de Faro Orlando Instituto Tecnológico de Aeronáutica
São José dos Campos − Brazil [email protected]
Mirabel Cerqueira Rezende Instituto de Aeronáutica e Espaço
São José dos Campos − Brazil [email protected]
*author for correspondence
Measurements in an Outdoor
Facility and Numerical Simulation
of the Radar Cross Section of
Targets at 10 GHz
Abstract: This paper presents preliminary data from an ongoing study on the radar cross section (RCS) of targets with simple and complex surface geometries (a lat square plate, a 90° dihedral corner relector and a retired air-to-air missile). Measurements and computer simulations of these metallic targets were carried out at 10 GHz and also when the surfaces of the targets were completely coated with a radar absorbing material (RAM), consisting of lexible sheets of carbonyl iron dispersed in a silicone rubber matrix. Experimental measurements were obtained in an outdoor facility, and computer simulations were performed using a commercial software package. The main objective of this study was to compare results in order to highlight some of the issues related to the determination of the RCS of an actual target. Additionally, a Brazilian research institute has demonstrated the capability to produce and characterize materials related to the main aspects of RCS research, namely, measurement, simulation, and production of RAM. This paper introduces the reader to the research being carried out in this area at the Materials Division in the Instituto de Aeronáutica e Espaço.
Keywords: Radar cross section, Computer simulations, Outdoor measurements, Radar absorbing materials.
INTRODUCTION
The community of researchers interested in problems related to the electromagnetic scattering and measurement of radar cross section (RCS) of real-sized targets is now faced with an interesting predicament: should one measure the RCS of a target in an outdoor facility or in an anechoic chamber? Is it acceptable to simulate the RCS of a target using one of the many software packages available in the market? Both approaches have advantages and disadvantages. It can be argued that measurements will always produce more realistic RCS values (provided that equipment and experiment are well designed and of good quality), but these measurements can be quite expensive
and logistically dificult to carry out. On the other hand,
simulations using computers have become more reliable
and the costs are signiicantly smaller, but the results from
simulations depend on the quality of models used and on the simulation software itself; besides, results from computer simulations need to be validated by experimental data. Usually, the researcher may be pressured for choosing one method over another because it is not always possible to count on both methods (experimental and simulation) to determine the RCS of a target.
In order to better understand the differences between
measurements and simulations, the RCS of two targets − a metallic 90° dihedral corner relector and a retired air-to-air missile − was determined experimentally in an outdoor
RCS facility and simulated with a commercial software. Also, the RCS of these two targets was measured and simulated after their surfaces were coated with a radar absorbing material (RAM).
This paper gives a brief description of the RCS facility, the RAM used, the method of characterization of the RAM, and the software simulation tool. This work is part of an ongoing research project carried out at the Materials Division of the Instituto de Aeronáutica e Espaço on studies of the RCS of complex targets and the production of RAM (Folgueras, Alves and Rezende, 2010; Gama and Rezende, 2010; Peixoto et al., 2009; Silva et al., 2009; Alves, Peixoto and Rezende, 2007a).
EXPERIMENTAL SETUP
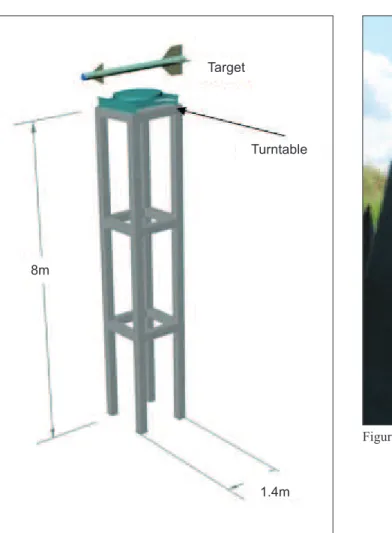
Experimental data were collected in an outdoor RCS facility (Peixoto et al., 2009; Alves, Peixoto and Rezende, 2007b). Targets are mounted on a rotating table (rotation in azimuth) placed atop an 8-m high pylon. Figure 1 shows an illustration of the pylon together with a study target; the structure is made of steel-reinforced concrete. Received: 26/10/10
Accepted: 15/02/11
Figure 1: Support pylon for radar cross section measurements. Note the presence of a turntable to rotate targets in azimuth.
!
TargetTurntable
8m
1.4m
Figure 2: Outdoor radar cross section (RCS) facility. Support pylon used for RCS measurements (background; height, 8 m). The pylon is covered with pyramidal radar absorbers. The radar absorbers are used to cover part of the ground surface (foreground). Atop the pylon, there is a 1 m² metal plate used for calibration of the system.
In order to minimize spurious relections during
measurements, the pylon is completely covered with commercial pyramidal radar absorbers. Figure 2 shows a square aluminum plate (1 m x 1m), used for calibration purposes, mounted on the rotating table and the support pylon covered with radar absorbers.
Two radar antennas are mounted on a metal structure and their position is fully adjustable so that they are at the same height as the target. The diameter of the antennas is 1.5 m.
The antennas are in a quasi-monostatic coniguration, i.e.,
there is a transmitting and receiving antenna. The distance between the radar antennas and the target is 230 m. The beam width of the transmitting antenna is about 3°. At a distance of 230 m, the radar antenna illuminates the whole pylon, justifying the use of the radar absorber.
The electronic circuit used for the RCS measurements consists of emitting and receiving modules. The emitting module is composed of a synthesized microwave generator (Agilent, model E8257D), operating from 250 kHz to 40 GHz and power of 15.85 mW (12 dBm), coupled to a
20 W power ampliier operating from 0.8 GHz to 20 GHz (Ampliier Research, model 20ST1G18). The microwave
generator is protected against return signals by an isolator circuit. The radar pulse width can be modulated from 10 ns
to 42 s. The ampliied signal produced by the generator
is coupled to the transmitting antenna. The radar signal scattered by the target is collected by the receiving antenna.
The signal is ampliied by a low-noise ampliier and sent
to a spectrum analyzer (Anritsu, model MS6226C). A DC blocker protects the spectrum analyzer from spurious signals. This system can be used for measurements in the S, C and X bands (2-12 GHz). In this study, measurements and simulations were performed in the X-band (10 GHz). This frequency band is commonly used in radars for the
identiication and discrimination of targets.
SIMULATION SOFTWARE
The RCS of a target can be deined as the area intercepting an amount of electromagnetic power which − when scattered isotropically − produces at the receiver an
Measurements in an Outdoor Facility and Numerical Simulation of the Radar Cross Section of Targets at 10 GHz
frequency and angle of incidence of the radar wave, and the electromagnetic properties of the surface of the target. It can be expressed by Eq. 1 (Knott, Schaeffer and Tuley, 1993):
ı lim r '
4r2 E S
E
I
=
2 2
(1)
where ESis the scattered ield; EIis the incident ield at the target; and r is the distance between the target and the
antenna. The RCS deined by Eq. 1 is often referred to
as either monostatic or backscattered RCS. Equation 1 is valid when the target is illuminated by a plane wave
(far-ield approximation) (Knott, Schaeffer and Tuley, 1993).
However, it is important to note that Eq. 1 is deceivingly
simple; the calculation of scattered ields using this
equation requires the solution of Maxwell’s equations using complicated boundary conditions. Analytical solutions only exist for a small number of objects with simple surface geometry. Therefore, computer simulations are the only means to calculate the RCS of complex targets.
There are several software packages in the market to simulate RCS. In this study, CADRCS was used (CADRCS, 2009). This software combines ray-tracing and ray-shadowing techniques with physical optics to calculate the RCS of the target. According to its developers, CADCRS can calculate the RCS of a target larger than the radar wavelength with great accuracy, reproducing results from an actual radar (Essen et al., 2002). Simulations using CADRCS can be carried out under different sets of
conditions, such as wave polarization, target relectivity
and surface roughness. A PC running Windows Vista™, with a 2.2 GHz clock and 2 GB RAM, was used for the simulations.
TARGETS
The targets used in this study were a lat square plate, a 90° dihedral corner relector and a retired air-to-air missile. The lat plate measures 1 m² and is made of aluminum. The corner relector is made of two 0.5 m x
0.5 m aluminum plates welded together at a 90° angle. Figure 3 shows the CAD model of the missile used in the simulations. Figure 4 shows a photograph of the actual missile. The total length of the missile is 2.84 m, the diameter of the cylindrical body is 0.15 m, and the span
of tail wings is 0.66 m. The body, the wings and the ins
are made of aeronautical aluminum. In the nose of the missile, there is a heat-seeking device protected by a glass dome. The rocket nozzle is made of a non-metallic heat-resistant material.
The surfaces of the models of the lat plate, corner relector and missile used in the simulations were meshed
with 2,024, 4,096 and 377,000 triangular elements, respectively. The largest dimension of the triangular elements for the missile model was set at 4 mm.
RADAR ABSORBING MATERIAL
For this study, the RAM was produced as lexible
sheets by the dispersion of industrial-grade high purity carbonyl iron in a matrix of silicon rubber (60/40% in mass, respectively). This formulation resulted in good attenuation of electromagnetic energy in the X band, and the production of the RAM using these components was relatively simple (Gama, 2009; Gama and Rezende, 2010). The microwave attenuation properties of the RAM in the X-band were characterized using the waveguide
technique, in which measurements of the energy relected
and absorbed by the material and S-parameters were performed. The measurement system comprises a Hewlett-Packard X752C waveguide with rectangular cross section coupled to a system consisting of a Agilent 8510C vector network analyzer, a Hewlett-Packard 8340B frequency Figure 3: Front and rear views of the CAD model of the
air-to-air missile. Note the glass dome (light blue) protecting the heat-seeking device, and the rocket nozzle cavity (red).
generator (10 MHz-26.56 GHz), and a Hewlett-Packard 8510A S-parameter test (45 MHz-26.56 GHz) (Laverghetta, 1976). The complex values of the electric permittivity (ε) and magnetic permeability (μ) of the material as a function of frequency were calculated from the S-parameters using the Agilent 85017E software. The relative values of ε and
μ at 10 GHz are εr = 5.5 – 0.3i and μr = 1.5 – 0.5i. Figure 5 shows the attenuation of electromagnetic energy of this material as a function of frequency. Note that the value of the attenuation at 10 GHz is marked in red (-10.5 dB,
which corresponds to a relectivity coeficient r = 0.32 or
an attenuation value higher than 90%). Figure 6 shows the missile coated with RAM sheets with a thickness of 2.5 mm. For the simulations, the dimensions of the CAD model were adjusted accordingly. The RAM was applied
to cylindrical body, wings and ins of the missile and over the whole surface of the corner relector.
Figure 5: Experimental measurements of the attenuation as a function of the frequency for the radar absorbing material (RAM) consisting of carbonyl iron dispersed in a silicon rubber matrix. Thickness of the RAM is 2.5 mm. The attenuation at 10 GHz is marked in red.
Attenuation (dB)
8 9 10 11 12
-8 -6
-10 -4
Frequency (GHz)
Figure 6: Air-to-air missile coated with radar absorbing material (RAM) sheets (gray color). The thickness of the RAM sheets can be observed in the photograph on the right (red arrows).
Figure 7: Measured radar cross section (RCS) of a lat square aluminum plate. Radar frequency of 10 GHz.
Reflectivity (dBm)
-30
-70 -60 -40
-50
-20
-30 -10 0 10 20 30
Aspect Angle (degrees) Flat Plate Measurements Metal
RESULTS
For the simulation, the models were rotated in azimuth 360°, and RCS values were calculated at 1° intervals. Simulation time for the missile model was about 48 hours for a total of 360 RCS values, and for the corner
relector and lat plate models, it was less than hour for the same number of RCS values. At 10 GHz, the far-ield
condition (r > 2D2/λ), where D is a constant related to the
dimention of the target, λ is the radar frequency, and r is the distance between target and antenna (Knott, Schaeffer and Tuley, 1993) is valid for objects smaller than 2 m. Since the missile is 2.9 m long, simulations were carried out taking into account the actual distance between radar and target.
Measurements with the square lat plate were made to
determine that the system was working properly. Figures 7 and 8 show measurements and simulations of the RCS
of the lat square plate. In the case of simulations, the
RCS for a RAM coated plated was also calculated. Note
Measurements in an Outdoor Facility and Numerical Simulation of the Radar Cross Section of Targets at 10 GHz
Figure 8: Simulated radar cross section (RCS) of a lat square aluminum plate. Metallic surface and surface coated with a radar absorbing material (RAM). Radar frequency of 10 GHz.
-20
-30 -10 0 10 20 30
Aspect Angle (degrees)
RCS (dBsm)
-50 -40 -30 -20 -10 0 10 20 30 40
Flat Plate Simulation — Metal — RAM
Figure 9: Measured radar cross section (RCS) of an aluminum dihedral corner. Metallic surface and surface coated with a radar absorbing material (RAM). Radar frequency of 10 GHz.
Aspect Angle (degrees)
RCS (dBsm)
-65
-45 -30 -15 0 15 35 45
-60 -55 -50 -45 -40 -35
Dihedral corner Measurements
— Metal — RAM
Figure 10: Simulated radar cross section (RCS) of an aluminum dihedral corner. Metallic surface and surface coated with a radar absorbing material (RAM). Radar frequency of 10 GHz.
Aspect Angle (degrees)
RCS (dBsm)
-30
-45 -30 -15 0 15 35 45
-20 -10 0 10 20 30
Dihedral corner Simulations
— Metal — RAM
measurements and simulations, RCS values are expressed as dBm and dBsm, respectively.
In the case of simulations of lat plates, the RCS is proportional to inverse of the square of the relectivity coeficient (r-2) of the hypothetical RAM used to coat
the plate. This fact can be easily observed by performing simulations with plates consisting of materials with
different relectivities.
The measured and simulated RCS diagrams of the dihedral corner are shown in Figs. 9 and 10, respectively. The RCS of this object was measured with and without RAM using the experimental setup. The simulations were performed
under the same conditions. Similar to the lat plate, the
vertical scale is not the same in these graphs.
The overall patterns for both metal and RAM-coated dihedral corner are similar when simulations and measurements are compared (Figs. 9 and 10). These graphs indicate that the data acquisition system and the simulation software performed satisfactorily for both
targets conigurations. However, there are some minor
differences between measured and simulated RCS patterns, and these differences can be explained by several factors, such as misalignment between target and radar antennas, surface irregularities on the target, instrumental errors and
spurious relections, among others.
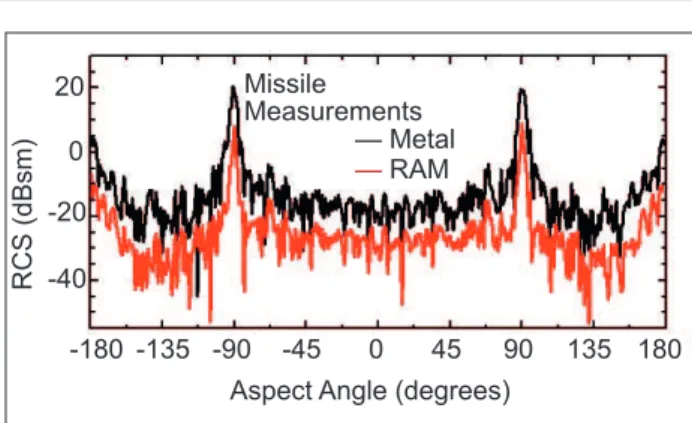
Measurements and simulations of the RCS of the missile are shown in Figs. 11 and 12, respectively. Some interesting features are easily recognizable in both measured and simulated RCS patterns, such as the side view RCS (-90°
and 90°), the relection of radar waves by the mirror of
the heat seeking device (0°), and the RCS signature of the rocket nozzle cavity (-180° and +180°). Nevertheless, differences between simulated and measured results are as important as similarities.
The simulation uses models whose surfaces need to be discretized, resulting in deviations from the actual
surface of the target and simulation errors. On the
other hand, whenever measurements are made, there are always errors associated with the measurements Figure 11: Measured radar cross section (RCS) of an air-to-air missile. Metallic surface and surface coated with a radar absorbing material (RAM). Radar frequency of 10 GHz.
Aspect Angle (degrees)
RCS (dBsm)
-30
-180 -135 -90 -45 0 45 90 135 180 -20
-10 0 10 20
Measurements Missile
themselves, as mentioned previously. Therefore, the comparison of simulations and measurements may be used simultaneously to better understand and predict the RCS of actual targets.
CONCLUSION
These preliminary results provide some insight into the intricacy to determine the RCS of targets with complex geometry. The results obtained so far indicate that differences will occur and they need to be explained
satisfactorily. Other experiments and simulations will be
carried out to better characterize the RCS of the targets. The outdoor facility for RCS measurements is operational and it will be used to measure the RCS of many types of targets and objects and to characterize the electromagnetic behavior of materials for civilian and military use.
ACKNOWLEDGEMENT
The authors thank the Departamento de Ciência e Tecnologia Aeroespacial (DCTA) and Instituto de
Aeronáutica e Espaço (IAE) for the inancial support.
Mauro Angelo Alves and Mirabel Cerqueira Rezende
also thank CNPq for the inancial support (Proc.
1500048/2010-6, 305478/2009-5).
REFERENCES
Alves, M.A., Peixoto, G.G., and Rezende, M.C., 2007a, “Simulations of the radar cross section of a generic air-to-air missile covered with radar absorbent materials”, Proceedings of the Microwave and
Optoelectronics Conference, IMOC 2007. SBMO/IEEE
MTT-S Internacional, pp. 409-412, Salvador, BA, Brazil. Figure 12: Simulated radar cross section (RCS) of an air-to-air
missile. Metallic surface and surface coated with a radar absorbing material (RAM). Radar frequency of 10 GHz.
Aspect Angle (degrees) RCS (dBsm) -40
-180 -135 -90 -45 0 45 90 135 180 -20
0 20
Measurements Missile
— Metal — RAM
Alves, M.A., Peixoto, G.G. and Rezende, M.C., 2007b,
“Orientation of a support pylon used in radar cross section
measurements”, Proceedings of the Microwave and
Optoelectronics Conference, IMOC 2007. SBMO/IEEE
MTT-S Internacional, pp. 406-408, Salvador, BA, Brazil.
CADRCS, 2007, “CADRCS – Revolutionary PC based software for radar cross section simulation”. Available from: http://www.cadrcs.com
Essen H. et al., 2002, “On the scattering mechanism of power lines at millimeter-waves”, IEEE Transactions on Geosciences and Remote Sensing, Vol. 40, No. 9, pp. 1895-1903. doi: 10.1109/TGRS.2002.805144
Folgueras, L.C., Alves, M.A. and Rezende, M.C., 2010, “Microwave absorbing paints and sheets based on carbonyl iron and polyaniline: measurement and simulation of their properties”, Journal of Aerospace Technology and Management, Vol. 2, No. 1, pp. 63-70. doi: 10.5028/ jatm.2010.02016370
Gama, A.M., 2009, “Comportamento da permissividade e permeabilidade complexas, de 2 a 18 GHz, de absorvedores de micro-ondas à base de ferro carbonila e ferrita de MnZn”, Ph.D. Thesis, Instituto Tecnológico de Aeronáutica, São José dos Campos, SP, Brazil.
Gama, A.M. and Rezende, M.C., 2010, “Complex permeability and permittivity variation of carbonyl iron rubber in the frequency range of 2 to 18 GHz” Journal of Aerospace Technology and Management, Vol. 2, No. 1, pp. 59-62. doi: 10.5028/jatm.2010.02015962
IEEE, 1989, “IEEE Standard Deinitions for Terms for Antennas,” IEEE Trans. On Antennas and Propagation,
Vol. AP-37, pp. 956-966.
Knott, E.F., Schaeffer, J.F., and Tuley, M.T., 1993, “Radar cross section”, Artech House, Boston, USA.
Laverghetta, T.S., 1976, “Microwave measurements and techniques”, Artech House, Dedham, Massachusetts, USA. 560 p.
Peixoto, G. G. et al., 2009, “A medium open range radar cross section facility in Brazil,” PIERS Online, Vol. 5, No. 4, pp. 381-384.
Silva, V.A. et al., 2009, “Comportamento eletromagnético de materiais absorvedores de micro-ondas baseados em
hexaferrita de Ca modiicada com íons CoTi e dopada com