*e-mail: [email protected]
Effect of Operating Conditions on Scrap Tire Pyrolysis
Carla Fabiana Scatolim Rombaldoa, Antonio Carlos Luz Lisbôab,
Manoel Orlando Alvarez Méndeza, Aparecido dos Reis Coutinhoa*
a
School of Chemical Engineering, Methodist University of Piracicaba – UNIMEP,
SP 306, Km 1, 13450-000 Santa Bárbara d’Oeste - SP, Brazil
b
School of Chemical Engineering, State University of Campinas – UNICAMP,
CP 6066, 13083-970 Campinas - SP, Brazil
Received: December 18, 2007; Revised: August 6, 2008
The ever growing focus on environmental issues has raised concerns about scrap tires, whose major component – vulcanized rubber – does not degrade easily. When burned, tires release toxic gases containing substantial amounts of sulfur and ammonia in addition to other pollutants. Dumped on empty city lots, tires are also a breeding ground for mosquitoes. Many proposals have been put forward to handle the disposal of scrap tires, but none of them have proved to offer a definitive solution. The study reported here investigated the production of fuel oil and activated carbon from the pyrolysis of scrap tires. The initial mass of rubber yielded approximately 46% of oil, 40% of activated carbon and 14% of gases. The resulting activated carbon displayed a specific surface area of 200 m2.g−1.
Keywords: scrap tire, pyrolysis, activated carbon
1. Introduction
About 100 million scrap tires are discarded annually in landfills, city lots, rivers and lakes in Brazil, according to Brazil’s National Tire Industry Association (Associação Nacional da Indústria de Pneumáticos – ANIP). Each year, tens of thousands of new tires are manufactured in the country. In 2005, production reached 53.4 mil-lion – about 18 milmil-lion for export. Production figures in the United States and Europe are even higher1.The complex composition of scrap tires hinders their recycling. A tire may be manufactured from diverse kinds of natural and synthetic rubber, including styrene-butadiene polymers2,3.
Pyrolysis of the rubber in scrap tires is one of the most reason-able alternatives in terms of environmental protection. This pyrolysis produces liquid hydrocarbons, gaseous components and a solid residue composed mostly of carbon4,5. Previous investigations have demonstrated that the oil thus produced can be used directly as fuel oil and as a raw material in petrochemical processes6. The gas can be used as fuel gas, while the carbon can be employed as carbon black in gasification processes and as a raw material for the production of activated carbon7,8,9.
The raw material most widely utilized in the production of activated carbon derives from biomass such as wood and sugarcane bagasse. Recently, investigations have focused on producing activated carbon from other sources with high carbon content such as scrap tires, thereby promoting research in the fields of new materials and the environment10,11.
The objective of this investigation was to evaluate the influence of the process parameters of scrap tire pyrolysis, an activation proc-ess, on the production of fuel oil (the liquid fraction) and activated carbon (from the solid residue).
2. Experimental
The raw material, rubber tires, was pyrolyzed at low pressure (vacuum) in an inert atmosphere, and the solid residue was then physi-cally activated. The tests were conducted under different operating
conditions in terms of temperature, pressure, gas flow rates and type of activating gas. The procedure is shown in Figure 1. The experi-mental setup consisted of a stainless steel tubular reactor, a vacuum pump, temperature and gas flow rate controllers, a condenser, and a system to capture the oil.
To identify the effect of the independent variables, three ex-perimental designs were outlined, each with two levels of intensity (−1, +1). Tables 1, 2 and 3 list the investigated variables and their respective levels for each planning.
The levels were chosen based on literature data3,5,6,9 as well as on limitations imposed by the control system.
To characterize the porosity of the activated carbons produced by pyrolysis, the liquid and gas phases were subjected to adsorption analyses. The adsorption isotherm in the gaseous phase (N2 at 77 K) was obtained using a Gas Sorption Analyzer (Quantachrome Corp., NOVA-1200). Methylene blue analyses were carried out to assess the time required to reach adsorption equilibrium.
3. Results and Discussion
Table 4 shows the testing conditions and the respective oil yields from the pyrolysis process. The average oil yield was 46%, which is quite satisfactory considering the availability and low price of the feedstock. Table 5 presents the results of an analysis to identify statistically significant variables, based on the oil yields.
With a confidence level of 95%, the results indicate that all the variables are significant, as are the interactions between temperature and pressure (13) and heating rate and pressure (23). The effect of pressure shows negative figures, for the lower the pressure the higher the oil yield. As for the other variables with positive results, the higher their values the higher the oil yields.
Table 6 shows the operating conditions and results of the steam-activated pyrolysis of the solid residue.
Raw material (Tire)
Particle separation
Pyrolysis
Solid
Activation
Activated carbon Vacum
pump
No condensable
Burning
Controller (temperature, gas flow)
Condensable
Combustible oil Scraping
Figure 1. Block diagram of the experimental procedure.
Table 1. Variables and levels investigated for the pyrolysis process.
Variables Levels
–1 +1
Temperature (°C) 400 600
Heating time (°C/min) 3 8
Pressure (mmHg) 60 760
Table 2. Variables and levels investigated for the steam-activated process.
Variables Levels
–1 0 +1
Temperature (°C) 700 800 900
Activation time (min) 60 120 180
Steam flow rate (mL/min) 500 750 1000
Table 3. Variables and levels investigated for the CO2-activated process.
Variables Levels
–1 0 +1
Temperature (°C) 600 750 900
Heating time (°C/min) 5 12.5 20
CO2 flow rate (mL/min) 80 140 200
Activation time (min) 30 105 180
Table 6. Test conditions and results for activated carbon yield (ηca) and specific surface area (SSA) obtained with the steam-activated process.
Test Temperature
(°C)
Activation time (min)
Steam Flow rate (mL/min)
ηca (%)
SSA (m2.g–1)
S1 –1 –1 –1 40.7 79
S2 +1 –1 –1 38.5 98
S3 –1 +1 –1 40.4 81
S4 +1 +1 –1 35.8 195
S5 –1 –1 +1 40.4 84
S6 +1 –1 +1 37.7 126
S7 –1 +1 +1 39.8 87
S8 +1 +1 +1 34.8 212
S9 0 0 0 39.0 94
S10 0 0 0 39.1 96
S11 0 0 0 39.0 97
Table 4. Test condition and results of oil yield (ηo) from the pyrolysis
process.
Temperature (°C)
Heating rate (°C/min)
Pressure (mmHg)
ηo (%)
–1 –1 –1 44.0
–1 –1 –1 45.6
+1 –1 –1 53.0
+1 –1 –1 52.2
–1 +1 –1 50.5
–1 +1 –1 48.6
+1 +1 –1 51.7
+1 +1 –1 51.4
–1 –1 +1 35.0
–1 –1 +1 30.3
+1 –1 +1 42.0
+1 –1 +1 46.8
–1 +1 +1 44.6
–1 +1 +1 41.7
+1 +1 +1 50.7
+1 +1 +1 51.4
Table 5. Statistical treatment of oil yield from the pyrolysis process. Effect Std.
error
Confidence interval
–95% +95%
Principal factor
1 (Temperature) 8.23 1.04 5.84 1.62
2 (Heating Rate) 4.34 1.04 1.95 6.72
3 (Pressure) –7.70 1.04 –10.08 –5.31
Interaction of two factors
12 –1.52 1.04 –3.91 0.87
13 3.34 1.04 0.95 5.73
23 –2.50 1.04 0.11 4.88
Interaction of three factors
variables, reaching 212 m2.g−1. This condition therefore resulted in the lowest yield, for the higher the residence time and temperature, the more material is consumed. Table 7 lists statistically significant variables of the steam-activated process.
As can be seen in Table 7, all the variables and the interactions between temperature and activation time (12) and temperature and flow rate (13) are significant at a confidence level of 95%. All results are positive, indicating that the higher the values of the variables (tem-perature, activation time and flow rate) the higher the specific surface area of the resulting activated carbon. Table 8 shows the operating conditions and the results obtained with CO2 activation.
Again, the values in Table 8 indicate that the highest specific surface area (169 m2.g−1) was obtained with the highest variables except for the heating rate, which showed the lowest yield, although even this variable resulted in an interesting value (35%) considering the cost of the feedstock. A comparison of these results against those obtained with steam reveals very similar values. Table 9 presents the statistical treatment of the yield from the CO2-activated process.
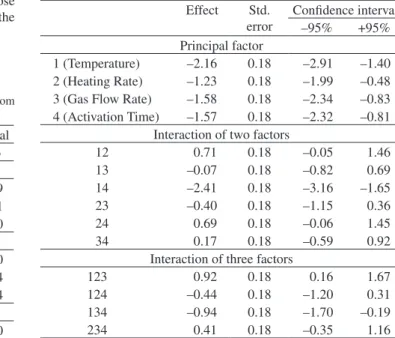
As can be seen in Table 9, all the variables, as well as the interac-tions between temperature and time (14), temperature, heating rate and flow rate (123), and temperature, flow rate and time (134), are statistically significant. The variable of temperature shows the lowest value. All the values are negative, indicating that the lower the variable the higher the yield of activated carbon. Table 10 presents statistical data on the specific surface area of the CO2-activated carbon.
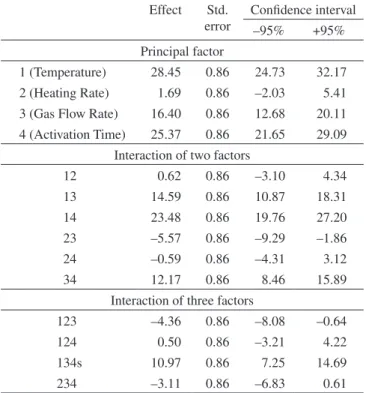
An analysis of Table 10 leads to the conclusion that only the heating rate and the interactions between temperature and heating rate (12), and heating rate and time (24), are not statistically significant at a confidence limit of 95%. Once more, the variable presenting the
Table 7. Statistical treatment of specific surface area (SSA) resulting from the steam-activated process.
Effect Std. error
Confidence interval
–95% +95%
Principal factor
1 (Temperature) 74.77 1.72 67.35 82.19
2 (Activation Time) 46.79 1.72 39.37 54.21
3 (Steam flow rate) 13.98 1.72 6.56 21.40
Interaction of two factors
12 44.59 1.72 37.18 52.00
13 8.82 1.72 1.40 16.24
23 –2.27 1.72 –9.69 5.14
Interaction of three factors
123 –3.22 1.72 –10.64 4.20
Table 8. Test conditions and results for activated carbon yield (ηca) and specific surface area (SSA) obtained in the CO2-activated process.
Test Temperature
(°C)
Heating rate (°C/min)
Gas flow rate (mL/min)
Activation time (min)
ηca (%)
SSA (m2.g–1)
C1 –1 –1 –1 –1 41.7 78
C2 +1 –1 –1 –1 41.5 79
C3 –1 +1 –1 –1 41.0 82
C4 +1 +1 –1 –1 39.9 84
C5 –1 –1 +1 –1 41.4 81
C6 +1 –1 +1 –1 39.8 90
C7 +1 +1 +1 –1 39.8 89
C8 –1 +1 +1 –1 36.0 81
C9 –1 –1 –1 +1 41.3 81
C10 +1 –1 –1 +1 37.8 98
C11 –1 +1 –1 +1 40.8 81
C12 +1 +1 –1 +1 37.2 117
C13 +1 –1 +1 +1 35.1 169
C14 –1 –1 +1 +1 41.2 84
C15 +1 +1 +1 +1 35.1 154
C16 –1 +1 +1 +1 40.1 84
C17 0 0 0 0 40.9 82
C18 0 0 0 0 40.2 85
C19 0 0 0 0 40.5 84
Table 9. Statistical treatment of activated carbon yield from the CO2-activated
process.
Effect Std. error
Confidence interval
–95% +95%
Principal factor
1 (Temperature) –2.16 0.18 –2.91 –1.40
2 (Heating Rate) –1.23 0.18 –1.99 –0.48
3 (Gas Flow Rate) –1.58 0.18 –2.34 –0.83
4 (Activation Time) –1.57 0.18 –2.32 –0.81
Interaction of two factors
12 0.71 0.18 –0.05 1.46
13 –0.07 0.18 –0.82 0.69
14 –2.41 0.18 –3.16 –1.65
23 –0.40 0.18 –1.15 0.36
24 0.69 0.18 –0.06 1.45
34 0.17 0.18 –0.59 0.92
Interaction of three factors
123 0.92 0.18 0.16 1.67
124 –0.44 0.18 –1.20 0.31
134 –0.94 0.18 –1.70 –0.19
strongest effect is temperature, with a positive value, indicating that the higher the temperature the larger the specific surface area.
Figure 2 shows isotherms obtained for four samples of scrap tire-derived carbon activated by two agents, i.e., steam (S1: 80 m2.g−1 and S8: 212 m2.g−1) and CO
2 (C13: 169 m
2.g−1 and C1: 78 m2.g−1),
which are the highest and lowest values of specific surface area for each activating agent.
Figure 2 indicates that all the isotherms are classified as type IV,12,13 which presents a linear region above 0.3 of relative pres-sure, indicating the occurrence of multiple layer adsorptions on the carbon surface. At a relative pressure exceeding 0.7, the capillary condensation in the meso- and macropores began changing the slope of the adsorption isotherm. Figure 2 also indicates that the isotherms present a type 1 hysteresis characterized by two almost parallel paths, which is typical of porous materials composed of rigid spherical particles of homogeneous size. The most suitable porous model to describe this situation is usually the cylindrical pore model, which is open at the two ends. Figure 3 shows the adsorption kinetics of four activated carbon samples: C13, C1, S1 and S8.
Figure 3 indicates that the CO2-activated samples displayed longer equilibrium times than the steam-activated samples. This difference is attributed to the activation process, since the steam-activated samples produce activated carbons containing more micropores (smaller than 2 nm) that are more easily saturated by the methylene blue molecule, which is larger than 2 nm. The CO2-activated samples have more numerous mesopores (between 2 nm and 50 nm) resulting from a strong oxidizing action, which increases the area available for adsorption. Figures 2 and 3 indicate that although sample S8 has a greater capacity for nitrogen adsorption than sample C1, both have the same capacity for methylene blue adsorption. This is ascribed to the fact that the nitrogen molecule is about the same size as the micropores, and therefore all the available surface area is used for adsorption, while the methylene blue adsorption occurs only in the available mesopores.
4. Conclusions
In this study, fuel oil and activated carbon were produced from scrap tires. The activated carbon showed properties similar to that of the commercial product, with a surface area exceeding 200 m2.g−1. The parameter exerting the strongest influence on the activation process was temperature, i.e., the higher the temperature the larger the surface area of the activated carbon.
As for the pyrolysis process, the higher the temperature and the lower the pressure the higher the fuel oil yield. No information was obtained with respect to the heating value and the quality of the oil. Pyrolysis proved to be a feasible alternative to handle the problem of scrap tire disposal. The process yielded 46% of oil, 40% of activated carbon and 14% of gases, which can be used as a source of heat in the pyrolysis process.
References
1. Díez C, Sánchez ME, Haxaire P, Martínez O, Morán A. Pyrolysis of tires: Acomparison of the results from a fixed-bed laboratory reactor and a pilot plant (rotary reactor). Journal of Analytical and Applied Pyrolysis 2005; 74(1-2):254-258.
Table 10. Statistical treatment of specific surface area obtained in the CO2 -activated process.
Effect Std. error
Confidence interval
–95% +95%
Principal factor
1 (Temperature) 28.45 0.86 24.73 32.17
2 (Heating Rate) 1.69 0.86 –2.03 5.41
3 (Gas Flow Rate) 16.40 0.86 12.68 20.11
4 (Activation Time) 25.37 0.86 21.65 29.09
Interaction of two factors
12 0.62 0.86 –3.10 4.34
13 14.59 0.86 10.87 18.31
14 23.48 0.86 19.76 27.20
23 –5.57 0.86 –9.29 –1.86
24 –0.59 0.86 –4.31 3.12
34 12.17 0.86 8.46 15.89
Interaction of three factors
123 –4.36 0.86 –8.08 –0.64
124 0.50 0.86 –3.21 4.22
134s 10.97 0.86 7.25 14.69
234 –3.11 0.86 –6.83 0.61
Relative pressure (P/P0)
0.0 0.2 0.4 0.6 0.8 1.0
Adsorbed v
olume (cm
3.g 1)
10 100
S8 S1 C1 C13
Figure 2. Adsorption/Desorption isotherms for nitrogen at 77 K.
Time (minutes)
Adsorbed mass (g)
0 20 40 60 80 100
0.00 0.04 0.08 0.12 0.16 0.20
C13 C1 S1 S8
2. Cunliffe AM, Williams PT. Composition of oils derived from the batch pyrolysis of tyres. Journal of Analytical and Applied Pyrolysis 1998; 44(2):131-152.
3. Zabaniotou AA, Stavropoulos G. Pyrolysis of used tires and residual char utilization. Journal of Analytical and Applied Pyrolysis 2003; 70(2):711-722.
4. Díez C, Martinez O, Calvi LF, Cara J, Morán A. Pyrolysis of tyres. Influence of the final temperature of the process on emissions and the calorific value of the products recovered. Waste Management 2004; 24(5):463-469.
5. Mui ELK, Ko DCK, McKay G. Production of active carbons from waste tyres – a review. Carbon 2004; 42(14):2789-2805.
6. Rodriguez IM, Laresgoiti MF, Cabrero MA, Torres A, Chomón MJ, Caballero B. Pyrolysis of scrap tyres. Fuel Processing Technology 2001; 72:9-22.
7. Laresgoiti MF, Caballero BM, Marco I, Torres A, Cabrero MA, Chomón MJ. Characterization of the Liquid Products Obtained on Tyre Pyrolysis. Journal of Analytical and Applied Pyrolysis 2001; 71(2):917-934.
8. Miguel GS, Fowler GD, Sollars CJ. A study of the characteristics of activated carbons produced by steam and dioxide activation of waste tyre rubber. Carbon 2003; 41(5):1009-10016.
9. Cui H, Yang J, Liu Z. Thermogravimetric analysis of two Chinese used tires. Termochimica Acta 1999; 333(2):173-175.
10. Roy C, Chaala A, Darmstadt H. The Vacuum pyrolysis of used tires end-used for oil and carbon black products. Journal of Analytical and Applied Pyrolysis 1999; 51(1-2):201-221.
11. Roy C, Darmstadt H, Benallal B, Amen-Chen C. Characterization of naphtha and carbon black obtained by vacuum pyrolysis of polyisoprene rubber. Fuel processing Technology 1997; 50(1):87-103.
12. Dubinin MM. Porous Structure and Adsorption Properties of Activated Carbons. In Chemistry and Physics of Carbon/A Series of Advances. Marcel Dekker Inc.; 1965. p. 51-120.