ISSN 0104-6632 Printed in Brazil
www.abeq.org.br/bjche
Vol. 22, No. 02, pp. 209 - 216, April - June, 2005
Brazilian Journal
of Chemical
Engineering
DRYING AND SHRINKAGE OF POLYMER GELS
S. S. Waje
1, M. W. Meshram
1, V. Chaudhary
2, R. Pandey
2,
P. A. Mahanawar
2and B. N. Thorat
1*1
Chemical Engineering Division, University Institute of Chemical Technology, University of Mumbai, Phone: +(91) (22) 2414-5616 (Ext. 289), Fax: +(91) (22) 2414-5614, Mumbai, 400 019, India.
E-mail: [email protected], (Dr. B. N. Thorat)
2
Division of Polymer Engineering and Paint Technology, University Institute of Chemical Technology, University of Mumbai, Mumbai, 400 019, India.
(Received: October 20, 2004 ; Accepted: November 20, 2004)
Abstract - The polymer hydrogel was synthesized by photo-polymerization process (UV light, 60 OC) in presence of Photo-initiator (IrgacureR) and Cross-linker (NN’-methylene bisacrylamide; MBAM). In the present work, the drying of polymer hydrogel was carried out to study the effect of temperature, gel-sheet thickness, monomer ratio of acryl acid to acrylamide (AA/AM), concentration of MBAM and quantity of monomers. A correlation has been developed for modified sheet thickness as a function of contraction coefficient and degree of drying. Effective diffusivity was estimated from Fickian-diffusive model considering modified sheet thickness and was found to be in the range of 1.1 × 10⁻¹⁰-5.93 × 10⁻¹⁰ m2/s. The activation energy obtained using Arrhenius type equation was found to be in the range of 2979-10737 kJ/kmol H2O. The drying behavior shows an initial shoot-up in drying rate followed by constant rate and two falling
rate periods.
Keywords: Polymer gel; Drying characteristics; Diffusion coefficient; Modified gel thickness; Contraction coefficient.
INTRODUCTION
Hydrogels, which are crosslinked hydrophilic polymers, are used in the areas like biotechnology, medicine, pharmacy, agriculture, food industry and others. The hydrophilicity of hydrogels is attributed to the presence of hydrophilic functional groups such as alcohols, carboxylic acid, and amides. The understanding of the phenomena occurring in the drying of these hydrogels is necessary for the designing of the entire process. Drying of hygroscopic solids is generally known to be a complex process because of simultaneous heat and mass transfer and variable physical properties of the materials (Hawlader, 1996). Polymers and gels are highly hygroscopic and shrinking colloidal materials and the drying of these encompass many fields of technology. The quantity of bound water associated with polymer varies as per the internal structure of
the macromolecule. Monomer and cross-linking agent proportions are responsible for both the porous structure and the pore size of the gel. An acrylamide-derived gel is a cross-linked network of polymer whose molecular weight is fairly high; it can absorb solvent (water), but is itself insoluble.
Recently approximate models have been used by Coumans (2000) to predict the drying kinetics for slab geometry. Diffusion coefficient in polymer/solvent system over a wide range of concentrations and temperatures can be obtained by using a “free volume theory” of Vrentas and Duda (1979). In the present work, drying of acrylic acid-acrylamide copolymer was carried out under various operating conditions. The drying data has been analyzed using Bonazzi and Ripoche (1996) model with altercations in modified gel thickness which is a strong function of gel moisture content. Conventionally, the gel thickness is given in terms of dry gel thickness and average moisture content is related by contraction coefficient. This is given by Eq. (1) as, (Bonazzi and Ripoche, 1996; Gehrmann and Kast, 1978)
(
)
dry
Z=Z 1+ εX (1)
Where, Z, ε and X are the gel thickness at any time, coefficient of contraction and moisture content respectively. However, it is difficult to know Zdry apriori and therefore, we propose the following Eq. (2) to relate the gel thickness with the initial gel thickness and degree of drying (which can be easily obtained during the course of experiments).
(
)
o
Z=Z 1− εDd (2)
Where, Dd is the degree of drying (discussed later).
MATERIALS
Acrylic acid (AA), acrylamide (AM) and methyl methacrylate (MMA) (Wardhaman Polymers Ltd., Mumbai, India.) used were of technical grade. IrgacureR (Ciba specialty chemicals Inc., Mumbai, India) was of analytical grade, while NN’-methylene bisacrylamide was prepared in the laboratory. Potassium hydroxide (s. d. fine chemicals, Mumbai, India) was of commercial grade. Distilled water was used for sample preparation.
EXPERIMENTALS
The copolymer gel was synthesized using photo-polymerization process. Drying experiments were carried out in a vacuum tray dryer where the temperature and vacuum could be maintained
independently. For drying experiments nine samples were prepared (Table 1) to study the effect of temperature (samples 1-3), initial sheet thickness (samples 2, 4, 5), concentration of cross-linker (samples 2, 6, 7) and the monomer ratio (AA/AM) (samples 2, 8 9). The experiments were carried out at 80-120 OC, 4-8 mm sheet thickness, 0.156-0.312% MBAM concentration based on AA and 30/70-70/30 (%) monomer molar ratio. The data of moisture removed with respect to time was used to evaluate the drying characteristics. The initial and final sheet thickness was measured to find out the contraction coefficient.
RESULTS AND DISCUSSION
Drying Characteristics
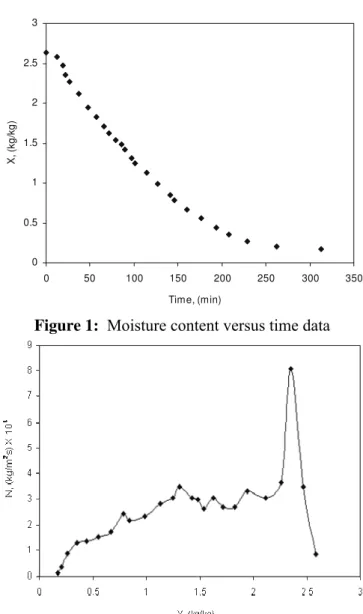
The drying characteristics of the gel were evaluated from the data of moisture removed with respect to time. Figure (1) shows the plot of moisture content versus time, from which the drying curve was plotted by using Eq. (3) as,
w dX N
A dt
= − (3)
Where, N, w, A and t are the drying rate, bone-dry gel weight, surface area for bone-drying and bone-drying time respectively. Figure (2) shows a typical drying curve (sample 2) at 20 mm Hg. It can be seen that the drying curve consists of an initial shoot-up followed by a wavy constant drying period and two falling rate periods. Since, the formation of crust after some time at the surface of the gel during the drying leads to decrease in the drying rate in the early stages. In the constant rate period, the concentration gradient, dX
dZ, required for the
0 0.5 1 1.5 2 2.5 3
0 50 100 150 200 250 300 350
Time, (min)
X,
(
k
g
/k
g
)
Figure 1: Moisture content versus time data
Figure 2: Characteristic Drying Curve
Moisture Effective Diffusivity and Drying Rate
The drying rate was calculated from the experimental data of moisture removed versus time by using Eq. (3). The drying rate was then used to calculate the moisture effective diffusivity by applying Fick’s law with modified sheet thickness (Z), (discussed later) as,
s eff dX
N ρ D
dZ
= − (4)
Where, ρs and Deff are the true polymer density and effective moisture diffusivity respectively. From Table 1, it can be seen that the moisture diffusion coefficient and hence the drying rate increases with an increase in the drying temperature from 80 OC to 120 OC. The relationship between the effective
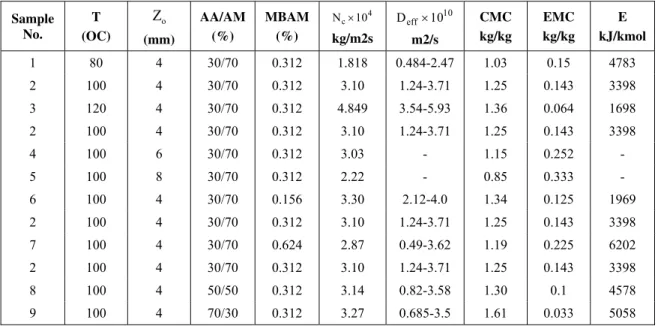
Table 1: Effect of Temperature (T), initial sheet thickness (Zo), monomer ratio of AA/AM and % crosslinker (MBAM) on Nc, Deff, CMC, EMC and activation energy.
Sample No.
T (OC)
o
Z
(mm)
AA/AM (%)
MBAM (%)
4 c
N ×10
kg/m2s
10 eff
D ×10
m2/s
CMC kg/kg
EMC kg/kg
E kJ/kmol
1 80 4 30/70 0.312 1.818 0.484-2.47 1.03 0.15 4783
2 100 4 30/70 0.312 3.10 1.24-3.71 1.25 0.143 3398
3 120 4 30/70 0.312 4.849 3.54-5.93 1.36 0.064 1698
2 100 4 30/70 0.312 3.10 1.24-3.71 1.25 0.143 3398
4 100 6 30/70 0.312 3.03 - 1.15 0.252 -
5 100 8 30/70 0.312 2.22 - 0.85 0.333 -
6 100 4 30/70 0.156 3.30 2.12-4.0 1.34 0.125 1969
2 100 4 30/70 0.312 3.10 1.24-3.71 1.25 0.143 3398
7 100 4 30/70 0.624 2.87 0.49-3.62 1.19 0.225 6202
2 100 4 30/70 0.312 3.10 1.24-3.71 1.25 0.143 3398
8 100 4 50/50 0.312 3.14 0.82-3.58 1.30 0.1 4578
9 100 4 70/30 0.312 3.27 0.685-3.5 1.61 0.033 5058
Critical Moisture Content (CMC) and Equilibrium Moisture Content (EMC)
CMC can be obtained from the drying rate curve. An empirical approximation (Gehrmann and Kast, 1978) of the drying rate curve was used to confirm the obtained values of CMC. This approximation states that if the product of drying rate and slab thickness (which depends on moisture content) referred to the data of the constant rate period is
plotted versus average moisture content (X) normalized with CMC (Xc), the results is a relationship with two nearly linear portions, divided by a slight break in the curve at
c
X 1.
X =
The first
linear part of the curve is due to the proportionality of the sample thickness to average moisture content X while the drying rate during the first drying period is constant. Figure (3) shows this approximation for sample 4.
Table 1 shows the effect of drying temperature on the CMC and EMC. It was observed that CMC increases and EMC decreases with an increase in drying temperature. High constant drying rate at higher temperature develops a steep concentration profile within the solid. During low-intensive evaporation of moisture (corresponding to low drying temperature) from the surface of the material, major part of moisture will migrate to the surface layer of evaporation before reaching the level of EMC. In this case, the moisture content profile in the material appears more equalized and therefore CMC is lower. The effect of cross-linker concentration on CMC and EMC is given in Table 1. It can be seen that CMC decreases and EMC increases with an increase in concentration of cross-linker. The probable reason for this observation is that increased concentration of MBAM harden the gel material which results into decrease in the drying rate and hence the CMC. Also because of the increase in cross-linking density of copolymer, most of the moisture trapped inside the cross-linked polymer chain inhibits lower vapour pressure, which results into an increase in EMC. Table 1 also shows that both CMC increases and EMC decreases with an increase in AA/AM form 30/70 to 70/30. It is also seen that CMC decreases and EMC increases with an increase in the gel thickness from 4 to 8mm. As the thickness of the gel material in the tray increases, there exists a temperature profile inside the material. The temperature of material surface is same as the heating medium and decreases with distance from the surface towards the center of the material. Also the moisture at the bottom of the tray has lot of diffusional resistances and it increases with an increase in the thickness of the gel material.
Modified Gel Thickness (Z)
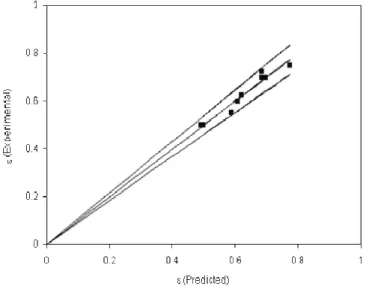
As copolymer gel shrinks during drying, the thickness through which the moisture diffused also changes with moisture content. Therefore, in order to calculate the correct values of the diffusion coefficient, the variation of gel thickness with moisture content and hence the degree of drying must be taken into account. The extent of contraction of gel depends on the drying temperature, monomer ratio, cross-linker concentration and initial gel thickness. For all the samples, the extent of contraction (hereafter, contraction coefficient,
ε
) was measured and a correlation was developed, Eq. (5). For the given experimental conditions (drying temperature, T; MBAM concentration, C; monomer ratio, R and initial gel sheet thickness, Zo etc.), the contraction coefficient varied in the range of 0.5-0.77. Figure (4) shows the parity plot between the correlation and the experimental results.0.075 0.8196 0.175 0.243
o
0.0107 T R C− Z
ε = × (5)
The modified length (Z) has been calculated by using contraction coefficient (
ε
), degree of drying (D
d) and initial gel sheet thickness (Z
o) as in Eq. (2). Where the degree of drying (D
d) is given as,d o X D
X
= (6)
Where, Xo is the initial moisture content.
Activation Energy (E)
The activation energy can be calculated with the help of Arrhenius type equation:
( ) ( )
( )X 1 1
E
R T
X , T o X
D D e
−
= (7)
Where, Do is the moisture diffusivity at constant drying period and E is the activation energy for moisture diffusion. Figure (5) shows the plot of activation energy versus average moisture content. The values have been tabulated in Table 1. The activation energy of diffusion for all the samples obtained was found to be in the range of 2979-10737 kJ/kmol H2O.
Porosity (φ) of the Dried Material Sheet
Calculation of the porosity is based on the assumptions that the volume of solid phase is constant and that the volume of the solid phase (
V
s), the liquid phase (V
m) and the void (V
c) are additive quantities expressed as:T s m
V =V +V +Vc (8)
The creation of void volume and hence the porosity of the sheet depends on the drying conditions and system parameters. Figure (5) shows that the increase in the porosity of sheet as the drying proceeds. Figure (6) shows the porous structure of the dried sheet.
Figure 5: Activation energy and Porosity as a function of moisture content
Pore
True Density of Polymer Sheet
From Figure (7) it can be seen the true density of polymer sheet increases as drying proceeds. During the drying the solid mass compactness resulting into increase in the true density of the sheet provided that the assumption, the volumes of cavities, moisture and solid are additive is valid.
Identification of Shrinkage Behavior
A physical model describing the volume reduction factor (
α
) to identify the shrinkage behavior of the polymer gels is given as below,c ∆V α 1
∆V( w )
= +
< > (9)
Where ∆VC and ∆V(<w>) are void volume and volume of the sheet at average moisture content <w> respectively. Figure (7) also shows the plot of reduction factor (
α
) versus average moisture content (X). It is observed that α increases with decrease in moisture content. This indicates that the volume of cavities formed increases as drying proceeds. It was observed that initially the value ofα
is close to one and as drying proceeds α deviates from unity and hence non-ideal shrinkage behavior of the gel.Figure 7: Reduction factor and true density of a co-polymer gel as a function of moisture content
CONCLUSIONS
The drying behavior of hydrogel has been characterized in terms of CMC, EMC, effective diffusion coefficient, activation energy and shrinkage behavior. It can be concluded that the shrinkage of the polymer gel is non-ideal. As poly (AA-co-AM) hydrogel with higher monomer ratio of AA/AM and MBAM concentration retain more water hence can be used as water retainer in various applications in pharmaceuticals, health care products. Effect of crosslinker has been found to be more significant with respect to drying kinetics.
ACKNOWLEDGEMENT
We gratefully acknowledge UGC, New Delhi,
India for their financial support.
NOMENCLATURE
A drying surface area (m2) C concentration of cross-linker (wt %) Dd degree of drying (-) D diffusion coefficient (m2/s) E activation energy (J/mol) N drying rate (kg/m2.s)
R monomer ratio (AA/AM)
R universal gas constant in Eq. (7) (-) T drying temperature (K)
t drying time (s)
V volume (m3)
X moisture content (kg/kg) Z polymer gel thickness (m)
Greek Letters
α reduction factor (-)
ε contraction coefficient (-)
ρ density (kg/m3)
Subscripts
c critical or constant (-)
m liquid phase (-)
o initial (-)
s solid phase (-)
T total (-)
w water (-)
REFERENCES
Bonazzi, C. and Ripoche, A., Moisture diffusion in gelatin slabs by modeling drying kinetics, Proceedings of the 10th International
Drying-Symposium, Vol. A, p. 235 (1996).
Coumans, W. J., Models for drying kinetics based on drying curves of slabs, Chemical Engineering Processing, 39, p. 53 (2000).
Gehrmann, D. and Kast, W., Drying of gels, Proceedings of the 1st International Drying-Symposium, p. 239 (1978).
Hawlader, M. N. A., Ho, J. C. and Qing Z., Temperature and moisture distribution within materials undergoing shrinkage during drying, Proceedings of the 10th International Drying-Symposium, Vol. A, p. 120 (1996).
Jomma, W., Aregba, W., Puiggali, J. R. and Quintard, M., Drying of highly shrinking products: application to gels, Drying 91, p. 110 (1991).
Okos, M. R., Nasimhan, G., Singh, R. K. and Wietman, A. C., Food dehydration, p. 437, in D.R. Heldman and D.B. Lund (ed.) Handbook of Food Engineering, Marcel Dekker, Inc., New York (1992).
Vrentas, J. S. and Duda, J. L., Molecular diffusion in polymer solutions, AIChE J, Vol. 25, No. 1, p. 1 (1979).