of Chemical
Engineering
ISSN 0104-6632 Printed in Brazil www.scielo.br/bjce
Vol. 35, No. 02, pp. 709 - 720, April - June, 2018 dx.doi.org/10.1590/0104-6632.20180352s20160659
PREPARATION OF MICRON-SIZED DROPLETS
AND THEIR HYDRODYNAMIC BEHAVIOR IN
QUIESCENT WATER
Chaojun Deng
1,2, Weixing Huang
1*, Haoyuan Wang
1, Shimeng Cheng
1,
Xiongyuan He
1and Boya Xu
11 School of Chemical Engineering, Sichuan University, Chengdu, 610065, P. R. China 2 Nuclear Power Institute of China, Chengdu, 610041, P.R. China
(Submitted: November 25, 2015; Revised: May 1, 2017; Accepted: May 1, 2017)
Abstract -To study the hydrodynamics of rising droplets (especially less than 1 mm) in quiescent water, a
microfluidic device with co-flowing configuration was integrated to prepare micron-sized droplets. Soybean oil and toluene droplets of size from 100 to 600 μm were obtained by five co-flowing devices with different capillary sizes. It is found that the capillary device with smaller tip size produces smaller droplets and, for a given device, the droplet size decreases with the increase of continuous phase flow rate. Alternatively, the increase of dispersed phase flow rate has little influence on the droplet size. To predict the droplet size, a correlation for dimensionless droplet diameter as a function of Capillary number (Ca), Reynolds number (Re) and viscosity ratio was proposed. Then, the hydrodynamics of a single droplet and of droplet swarms rising in quiescent water were extensively investigated. The experimental results show that the terminal velocity of a single micro-droplet is consistent with that of rigid spheres with the same size and density, while the terminal velocity of a droplet swarm is obviously higher than that of a single droplet. Experimental observation shows that the motion of a droplet swarm in static water is such a manner that each droplet alternately accelerates by chasing others, causing a higher terminal velocity. Furthermore, the terminal velocities of millimeter-sized toluene droplets rising in water were measured. Compared with rigid spheres, the droplets of dp=1~4.6 mm have higher terminal velocities, while the droplets of dp>4.6 mm have lower terminal velocities. Finally, by taking into account the interfacial tension, internal circulation and shape deformation, a comprehensive explanation is proposed to describe the variation of the drag coefficient with the droplet size ranging from microns to millimeters.
Keywords: Microfluidics, Micron-sized droplet, Hydrodynamics, Terminal velocity.
INTRODUCTION
In chemical and biomedical processes, it is common to encounter the problems related to the motion of droplets and bubbles in a continuous phase, such as in bubble reactors, liquid-liquid separators and extraction contactors where mass and heat transfers or reactions between the dispersed drops and continuous
phase are often control steps (Clift et al., 1978; Duangsuwan et al., 2010; Li and Mao, 2001; Liu et al., 2015; Premlata et al., 2015; Premlata et al., 2017; Wegener et al., 2014). To study these problems, a full understanding of the hydrodynamic behavior of drops moving in a continuous phase is primarily important.
Over the past few decades, plenty of experiments and numerical simulations have been carried out to
710 Chaojun Deng, Weixing Huang, Haoyuan Wang, Shimeng Cheng, Xiongyuan He and Boya Xu
investigate the fluid dynamics of particles, bubbles
and droplets in a stagnant liquid (Grace et al., 1976; Liu et al., 2015; Kelbaliyev and Ceylan, 2007; Peters
et al., 2014; Tomiyama et al., 2002; Tripathi et al., 2014; Tripathi et al., 2015; Wegener et al., 2010). Most of these studies focus on the simplest case in which a single isolate particle freely settles or rise in the quiescent liquid, which certainly promotes the comprehension for more sophisticated multi-particle systems.
Clift et al. (1978) summarized numerous earlier experiment data of bubbles, drops and particles and presented many empirical correlations and graphs for
predicting the drag coefficient and terminal velocity of a rigid sphere, fluid particle and non-spherical particle
over a broad range of Reynolds numbers. Their research demonstrated that the terminal velocity of a
fluid particle depends on more factors than that of a
rigid sphere, such as shape deformation and oscillation, internal circulation, the purity of the system, as well as the concentration of surfactant.
Myint et al. (2006) measured the terminal velocity of a single silicon oil droplet rising through glycerol-water solution under a range of Re (0.17< Re< 200)
to study the influences of surfactants and the viscosity
ratio of the dispersed phase to continuous phase (γ
=0.1-100) on the terminal velocity and drag coefficient
of the droplets. They found that the terminal velocity of the contaminated droplet is obviously lower than that of a clean droplet, and surfactants increased the drag
coefficient, but the increase of drag coefficient became
smaller as the viscosity ratio increased. The presence of surfactants weakened and hindered the interfacial
motion, causing the drag coefficient to increase, which
was also proposed by Clift et al. (1978).
Wegener et al. (2007) experimentally investigated single toluene droplets of size from 1 to 3 mm rising in water. For the droplets without adding any solute, the droplets smaller than 2 mm immediately accelerate to their constant terminal velocities, but the droplets greater than 2 mm show a distinct behavior: after acceleration to a certain pseudo-terminal velocity, the velocity will reduce and oscillate around a lower value than the velocity calculated from the equation of motion due to the shape deformation causing a
higher drag coefficient. The droplets of 2 mm with
added solute accelerate to a pseudo-terminal velocity between the velocity of a rigid sphere and a droplet with freely moving interface. They involved mass transfer
between the droplet and the surrounding fluid, giving rise to the effect of Marangoni convection, which
hinders the internal circulation inside the droplet.
Wegener et al. (2010) measured transient and terminal velocities of toluene droplets of size from 1.0 to 7.0 mm rising in water. Small droplets (< 2.2 mm) accelerate to the terminal velocity in less than one second from a standstill and then remain constant. However, after attaining a maximum, the velocity of droplets larger than 2.2 mm decreases rapidly and oscillates around a lower value, which indicates that
significant shape deformation and oscillation occur.
Besides, two distinct terminal rise velocities of droplets with a diameter of 3 mm were observed, which may be related to the initial shape deformation of the drops (Tomiyama et al., 2002). Wegener proposed a semi-empirical correlation for pure systems to predict the terminal velocity of a single droplet based on the correlation by Grace et al. (1976). The results verify
Grace’s viewpoint that droplets in a purified system
tend to travel faster than in a normal or contaminated system.
Rao et al. (2014) investigated the effect of
surfactant concentration on the dynamic behavior of a single crude oil droplet ranging from 3 to 8.5 mm rising in quiescent water. They found that the droplet at a high surfactant concentration undergoes
significant wobbling and oscillations, leading to rising velocity fluctuations and the mean velocity of a
particular diameter droplet decreases with the increase of surfactant concentration under the condition of 200 < Re < 900.
Recently Tripathi et al. (2014) numerically studied
the difference between a falling droplet and a rising
bubble. They found that the density plays a dominant role in the dynamics of droplets and bubbles. When
the density ratio of the droplet to its surrounding fluid
is close to unity, a falling droplet becomes equivalent to a rising bubble for small or moderate inertia and surface tension. However, when the density ratio is far from unity, the dynamics of a droplet and a bubble are
quite different due to the tendency for vorticity to be concentrated in the lighter fluid, eventually causing
a thicker doughnut-shaped bubble and a thinner bag-shaped droplet.
To date, abundant studies focus on the dynamic behaviors of a single droplet of a few millimeters in
size in stagnant fluids, but few focus on micron-sized
results in a wide size distribution (Peters et al., 2014; Ulmeanu, 2008). On the other hand, the multi-droplet system, such as a droplet swarm moving in liquids, is very common in the actual process, but a deep understanding of the complex mechanism of droplet swarm motion on the micrometer scale has not yet been reached.
In this paper, monodisperse micro-droplets with
controllable size were prepared by using five self-made co-flowing microfluidic devices. The effects of the operating parameters (i.e. two phase flow rates)
and the device dimension on the droplet size were studied by experiment. Moreover, a correlation of dimensionless droplet diameter with the viscosity ratio, Capillary number and Reynolds number was proposed for predicting and producing droplets with the desired sizes. Then, the hydrodynamics of single drops and swarms of micron-sized oil and toluene droplets rising in quiescent water were extensively investigated. Further, the terminal velocities of millimeter-sized toluene droplets rising in water were measured. The hydrodynamic behaviors of single droplets rising in stagnant water were summarized based on the
explanation of the variation of drag coefficient with the
droplet diameter varying from microns to millimeters.
DROPLET PREPARATION
Microfluidic device and preparation method of micron-sized droplets
Conventional preparation methods, involving
emulsification, droplet extraction and mechanical
stirring, usually produce droplets of a few millimeters or larger in size with a wide size distribution. To prepare uniform-sized micro-droplets in a good
controllable and reproducible manner, a microfluidic
technique was taken into account, which has been increasingly developed and utilized in micro-coolers, micro-reactors, micro-electronics and so on in recent years (Castro-Hernandez et al., 2009; Dreyfus
et al., 2003; Wang et al., 2013). Five self-made
co-flowing microfluidic devices were fabricated by
capillary assembly. Each device consisted of two glass capillaries, one square glass tube and a syringe needle. One of the capillaries is used as an injecting tube for the dispersed phase and the other one is used as a receiving capillary for conveying the dispersed
droplets and continuous phase. The specific sizes of the different devices used in the experiment are listed
in Table 1. The square glass tube (cross-sectional area is 1.2×1.2 mm2) is used as a transport channel for the
continuous phase. Figure 1 shows a schematic of the
co-flowing device.
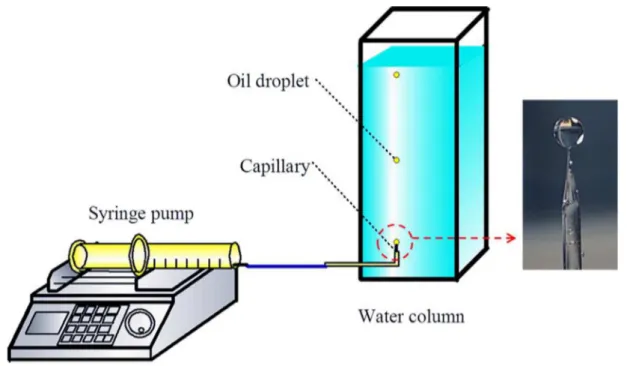
Since the preparation process of oil and toluene droplets is essentially similar, the following part only describes the preparation of micron-sized oil droplets. Figure 2 shows the experimental setup. Soybean oil and deionized water were pumped into the
microfluidic device as the dispersed and continuous
phases separately by two syringe pumps (LSP01-2A).
The flow rate of the continuous phase was varied from 12 to 300 mL/h, while the flow rate of the dispersed
phase was kept at 30 µL/h. The material parameters
of the two fluids are given in Table 2. All the droplets
were produced at room temperature and atmospheric pressure. The micro-droplet formation process in the
microfluidic chip was visualized and recorded by a
stereo microscope (ZSA302T, China) with a COMS camera. The droplet size was measured from the microscopic images by using particle size analysis software.
As depicted in Figure 3, the process of oil droplet formation can be divided into three stages. (i) The droplet keeps growing at the capillary tip as the oil phase is injected into the droplet. In this case the interfacial tension force, which always makes the droplet attach to the tip, dominates rather than the
viscous drag, the pressure difference and the inertial forces, which always cause the droplet to pinch off.
(ii) The droplet starts to separate slowly from the tip and a neck forms. In this case, the drag force keeps increasing and eventually becomes comparable to the interfacial tension force due to the increasing projected area of the growing droplet. (iii) The neck shrinks
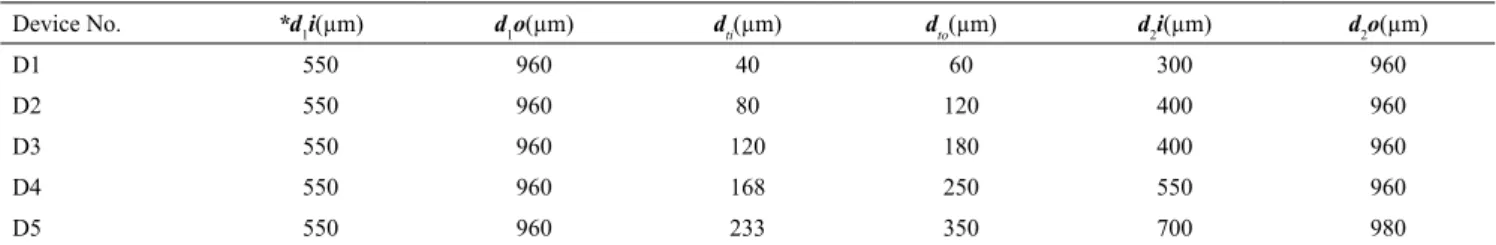
Table 1. The sizes of glass capillaries used in various microfluidic devices.
Device No. *d
1i(µm) d1o(µm) dti(µm) dto(µm) d2i(µm) d2o(µm)
D1 550 960 40 60 300 960
D2 550 960 80 120 400 960
D3 550 960 120 180 400 960
D4 550 960 168 250 550 960
D5 550 960 233 350 700 980
*d1i and d1o are the inner and outer diameters of the injecting capillary, dti and dto are the inner and outer diameters of the injecting capillary tip; d2i and d2o
712 Chaojun Deng, Weixing Huang, Haoyuan Wang, Shimeng Cheng, Xiongyuan He, Boya Xu
Table 2. Physical properties of the materials used in the experiment.
System Density Viscosity Interfacial
tension Temperature
Continuous
Phase Dispersed phase ρc (kg/m
3) ρ
d (kg/m
3) m
c (cP) md (cP) s(N/m) T(°C)
Water Soybean oil 998.4 917.5 1.04 49.50 0.0195 19.3
Water Toluene 997.6 864.2 0.937 0.606 0.035 22.8
Figure 1. Co-flowing microfluidic devices with different capillary sizes.
Figure 2. Experimental setup for micro-droplet preparation.
rapidly and the droplet pinches off. In the experiment,
highly monodisperse oil droplets covering from 100
to 600 µm were obtained by using the above five co-flowing microfluidic devices.
Effect of the continuous-phase flow rate on droplet diameter
Figure 4 presents the measured diameters of oil droplets (dp) versus the volume flow rate of water (Qw)
for each device. For a given device, with increasing
water flow rate, the dp decreased. This is due to the fact
that the increasing water flow rate induces a higher
velocity gradient on the oil-water interface, leading the viscous drag force acting on the droplet to increase and become large enough to overcome the interfacial tension force; thus, smaller droplets form. However, the droplet diameter could never be smaller than the
Figure 3. Micrographs of micro-droplet formation.
Figure 4. Droplet diameter as a function of water flow rate for different devices. (Qo = 0.03 mL/h for the device D1-3; Qo = 0.10 mL/h for the
device D4, 5).
Thus, only if a bigger droplet forms can the drag force become large enough to overcome the interfacial
tension force under the same flow rate condition.
Effect of the dispersed-phase flow rate on droplet diameter
Figure 5 shows the effect of oil flow rate (Qd) on the droplet diameter (dp). For two devices (D1, D2), with increasing Qd from 30 to 300 µL/h at a fixed water
flow rate Qc =90 mL/h, the dp scarcely varies. That is because the Qd is far less than Qc. The inertial force induced by the oil phase is always much lower than the viscous drag force induced by the water phase, as well as the interfacial tension force. On the other hand, the
Qd apparently affects the droplet generation frequency
(f), which can be calculated by the mass conservation of the oil phase.
(1)
The results show that f increases with the increase of Qd , and the growth rate of the f of smaller droplets produced by the smaller device (D1) is obviously higher than that of larger droplets produced by the larger device (D2). Accordingly, Qd is a critical operating parameter for controlling the production of monodisperse single droplets and droplet swarms. With the established method for preparing uniform micro-droplets in a controllable and reproducible manner, more experiments on the hydrodynamics of
where the droplet forms and pinches off near the tip. In
this experiment, all the droplets form in the dripping
flow regime. For the device D1, the dp decrease from 253.9 to 80.4 mm upon increasing Qw from 12 to 300
mL/h at a fixed oil flow rate, Qd = 0.03 mL/h. When the Qw exceeds about 150 mL/h, the decrease of dp
with the increase of Qw becomes very slow, and the
dp never becomes smaller than the tip diameter (dto). Similar results were also obtained in previous work (Cramer et al., 2004; Moon et al., 2014).
In addition, it is found that the device with larger capillary leads to bigger droplets. Obviously, a larger capillary tip causes a larger interfacial tension force.
f
d
Q
6
p d
3
r
714 Chaojun Deng, Weixing Huang, Haoyuan Wang, Shimeng Cheng, Xiongyuan He and Boya Xu
Figure 5. The effect of dispersed phase flow rate on the droplet size and generation frequency.
micro-droplets moving in a continuous phase become possible.
Correlation of droplet diameter
The droplet formation mechanism in a faucet dripping into air has been extensively studied. In their studies, the droplet formation is dominated by gravity, interfacial tension and inertial forces (Ambravaneswaran et al., 2000; Subramani et al., 2006; Wilkes et al., 1999). In the co-flowing
microchannel, the droplet formation is dominated by the interfacial tension, viscous, and inertial force, which can be characterized by the Capillary number and Reynolds number. Further, by taking into account
the effect of the viscosity ratio of two phases, a
correlation for dimensionless droplet diameter as a function of Capillary number (Ca), Reynolds number (Re) and viscosity ratio was proposed.
(2)
where Cac and Cad are the Capillary numbers of the continuous and dispersed phases, respectively, which
are defined as the ratio of the viscous force to the
interfacial tension force.
(3)
Red is the Reynolds number of the dispersed phase.
It is defined as the ratio of the inertial force to viscous
force.
(4)
Figure 6 shows that the droplet diameter predicted
by the correlation fits well with the experimental data
for both toluene and oil droplets. The average error of the calculated results is 5.3% and the maximum error is 14.9%. In this experiment, the continuous-phase Capillary number is in the range of 1.5×10⁻³≤
Cac ≤ 4.4×10⁻², the dispersed-phase Capillary number
is in the range of 5.6×10⁻⁵≤Ca
d ≤ 1.7×10
-3, and the
dispersed-phase Reynolds number is 0.016 ≤ Red ≤
3.78.
Figure 6. Comparison of the correlated and experimental data.
Millimeter-sized droplet preparation by a tradi-tional method
Droplet extraction is one of the traditional methods for generating dispersed droplets by injecting the
dispersed phase through a nozzle or an orifice plate
into an immiscible continuous phase. Figure 7 is the experimental setup for millimeter-sized droplet preparation. Toluene was pumped by a syringe pump
(LSP01-2A, China) into a rectangular column filled
with deionized water via a hose, and the droplets were formed at the capillary tip. The column was assembled with PMMA plates, which was visualized for observations. The physical properties of the materials used in the experiment are summarized in Table 2. Millimeter-sized toluene droplets were produced by seven capillaries with inner diameter ranging from 0.18 to 4.0 mm. Table 3 lists the droplet
sizes corresponding to different size capillaries.
HYDRODYNAMIC EXPERIMENTS OF
MICRO-DROPLETS RISING IN WATER
Hydrodynamic experiments of oil and toluene droplets rising in water were conducted in a transparent
/
.
/
Re
d d
Ca
Ca
27 3
.. . .
p ti d c
d c d
0 88
0 45 0 28 0 38
n
n
=
--
-Q
V
,
Ca
cu
Ca
u
c c
d
d d
v
n
v
n
=
=
Re
dd u
dd ti d
n
t
Table 3. Specifications of the capillaries used in the experiment.
I.D.(mm) O.D. (mm) Droplet diameter d
p(mm) Material
C1 0.018 0.035 1.09-1.68 Borosilicate
C2 0.045 0.060 1.88-2.70 Borosilicate
C3 0.210 0.360 2.83-3.58 Borosilicate
C4 0.500 0.960 3.73-5.08 Borosilicate
C5 1.000 1.800 4.57-6.45 Stainless Steel
C6 1.400 3.800 5.45-7.96 PE
C7 4.000 6.000 8.73-9.29 PE
Figure 7. Experimental setup for millimeter-sized droplet preparation.
vertical rectangular column as shown in Fig. 2. The height and cross-sectional area of the column are 1200 mm and 200×200 mm2. The wall effect can be
neglected since the column size is much greater than the
droplet size. To rule out the influence of impurities and
surfactants on the terminal velocity of the droplet, all the water used in the experiment was deionized water to keep the system pure (Myint et al., 2006). A digital camera (Nikon D500, Japan) was used to observe and record the movement of single droplets and droplet swarms. A digital-display stopwatch was used to measure the travel time of droplets rising in the column, and mean velocity of oil droplets was calculated by the travel time needed pass a known distance. For micron-sized droplets a distance of hundreds of millimeters is
sufficient for reliable stop clock operations. The mean
velocity represents the terminal velocity of the droplet since its acceleration time is quite short. The terminal velocity of a droplet swarm is obtained by measuring the average velocity of droplets in the swarm. All the experiments were repeated at least 7 times to satisfy
statistical significance. For all measurements, the
reproducibility was found to be very satisfactory.
Terminal velocity of single droplets
Soybean oil/water and toluene/water, representing systems with low and high interfacial tension, were investigated. Figure 8 shows the terminal velocity (UT) of single oil and toluene droplets rising in water. Toluene droplets have a higher UT than soybean oil droplets with the same size since toluene droplets are subjected to a greater buoyance force due to their smaller density. With increasing droplet diameter (dp), the terminal velocity increased approximately linearly. For comparison, the terminal velocity of a rigid spherical particle with the same density and size moving in a stagnant liquid due to gravity and buoyancy forces is calculated by the following equation (Green and Perry, 2008).
(5)
where CD is the drag coefficient. Brauer (1973)
proposed a correlation for calculating the drag
coefficient of a rigid sphere.
U
C
gd
3
4
T
D c
p d c
t
t
t
716 Chaojun Deng, Weixing Huang, Haoyuan Wang, Shimeng Cheng, Xiongyuan He and Boya Xu
Figure 8. Terminal velocity of a single droplet as a function of droplet diameter. (Oil droplets of size from 127.7 to 599.0 μm; Toluene droplets of size from 125.9 to 596.6 μm.)
(6)
The comparison shows that the UT of both oil and toluene micro-droplets are in excellent agreement with that of the corresponding rigid spheres, which indicates that the internal circulation inside the micro-droplets is very weak or disappeared. Besides, visual observation showed that the micro-droplets always maintained a spherical shape without deformation in the rising process for both systems. That is due to a great internal pressure (the Young-Laplace pressure,
∆P=4 σ/dp) inside the micro-droplet caused by the interfacial tension, which always tries to restore the spherical shape. For instance, the pressure inside a toluene droplet of size 100 µm can reach 1.4 kPa. Consequently, the micro-droplet rising in water behaves as a rigid sphere.
Terminal velocity of droplet swarms
A swarm of droplets is defined as containing
more than 10 droplets rising in a group as shown in Figure 9. Based on experimental observation, a droplet swarm ascending in static water is not in a translation pattern, but shows a behavior in which each droplet in the swarm alternately accelerates to catch up with others ahead and their relative positions keep varying. For instance, a droplet can be located at the back of
the swarm at first but later it accelerates and passes
the others, as shown in Fig. 9. This is due to the wake
effect, which reduces the resistance on the droplets
following behind the preceding ones, leading to a rapid acceleration.
Figure 9. Hydrodynamic behavior of a droplet swarm.
In the rising process, all the droplets in the swarm keep accelerating by chasing others, thus causing the swarm to rise faster. Figure 10 shows the comparison of the terminal velocities of oil and toluene droplet swarms and single droplets. Not surprisingly, the terminal velocity of the droplet swarm is about 25% higher than that of a single droplet with the same size under Reynolds number Re < 10.
Figure 10. Comparison of the terminal velocities of droplet swarm and single droplet.
HYDRODYNAMIC BEHAVIOR OF A
SINGLE DROPLET RISING IN WATER
Terminal velocity of a single toluene droplet
The terminal velocities of single toluene droplets with a wide size range from 0.1 to 9.3 mm rising in water were extensively investigated. Figure 11 shows the variation of the terminal velocity with droplet diameter, which can be divided into three parts. For the small-sized droplets (<1 mm), UT increases with increasing dp and agrees well with that of the same-sized rigid sphere calculated from Eq. (5). For the medium-sized droplets (1~4.6 mm), UT keeps increasing with the increase of dp and becomes higher than that of
.
.
.
Re
Re
Re
Re
Re
C
24
3 72
1
4 83
3
10
10
0 49
3
10
. .
.
D 0 5 6 1 5
3 0 5
5
#
#
#
1
=
+
-+
+
the corresponding rigid sphere. For the large-sized droplets (4.6~9.3 mm), UT tends to decrease with increasing dp and eventually becomes lower than that of the rigid sphere.
Figure 11. Terminal velocity of single toluene droplets in water as a function of droplet diameter.
For comparison, the terminal velocities of toluene droplets ranging from 1.0 to 7.0 mm reported by Wegener et al. (2010) were also plotted in Fig. 11. Both the measured results and the experimental data of Wegener et al. (2010) show that the UT of droplets sizing from 1 to 4.6 mm are higher than that of the corresponding rigid spheres. That is because the internal circulation inside the droplet reduces the
friction drag. To avoid the influence of impurities
on the circulation, deionized water was used in our experiment and, in Wegener’s experiment, ultra-pure
grade water with a specific resistance of 18.3 MΩ
cm was used to guarantee high purity of the system. However, the measured terminal velocities are apparently lower than Wegener’s experimental ones. A reasonable explanation is that the internal circulation is highly sensitive to the system purity. The presence of only trace amounts of impurities absorbed on the droplet interface may retard and weaken the internal circulation, causing the terminal velocity to reduce.
Explanation of the variation of drag coefficient
with droplet size
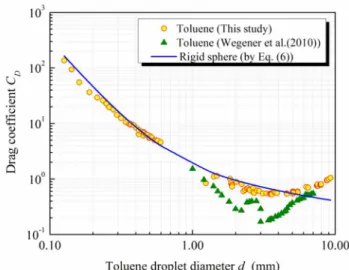
Figure 12 shows the variation of the drag coefficient
(CD) of single toluene droplets with the droplet diameter (dp). The CD of a rigid sphere always decreases with the increase of dp, while the CD of a toluene droplet with dp no longer exhibits a monotonic trend because
of the different varying trends of the shape and friction drag coefficients.
For the micro-droplets (less than 1 mm), CD
decreases with the increase of dp . In this case, the
Figure 12. Drag coefficient as a function of droplet diameter.
strength of internal circulation inside the droplet is very weak and the droplet interface is nearly immobile,
thus the friction drag coefficient is almost the same as
that of the same-sized rigid sphere. Meanwhile the pressure drag of the droplet is also identical to that of a rigid sphere with the same size since the micro-droplet always maintains its spherical shape in the rising
process. Consequently, the total drag coefficient of the
micro-droplet shows an excellent agreement with that of a corresponding rigid sphere.
As the dp increases from microns to millimeters, CD
of droplets of size from 1 to 3 mm keeps decreasing with the increase of dp, but it is always smaller than the CD of the same-sized rigid sphere. In this case, the droplet deforms slightly but still approximately maintains the spherical shape, which means the
shape drag coefficient is roughly equal to that of a
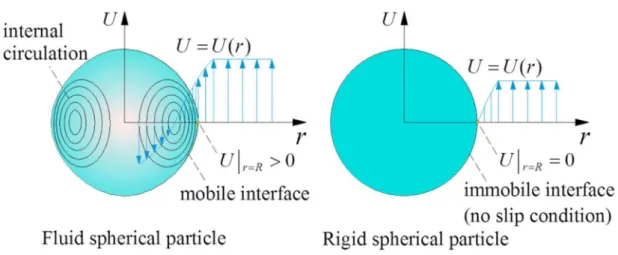
corresponding rigid sphere. On the other hand, vast researches have found that internal circulation does exist in droplets larger than 1 mm (Amar et al., 2005; Wegener et al., 2010). As illustrated in Fig. 13, the
interfacial velocity gradient around a spherical fluid particle is significantly lower than that of a rigid sphere, leading its friction drag coefficient to become
smaller than that of a rigid sphere. As dp increases, the strength of internal circulation caused by the shear
from external fluid becomes stronger and stronger, so that the friction drag coefficient decreases. Therefore,
the total CD is smaller than that of the same-sized rigid sphere.
As dp grows larger than 3 mm, CD starts to increase with the increase of dp, and eventually becomes greater than that of the corresponding rigid sphere when dp
718 Chaojun Deng, Weixing Huang, Haoyuan Wang, Shimeng Cheng, Xiongyuan He and Boya Xu
Figure 13. Comparison of velocity profiles around a fluid spherical particle and a rigid spherical particle.
pressure weakens. With the increase of dp, the droplet tends to deform into an ellipsoid which has a larger projected area, resulting in an increase in the shape
drag coefficient. Although the presence of internal
circulation inside the ellipsoidal droplet reduces the friction drag to some extent, in this case the total drag
coefficient is dominated by the shape drag coefficient rather than the friction drag coefficient. Consequently,
the total CD increases with the increase of dp, and ultimately exceeds that of the rigid sphere. This explains why the terminal velocities of the droplets (>4.6 mm) are lower than that of the corresponding rigid spheres.
CONCLUSIONS
Employing co-flowing microfluidic devices,
droplets of sizes from 100 to 600 µm are controllably prepared using soybean oil and toluene as dispersed phases and water as the continuous phase. The device
dimensions and the flow condition both affect the
droplet size (dp). The smaller size capillary gives smaller dp and, for a given device, the dp decreased
as the flow rate of continuous phase increased. The increased flow rate of dispersed phase had little effect on the dp , but caused the frequency of droplet generation to enhance so that droplet swarms appear. For the prediction of droplet size, a correlation for dimensionless droplet diameter with viscosity ratio of the two phases, Capillary number and Reynolds number was presented.
Further, the hydrodynamic behaviors of single droplets and droplet swarms rising in quiescent water are studied extensively. It is found that a micro-droplet maintains its spherical shape well in the rising process due to the interfacial tension and behaves as a rigid
sphere, so that its terminal velocity (UT) is in a good agreement with that of a rigid sphere with the same size and density. Compared with single droplets, the motion of droplet swarms is more complicated. When rising, each droplet in the swarm alternately accelerates
by chasing others due to the wake effect, causing the
droplet swarm to have a higher UT . The measurement shows that UT of droplet swarms is about 25% higher than that of single droplets with the same size under the droplet Reynolds number Re<10.
As dp increases from microns to a few millimeters, single droplets no longer behave like a rigid sphere. The droplets of size from 1 to 4.6 mm will move faster than rigid spheres due to the internal circulation, which reduces the friction drag. But when the droplet size becomes greater than 4.6 mm, the shape drag will become dominant due to the large deformation of droplet shape, so that UT ultimately becomes lower than that of a corresponding rigid sphere.
ACKNOWLEDGEMENTS
This research was supported by the National Science and Technology Support Program of China (Grant No. 2013BAC12B01). The authors are grateful to Prof. Liangying Chu (Membrane Science and Functional Materials Group, Sichuan University) for
supplies of microfluidic equipment.
NOMENCLATURE
dp - droplet diameter (μm)
f - Droplet generation frequency (s-1) Q - volume flow rate (mL/h)
UT - terminal velocity of the droplet (mm/s)
ρ - density (kg/m3) μ - viscosity (Pa•s)
σ - interfacial tension (N/m)
γ - dynamic viscosity ratio of the dispersed phase to continuous phase
Subscripts o - soybean oil
w - deionized water
d - dispersed phase
c - continuous phase
t - the tapered tip of the injecting capillary
Dimensionless numbers CD- drag coefficient
Re - Reynolds number Ca - Capillary number
REFERENCES
Ambravaneswaran, B., Phillips, S. D., Basaran, O. A., Theoretical analysis of a dripping faucet. Physical Review Letters, 85(25) 5332-5335 (2000).
Amar, A., Groß-Hardt, E., Khrapitchev, A. A., Stapf,
S., Pfennig, A., Blümich, B., Visualizing flow
vortices inside a single levitated drop. Journal of Magnetic Resonance, 177(1) 74-85 (2005).
Brauer, H. Momentum, mass, and heat-transfer through boundary surface of spherical- particles. Chemie Ingenieur Technik, 45(18) 1099-1103 (1973).
Castro-Hernandez, E., Gundabala V., Fernández-Nieves, A., Gordillo, J. M., Scaling the drop size
in co-flow experiments. New Journal of Physics,
11(7), 075021 (2009).
Clift, R., Grace, J. R., Weber, M. E., Bubbles, Drops and Particles. Academic Press, New York (1978). Dreyfus, R., Tabeling, P., Willaime, H., Ordered
and disordered patterns in two-phase flows in
microchannels. Physical Review Letters, 90(14), 144505 (2003).
Duangsuwan, W., Tuzun, U., Sermon, P. A., The dynamics of single air bubbles and alcohol drops
in sunflower oil at various temperatures. AIChE
Journal, 57(4) 897-910 (2010).
Grace, J. R., Wairegi, T., Nguyen, T.H., Shapes and velocities of single drops and bubbles moving freely through immiscible liquids. Transactions of the Institution of Chemical Engineers, 54(3) 167-173 (1976).
Green, D. W. and Perry, R. H., Perry’s Chemical Engineers’ Handbook, 8th edition McGraw-Hill, New York (2008).
Kelbaliyev, G. and Ceylan, K., Development of new empirical equations for estimation of
drag coefficient, shape deformation, and rising
velocity of gas bubbles or liquid drops. Chemical Engineering Communications, 194(12) 1623-1637 (2007).
Li, X. and Mao, Z., The effect of surfactant on the
motion of a buoyancy-driven drop at intermediate Reynolds numbers: A numerical approach. Journal of Colloid and Interface Science, 240(1) 307-322 (2001).
Liu, L., Tang, H., Quan, S., Shapes and terminal velocities of a drop rising in stagnant liquids. Computers & Fluids, 81 17-25 (2013).
Myint, W., Hosokawa, S., Tomiyama, A., Terminal velocity of single drops in stagnant liquids. Journal of Fluid Science and Technology, 1(2) 72-81 (2006).
Peters, F., Nüllig, M., Miletic, D., Rise of oil drops in water and fall of water drops in oil. Forschung im Ingenieurwesen, 78(3-4), 87-91 (2014).
Premlata, A. R., Tripathi M. K., Sahu, K. C., Dynamics
of rising bubble inside a viscosity- stratified
medium. Physics of Fluids, 27, 072105 (2015). Premlata, A. R., Tripathi, M. K., Karri, B., Sahu, K.
C., Dynamics of an air bubble rising in a non-Newtonian liquid in the axisymmetric regime. Journal of Non-Newtonian Fluid Mechanics, 239 53-61 (2017).
Rao, A., Reddy, R. K., Ehrenhauser, F., Nandakumar, K., Thibodeaux, L. J., Rao, D., Valsaraj, K. T.,
Effect of surfactant on the dynamics of a crude
oil droplet in water column: Experimental and numerical investigation. The Canadian Journal of Chemical Engineering, 92(12) 2098-2114 (2014). Subramani, H. J., Yeoh, H. K., Suryo, R., Xu, Q.,
Ambravaneswaran, B., Basaran, O. A., Simplicity and complexity in a dripping faucet. Physics of Fluids, 18(3), 032106 (2006).
Tomiyama, A, Celata, G. P., Hosokawa, S., Yoshida, S., Terminal velocity of single bubbles in surface tension force dominant regime. International Journal of Multiphase Flow, 28(9) 1497-1519 (2002).
Tripathi, M. K., Sahu, K. C., Govindarajan, R., Why a falling drop does not in general behave like a rising
bubble. Scientific Reports, 4, 4771 (2014).
720 Chaojun Deng, Weixing Huang, Haoyuan Wang, Shimeng Cheng, Xiongyuan He and Boya Xu
Ulmeanu, M., Preparation and characterization of
water in oil emulsion via drop break-off. Colloids
and Surfaces A: Physicochemical and Engineering Aspects, 316 119-124 (2008).
Wang, K., Xie, L., Lu, Y., Luo, G., Generating
microbubbles in a co-flowing microfluidic device.
Chemical Engineering Science, 100(2) 486-495 (2013).
Wegener, M., Grünig, J., Stüber, J., Paschedag, A. R., Kraume, M., Transient rise velocity and mass transfer of a single drop with interfacial instabilities-experimental investigations. Chemical Engineering Science, 62(11) 2967-2978 (2007).
Wegener, M., Kraume, M., Paschedag, A. R., Terminal and transient drop rise velocity of single toluene droplets in water. AIChE Journal, 56(1) 2-10 (2010).
Wegener, M., Paul, N., Kraume, M., Fluid dynamics and mass transfer at single droplets in liquid/liquid systems. International Journal of Heat and Mass Transfer, 71(1) 475-495 (2014).